Free Statistics

of Irreproducible Research!

Author's title

Author*The author of this computation has been verified*
R Software Modulerwasp_hierarchicalclustering.wasp
Title produced by softwareHierarchical Clustering
Date of computationMon, 10 Nov 2008 15:10:28 -0700
Cite this page as followsStatistical Computations at FreeStatistics.org, Office for Research Development and Education, URL https://freestatistics.org/blog/index.php?v=date/2008/Nov/10/t1226355114r1q0o71yy94x9pq.htm/, Retrieved Sun, 19 May 2024 10:20:31 +0000
Statistical Computations at FreeStatistics.org, Office for Research Development and Education, URL https://freestatistics.org/blog/index.php?pk=23214, Retrieved Sun, 19 May 2024 10:20:31 +0000
QR Codes:

Original text written by user:
IsPrivate?No (this computation is public)
User-defined keywords
Estimated Impact219
Family? (F = Feedback message, R = changed R code, M = changed R Module, P = changed Parameters, D = changed Data)
F     [Partial Correlation] [Partial correlation] [2008-11-08 12:17:14] [82d201ca7b4e7cd2c6f885d29b5b6937]
F RMPD  [Hierarchical Clustering] [Compete] [2008-11-09 12:18:16] [82d201ca7b4e7cd2c6f885d29b5b6937]
F    D      [Hierarchical Clustering] [Complete clustering] [2008-11-10 22:10:28] [d6e9f26c3644bfc30f06303d9993b878] [Current]
F   P         [Hierarchical Clustering] [Ward] [2008-11-10 22:13:06] [8d78428855b119373cac369316c08983]
Feedback Forum
2008-11-14 10:37:42 [Ciska Tanghe] [reply
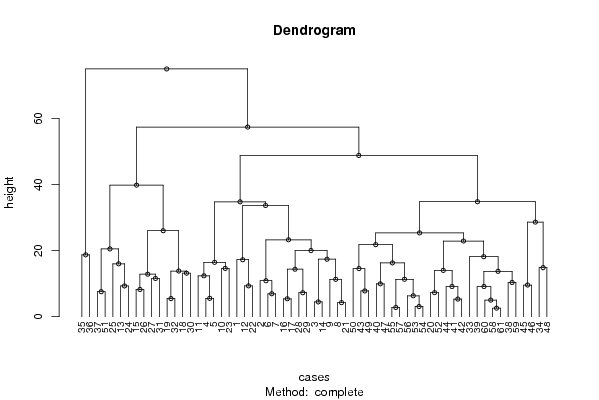
Hoe interpreteer je deze grafiek?
2008-11-19 15:09:25 [Gregory Van Overmeiren] [reply
We zien dat de cluster hierarchisch is opgebouwd. Alle observaties vallen uit elkaar in verschillende groepen.
2008-11-20 10:07:44 [An De Koninck] [reply
Er is sprake van een strenge hierarchie.Per tak worden de observaties 'geclusterd' die ongeveer hetzelfde resultaat geven.

Op het eerste zicht zien we de tak uiteenvallen in 2 subtakken en als je dan naar deze 2 subtakken kijkt zie je dat de rechtertak veel dichter bevolkt is dan de linkertak.
De linkertak valt immers maar uiteen in 2 neventakken, maar de rechtertak daarentegen vertakt nog erg veel. Er zijn dus meer observaties die onder de rechter-subtak vallen dan onder de linker-subtak.
De zou deze 2 subtakken kunnen gelijkstellen aan periodes. Een periode waar iets weinig voorkomt, een periode waar iets veel voorkomt.
2008-11-21 18:37:19 [Michael Van Spaandonck] [reply
Hierarchical clustering geeft de clustering van de verschillende maandresultaten weer.
Deze techniek geeft iedere observatie een volgnummer en laat toe na te gaan welke van de verschillende observaties als gemeenschappelijk beschouwd kunnen worden.
Deze methode wordt veelal toegepast op niet-tijdreeksen.

Wat betreft de interpretatie sluit ik me aan bij An. Clustering komt hier eigenlijk zo goed als niet voor, getuige het grote aantal vertakkingen.
2008-11-23 21:54:09 [Isabel Wilms] [reply
Het dendogram wordt meestal gebruikt voor niet-tijdreeksen vb: in de marketing, om producten die samen horen te categoriseren.
Het dendogram geeft een clustering weer van observaties (maanden), er staat ook telkens een volgnummer bij. Welke observaties van de tijdreeksen gelijkaardig zijn, worden geclusterd, vormen dus aparte takken. Des te minder clusters er gevormd worden, des te meer verband in de tijdreeksen.
2008-11-24 15:48:49 [Bernard Femont] [reply
Hierarchical clustering geeft de clustering van de verschillende maandresultaten weer. Deze methode geeft iedere observatie een volgnummer en laat toe na te gaan welke van de verschillende observaties als gemeenschappelijk beschouwd kunnen worden. Deze methode wordt veelal toegepast op niet-tijdreeksen. Met deze clusteringtechniek gaat men zien welke observaties als gemeenschappelijk kunnen gezien worden in een bepaalde periode. In dit geval vallen de observaties in 2 groepen en deze groepen zijn telkens nog eens onderverdeeld in verschillende categorieën tot men op 1 observatie komt. Meestal gebruikt men deze techniek voor niet-tijdreeksen vb: hulpmiddel voor de marketing (vb marktsegmentatie). Op het eerste zicht zien we de tak uiteenvallen in 2 subtakken en als je dan naar deze 2 subtakken kijkt zie je dat de rechtertak veel dichter bevolkt is dan de linkertak. De linkertak valt immers maar uiteen in 2 neventakken, maar de rechtertak daarentegen vertakt nog erg veel. Er zijn dus meer observaties die onder de rechter-subtak vallen dan onder de linker-subtak. De zou deze 2 subtakken kunnen gelijkstellen aan periodes. Een periode waar iets weinig voorkomt, een periode waar iets veel voorkomt.
2008-11-24 19:36:14 [Koen Van den Heuvel] [reply
Een dendogram gaat de gelijkaardige observaties/gegevens clusteren aan de hand van een aantal mogelijke technieken.
Zo ontstaat er een boomstructuur, met bovenaan 1 groep die dan verder wordt uitgesplitst in clusters met ongeveer dezelfde kenmerken. Zo zouden bvb 2 grote clusters in de tijd kunnen worden opgemerkt die wijzen op een trend.

Post a new message
Dataseries X:
116.1	117.1	118.9	100.3
102.5	107.0	108.8	97.6
102.0	107.0	115.6	89.1
101.3	111.0	95.0	99.1
100.6	108.2	92.8	94.9
100.9	96.3	108.9	96.5
104.2	100.9	109.8	92.6
108.3	107.7	106.1	80.8
108.9	106.2	102.8	89.5
109.9	118.7	98.4	101.4
106.8	116.1	85.7	95.9
112.7	118.1	114.6	92.3
113.4	118.4	129.4	91.2
101.3	110.8	117.7	88.3
97.8	106.4	126.6	80.7
95.0	112.2	103.8	89.9
93.8	108.3	101.5	87.2
94.5	96.0	118.7	86.9
101.4	100.6	119.6	82.8
105.8	107.8	114.8	72.6
106.6	108.4	109.9	81.3
109.7	120.9	106.3	91.2
108.8	117.3	95.0	87.3
113.4	119.7	124.5	83.4
113.7	119.6	140.4	81.7
103.6	111.8	128.8	80.2
98.2	108.1	137.5	74.1
95.5	111.8	113.3	80.6
94.4	105.5	110.3	79.0
95.9	93.6	129.1	79.3
103.2	103.9	128.4	71.2
104.1	100.3	120.3	78.1
127.6	106.6	113.6	68.2
130.3	118.4	96.9	81.0
133.0	106.6	124.7	106.9
140.4	109.8	126.4	123.7
123.5	115.9	131.9	73.7
116.9	111.7	122.5	69.2
115.9	119.8	113.1	72.5
113.1	116.1	99.8	75.7
112.1	103.2	116.0	73.5
112.4	99.0	115.0	70.4
118.9	112.3	114.0	65.7
117.4	104.2	111.0	68.1
115.6	114.0	91.7	62.4
120.7	121.7	90.6	64.7
114.9	107.2	103.3	77.7
122.0	112.8	106.7	85.9
119.6	117.8	111.2	61.0
114.6	113.3	102.9	57.4
118.4	116.1	126.5	75.1
110.9	111.8	115.1	75.9
111.6	110.2	110.2	71.8
114.6	110.0	110.1	72.3
112.1	102.9	103.3	67.3
117.4	110.1	107.7	71.5
114.8	102.7	103.9	67.6
123.4	118.7	114.0	74.2
118.1	109.0	117.2	77.6
121.9	115.7	117.0	76.4
123.3	118.1	116.5	74.2


Summary of computational transaction
Raw Inputview raw input (R code)
Raw Outputview raw output of R engine
Computing time3 seconds
R Server'Herman Ole Andreas Wold' @ 193.190.124.10:1001

\begin{tabular}{lllllllll}
\hline
Summary of computational transaction \tabularnewline
Raw Input & view raw input (R code)  \tabularnewline
Raw Output & view raw output of R engine  \tabularnewline
Computing time & 3 seconds \tabularnewline
R Server & 'Herman Ole Andreas Wold' @ 193.190.124.10:1001 \tabularnewline
\hline
\end{tabular}
%Source: https://freestatistics.org/blog/index.php?pk=23214&T=0

[TABLE]
[ROW][C]Summary of computational transaction[/C][/ROW]
[ROW][C]Raw Input[/C][C]view raw input (R code) [/C][/ROW]
[ROW][C]Raw Output[/C][C]view raw output of R engine [/C][/ROW]
[ROW][C]Computing time[/C][C]3 seconds[/C][/ROW]
[ROW][C]R Server[/C][C]'Herman Ole Andreas Wold' @ 193.190.124.10:1001[/C][/ROW]
[/TABLE]
Source: https://freestatistics.org/blog/index.php?pk=23214&T=0

Globally Unique Identifier (entire table): ba.freestatistics.org/blog/index.php?pk=23214&T=0

As an alternative you can also use a QR Code:  

The GUIDs for individual cells are displayed in the table below:

Summary of computational transaction
Raw Inputview raw input (R code)
Raw Outputview raw output of R engine
Computing time3 seconds
R Server'Herman Ole Andreas Wold' @ 193.190.124.10:1001


Summary of Dendrogram
LabelHeight
12.57293606605372
22.78926513619628
33.04959013639538
44.25088226136647
54.4698993277254
65.00899191454728
75.32353266168247
85.40647759636531
95.4735728733616
105.55067563455116
116.32376470150496
126.93325320466519
137.24292758489272
147.27942305406137
157.56108457828637
167.78909494100566
178.2395388220458
189.1230477363653
199.12414379544734
209.30268778364619
219.32416216075203
229.5812316536028
239.93478736561583
2410.3624321469431
2510.8752011475650
2611.3039815994189
2711.3092882180975
2811.5697882435246
2912.3689126442060
3012.8615706661356
3113.1772531280233
3213.7295302177460
3313.8206367436526
3414.0124944246198
3514.3634953963163
3614.5461335068808
3714.6130079039190
3814.842506526864
3915.9937487788198
4016.2748271880226
4116.4423234367896
4217.2328175293537
4317.3887894920837
4418.1623236398870
4518.7117610074520
4620.0094977448211
4720.5124352527924
4821.8116941111872
4922.9026199374657
5023.2718714331272
5125.3627679877414
5226.0265249313081
5328.6295302092088
5433.661550766416
5534.7719714712870
5634.8142212321344
5739.8182119136457
5848.8193609134737
5957.414632281327
6075.0055331292299

\begin{tabular}{lllllllll}
\hline
Summary of Dendrogram \tabularnewline
Label & Height \tabularnewline
1 & 2.57293606605372 \tabularnewline
2 & 2.78926513619628 \tabularnewline
3 & 3.04959013639538 \tabularnewline
4 & 4.25088226136647 \tabularnewline
5 & 4.4698993277254 \tabularnewline
6 & 5.00899191454728 \tabularnewline
7 & 5.32353266168247 \tabularnewline
8 & 5.40647759636531 \tabularnewline
9 & 5.4735728733616 \tabularnewline
10 & 5.55067563455116 \tabularnewline
11 & 6.32376470150496 \tabularnewline
12 & 6.93325320466519 \tabularnewline
13 & 7.24292758489272 \tabularnewline
14 & 7.27942305406137 \tabularnewline
15 & 7.56108457828637 \tabularnewline
16 & 7.78909494100566 \tabularnewline
17 & 8.2395388220458 \tabularnewline
18 & 9.1230477363653 \tabularnewline
19 & 9.12414379544734 \tabularnewline
20 & 9.30268778364619 \tabularnewline
21 & 9.32416216075203 \tabularnewline
22 & 9.5812316536028 \tabularnewline
23 & 9.93478736561583 \tabularnewline
24 & 10.3624321469431 \tabularnewline
25 & 10.8752011475650 \tabularnewline
26 & 11.3039815994189 \tabularnewline
27 & 11.3092882180975 \tabularnewline
28 & 11.5697882435246 \tabularnewline
29 & 12.3689126442060 \tabularnewline
30 & 12.8615706661356 \tabularnewline
31 & 13.1772531280233 \tabularnewline
32 & 13.7295302177460 \tabularnewline
33 & 13.8206367436526 \tabularnewline
34 & 14.0124944246198 \tabularnewline
35 & 14.3634953963163 \tabularnewline
36 & 14.5461335068808 \tabularnewline
37 & 14.6130079039190 \tabularnewline
38 & 14.842506526864 \tabularnewline
39 & 15.9937487788198 \tabularnewline
40 & 16.2748271880226 \tabularnewline
41 & 16.4423234367896 \tabularnewline
42 & 17.2328175293537 \tabularnewline
43 & 17.3887894920837 \tabularnewline
44 & 18.1623236398870 \tabularnewline
45 & 18.7117610074520 \tabularnewline
46 & 20.0094977448211 \tabularnewline
47 & 20.5124352527924 \tabularnewline
48 & 21.8116941111872 \tabularnewline
49 & 22.9026199374657 \tabularnewline
50 & 23.2718714331272 \tabularnewline
51 & 25.3627679877414 \tabularnewline
52 & 26.0265249313081 \tabularnewline
53 & 28.6295302092088 \tabularnewline
54 & 33.661550766416 \tabularnewline
55 & 34.7719714712870 \tabularnewline
56 & 34.8142212321344 \tabularnewline
57 & 39.8182119136457 \tabularnewline
58 & 48.8193609134737 \tabularnewline
59 & 57.414632281327 \tabularnewline
60 & 75.0055331292299 \tabularnewline
\hline
\end{tabular}
%Source: https://freestatistics.org/blog/index.php?pk=23214&T=1

[TABLE]
[ROW][C]Summary of Dendrogram[/C][/ROW]
[ROW][C]Label[/C][C]Height[/C][/ROW]
[ROW][C]1[/C][C]2.57293606605372[/C][/ROW]
[ROW][C]2[/C][C]2.78926513619628[/C][/ROW]
[ROW][C]3[/C][C]3.04959013639538[/C][/ROW]
[ROW][C]4[/C][C]4.25088226136647[/C][/ROW]
[ROW][C]5[/C][C]4.4698993277254[/C][/ROW]
[ROW][C]6[/C][C]5.00899191454728[/C][/ROW]
[ROW][C]7[/C][C]5.32353266168247[/C][/ROW]
[ROW][C]8[/C][C]5.40647759636531[/C][/ROW]
[ROW][C]9[/C][C]5.4735728733616[/C][/ROW]
[ROW][C]10[/C][C]5.55067563455116[/C][/ROW]
[ROW][C]11[/C][C]6.32376470150496[/C][/ROW]
[ROW][C]12[/C][C]6.93325320466519[/C][/ROW]
[ROW][C]13[/C][C]7.24292758489272[/C][/ROW]
[ROW][C]14[/C][C]7.27942305406137[/C][/ROW]
[ROW][C]15[/C][C]7.56108457828637[/C][/ROW]
[ROW][C]16[/C][C]7.78909494100566[/C][/ROW]
[ROW][C]17[/C][C]8.2395388220458[/C][/ROW]
[ROW][C]18[/C][C]9.1230477363653[/C][/ROW]
[ROW][C]19[/C][C]9.12414379544734[/C][/ROW]
[ROW][C]20[/C][C]9.30268778364619[/C][/ROW]
[ROW][C]21[/C][C]9.32416216075203[/C][/ROW]
[ROW][C]22[/C][C]9.5812316536028[/C][/ROW]
[ROW][C]23[/C][C]9.93478736561583[/C][/ROW]
[ROW][C]24[/C][C]10.3624321469431[/C][/ROW]
[ROW][C]25[/C][C]10.8752011475650[/C][/ROW]
[ROW][C]26[/C][C]11.3039815994189[/C][/ROW]
[ROW][C]27[/C][C]11.3092882180975[/C][/ROW]
[ROW][C]28[/C][C]11.5697882435246[/C][/ROW]
[ROW][C]29[/C][C]12.3689126442060[/C][/ROW]
[ROW][C]30[/C][C]12.8615706661356[/C][/ROW]
[ROW][C]31[/C][C]13.1772531280233[/C][/ROW]
[ROW][C]32[/C][C]13.7295302177460[/C][/ROW]
[ROW][C]33[/C][C]13.8206367436526[/C][/ROW]
[ROW][C]34[/C][C]14.0124944246198[/C][/ROW]
[ROW][C]35[/C][C]14.3634953963163[/C][/ROW]
[ROW][C]36[/C][C]14.5461335068808[/C][/ROW]
[ROW][C]37[/C][C]14.6130079039190[/C][/ROW]
[ROW][C]38[/C][C]14.842506526864[/C][/ROW]
[ROW][C]39[/C][C]15.9937487788198[/C][/ROW]
[ROW][C]40[/C][C]16.2748271880226[/C][/ROW]
[ROW][C]41[/C][C]16.4423234367896[/C][/ROW]
[ROW][C]42[/C][C]17.2328175293537[/C][/ROW]
[ROW][C]43[/C][C]17.3887894920837[/C][/ROW]
[ROW][C]44[/C][C]18.1623236398870[/C][/ROW]
[ROW][C]45[/C][C]18.7117610074520[/C][/ROW]
[ROW][C]46[/C][C]20.0094977448211[/C][/ROW]
[ROW][C]47[/C][C]20.5124352527924[/C][/ROW]
[ROW][C]48[/C][C]21.8116941111872[/C][/ROW]
[ROW][C]49[/C][C]22.9026199374657[/C][/ROW]
[ROW][C]50[/C][C]23.2718714331272[/C][/ROW]
[ROW][C]51[/C][C]25.3627679877414[/C][/ROW]
[ROW][C]52[/C][C]26.0265249313081[/C][/ROW]
[ROW][C]53[/C][C]28.6295302092088[/C][/ROW]
[ROW][C]54[/C][C]33.661550766416[/C][/ROW]
[ROW][C]55[/C][C]34.7719714712870[/C][/ROW]
[ROW][C]56[/C][C]34.8142212321344[/C][/ROW]
[ROW][C]57[/C][C]39.8182119136457[/C][/ROW]
[ROW][C]58[/C][C]48.8193609134737[/C][/ROW]
[ROW][C]59[/C][C]57.414632281327[/C][/ROW]
[ROW][C]60[/C][C]75.0055331292299[/C][/ROW]
[/TABLE]
Source: https://freestatistics.org/blog/index.php?pk=23214&T=1

Globally Unique Identifier (entire table): ba.freestatistics.org/blog/index.php?pk=23214&T=1

As an alternative you can also use a QR Code:  

The GUIDs for individual cells are displayed in the table below:

Summary of Dendrogram
LabelHeight
12.57293606605372
22.78926513619628
33.04959013639538
44.25088226136647
54.4698993277254
65.00899191454728
75.32353266168247
85.40647759636531
95.4735728733616
105.55067563455116
116.32376470150496
126.93325320466519
137.24292758489272
147.27942305406137
157.56108457828637
167.78909494100566
178.2395388220458
189.1230477363653
199.12414379544734
209.30268778364619
219.32416216075203
229.5812316536028
239.93478736561583
2410.3624321469431
2510.8752011475650
2611.3039815994189
2711.3092882180975
2811.5697882435246
2912.3689126442060
3012.8615706661356
3113.1772531280233
3213.7295302177460
3313.8206367436526
3414.0124944246198
3514.3634953963163
3614.5461335068808
3714.6130079039190
3814.842506526864
3915.9937487788198
4016.2748271880226
4116.4423234367896
4217.2328175293537
4317.3887894920837
4418.1623236398870
4518.7117610074520
4620.0094977448211
4720.5124352527924
4821.8116941111872
4922.9026199374657
5023.2718714331272
5125.3627679877414
5226.0265249313081
5328.6295302092088
5433.661550766416
5534.7719714712870
5634.8142212321344
5739.8182119136457
5848.8193609134737
5957.414632281327
6075.0055331292299


Parameters (Session):
par1 = complete ; par2 = ALL ; par3 = FALSE ; par4 = FALSE ;
Parameters (R input):
par1 = complete ; par2 = ALL ; par3 = FALSE ; par4 = FALSE ;
R code (references can be found in the software module):
par3 <- as.logical(par3)
par4 <- as.logical(par4)
if (par3 == 'TRUE'){
dum = xlab
xlab = ylab
ylab = dum
}
x <- t(y)
hc <- hclust(dist(x),method=par1)
d <- as.dendrogram(hc)
str(d)
mysub <- paste('Method: ',par1)
bitmap(file='test1.png')
if (par4 == 'TRUE'){
plot(d,main=main,ylab=ylab,xlab=xlab,horiz=par3, nodePar=list(pch = c(1,NA), cex=0.8, lab.cex = 0.8),type='t',center=T, sub=mysub)
} else {
plot(d,main=main,ylab=ylab,xlab=xlab,horiz=par3, nodePar=list(pch = c(1,NA), cex=0.8, lab.cex = 0.8), sub=mysub)
}
dev.off()
if (par2 != 'ALL'){
if (par3 == 'TRUE'){
ylab = 'cluster'
} else {
xlab = 'cluster'
}
par2 <- as.numeric(par2)
memb <- cutree(hc, k = par2)
cent <- NULL
for(k in 1:par2){
cent <- rbind(cent, colMeans(x[memb == k, , drop = FALSE]))
}
hc1 <- hclust(dist(cent),method=par1, members = table(memb))
de <- as.dendrogram(hc1)
bitmap(file='test2.png')
if (par4 == 'TRUE'){
plot(de,main=main,ylab=ylab,xlab=xlab,horiz=par3, nodePar=list(pch = c(1,NA), cex=0.8, lab.cex = 0.8),type='t',center=T, sub=mysub)
} else {
plot(de,main=main,ylab=ylab,xlab=xlab,horiz=par3, nodePar=list(pch = c(1,NA), cex=0.8, lab.cex = 0.8), sub=mysub)
}
dev.off()
str(de)
}
load(file='createtable')
a<-table.start()
a<-table.row.start(a)
a<-table.element(a,'Summary of Dendrogram',2,TRUE)
a<-table.row.end(a)
a<-table.row.start(a)
a<-table.element(a,'Label',header=TRUE)
a<-table.element(a,'Height',header=TRUE)
a<-table.row.end(a)
num <- length(x[,1])-1
for (i in 1:num)
{
a<-table.row.start(a)
a<-table.element(a,hc$labels[i])
a<-table.element(a,hc$height[i])
a<-table.row.end(a)
}
a<-table.end(a)
table.save(a,file='mytable1.tab')
if (par2 != 'ALL'){
a<-table.start()
a<-table.row.start(a)
a<-table.element(a,'Summary of Cut Dendrogram',2,TRUE)
a<-table.row.end(a)
a<-table.row.start(a)
a<-table.element(a,'Label',header=TRUE)
a<-table.element(a,'Height',header=TRUE)
a<-table.row.end(a)
num <- par2-1
for (i in 1:num)
{
a<-table.row.start(a)
a<-table.element(a,i)
a<-table.element(a,hc1$height[i])
a<-table.row.end(a)
}
a<-table.end(a)
table.save(a,file='mytable2.tab')
}