Free Statistics

of Irreproducible Research!

Author's title

Author*The author of this computation has been verified*
R Software Modulerwasp_hierarchicalclustering.wasp
Title produced by softwareHierarchical Clustering
Date of computationMon, 10 Nov 2008 15:03:01 -0700
Cite this page as followsStatistical Computations at FreeStatistics.org, Office for Research Development and Education, URL https://freestatistics.org/blog/index.php?v=date/2008/Nov/10/t122635463483208sys08w9gvo.htm/, Retrieved Sun, 19 May 2024 10:10:27 +0000
Statistical Computations at FreeStatistics.org, Office for Research Development and Education, URL https://freestatistics.org/blog/index.php?pk=23213, Retrieved Sun, 19 May 2024 10:10:27 +0000
QR Codes:

Original text written by user:
IsPrivate?No (this computation is public)
User-defined keywords
Estimated Impact143
Family? (F = Feedback message, R = changed R code, M = changed R Module, P = changed Parameters, D = changed Data)
F       [Hierarchical Clustering] [Hierarchical Clus...] [2008-11-10 22:03:01] [63db34dadd44fb018112addcdefe949f] [Current]
Feedback Forum
2008-11-20 23:01:48 [Olivier Uyttendaele] [reply
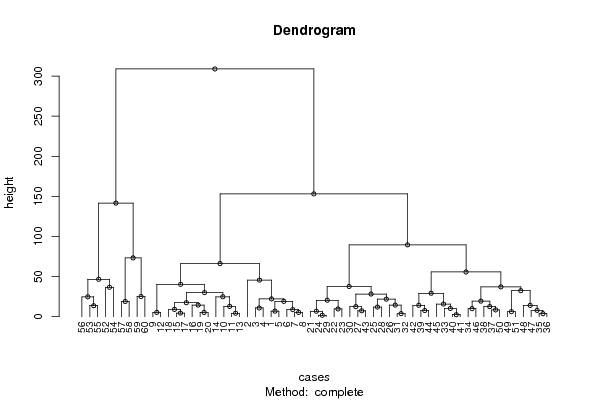
Je gaat de waarden die je hebt in clusters verdelen. Dendogram = Boomstructuur. Deze wordt gebruikt om weer te geven hoe en waar de clusters (of subsets) zich bevinden ofwel zijn geplaatst. Dit is naar verluidt de meest traditionele manier om aan hierarchical Clustering te doen. De waarden die gelijkaardig zijn, worden samengebracht. Uiteindelijk kan je blijven splitsen tot je uiteindelijk tot 1observatie komt.
Clusteren kan algemeen omschreven worden als het classificeren/delen van een dataset in clusters, zodat de data en eenzelfde cluster een gelijkaardigheid vertoont.

Hierdoor ontstaan subsets welke elk hun eigen gedeelde kenmerken bevatten

Post a new message
Dataseries X:
101	95	106	101
104	96	82	88
99	97	114	108
105	96	118	116
107	96	105	104
111	96	105	110
117	95	103	105
119	97	107	107
127	97	123	124
128	97	112	109
135	98	104	102
132	98	122	125
136	97	108	102
143	98	94	101
142	98	120	116
153	99	118	114
145	99	117	115
138	98	113	119
148	97	106	108
152	99	108	110
169	100	122	120
169	100	115	113
161	100	110	111
174	100	120	121
179	99	104	99
191	101	96	104
190	101	121	117
182	101	111	108
175	101	120	122
181	101	114	122
197	100	107	111
194	102	108	111
197	102	127	131
216	102	105	108
221	103	119	118
218	103	121	119
230	102	106	104
227	103	97	105
204	103	119	118
197	103	122	124
199	103	121	123
208	103	106	114
191	101	114	119
202	104	112	116
211	104	127	129
224	104	109	112
224	104	118	123
231	104	123	124
244	103	115	117
235	105	105	110
250	104	116	118
266	105	131	135
288	106	121	127
283	106	104	117
295	105	127	137
312	107	126	130
334	108	124	132
348	108	132	142
383	109	117	122
407	110	123	126


Summary of computational transaction
Raw Inputview raw input (R code)
Raw Outputview raw output of R engine
Computing time2 seconds
R Server'Sir Ronald Aylmer Fisher' @ 193.190.124.24

\begin{tabular}{lllllllll}
\hline
Summary of computational transaction \tabularnewline
Raw Input & view raw input (R code)  \tabularnewline
Raw Output & view raw output of R engine  \tabularnewline
Computing time & 2 seconds \tabularnewline
R Server & 'Sir Ronald Aylmer Fisher' @ 193.190.124.24 \tabularnewline
\hline
\end{tabular}
%Source: https://freestatistics.org/blog/index.php?pk=23213&T=0

[TABLE]
[ROW][C]Summary of computational transaction[/C][/ROW]
[ROW][C]Raw Input[/C][C]view raw input (R code) [/C][/ROW]
[ROW][C]Raw Output[/C][C]view raw output of R engine [/C][/ROW]
[ROW][C]Computing time[/C][C]2 seconds[/C][/ROW]
[ROW][C]R Server[/C][C]'Sir Ronald Aylmer Fisher' @ 193.190.124.24[/C][/ROW]
[/TABLE]
Source: https://freestatistics.org/blog/index.php?pk=23213&T=0

Globally Unique Identifier (entire table): ba.freestatistics.org/blog/index.php?pk=23213&T=0

As an alternative you can also use a QR Code:  

The GUIDs for individual cells are displayed in the table below:

Summary of computational transaction
Raw Inputview raw input (R code)
Raw Outputview raw output of R engine
Computing time2 seconds
R Server'Sir Ronald Aylmer Fisher' @ 193.190.124.24


Summary of Dendrogram
LabelHeight
11.73205080756888
22.44948974278318
33.74165738677394
43.74165738677394
54.24264068711928
64.47213595499958
75.29150262212918
85.29150262212918
95.29150262212918
106.2449979983984
116.70820393249937
126.85565460040104
137.34846922834953
147.61577310586391
157.87400787401181
168.42614977317636
178.83176086632785
189.05538513813742
199.64365076099295
2010
2110.2469507659596
2210.8166538263920
2311.9582607431014
2412.4498995979887
2512.5299640861417
2612.7671453348037
2713.6381816969859
2814.1067359796659
2914.1774468787578
3014.3874945699382
3114.4568322948010
3215.7162336455017
3317.4068951855292
3418.9736659610103
3519.1049731745428
3619.3390796058137
3720.4450483002609
3821.8632111090754
3922.1585198061603
4024.7184141886165
4124.7790233867277
4225.0798724079689
4328.1957443597434
4429.1890390386528
4530.0333148353624
4632.4191301548947
4736.6469644036174
4837.1618083521241
4937.6430604494374
5040.3360880601974
5145.6179789118282
5246.5832587954085
5355.7045779088218
5466.1966766537415
5573.280283842245
5689.5656184034923
57141.601553663793
58153.088209866077
59308.930412876428

\begin{tabular}{lllllllll}
\hline
Summary of Dendrogram \tabularnewline
Label & Height \tabularnewline
1 & 1.73205080756888 \tabularnewline
2 & 2.44948974278318 \tabularnewline
3 & 3.74165738677394 \tabularnewline
4 & 3.74165738677394 \tabularnewline
5 & 4.24264068711928 \tabularnewline
6 & 4.47213595499958 \tabularnewline
7 & 5.29150262212918 \tabularnewline
8 & 5.29150262212918 \tabularnewline
9 & 5.29150262212918 \tabularnewline
10 & 6.2449979983984 \tabularnewline
11 & 6.70820393249937 \tabularnewline
12 & 6.85565460040104 \tabularnewline
13 & 7.34846922834953 \tabularnewline
14 & 7.61577310586391 \tabularnewline
15 & 7.87400787401181 \tabularnewline
16 & 8.42614977317636 \tabularnewline
17 & 8.83176086632785 \tabularnewline
18 & 9.05538513813742 \tabularnewline
19 & 9.64365076099295 \tabularnewline
20 & 10 \tabularnewline
21 & 10.2469507659596 \tabularnewline
22 & 10.8166538263920 \tabularnewline
23 & 11.9582607431014 \tabularnewline
24 & 12.4498995979887 \tabularnewline
25 & 12.5299640861417 \tabularnewline
26 & 12.7671453348037 \tabularnewline
27 & 13.6381816969859 \tabularnewline
28 & 14.1067359796659 \tabularnewline
29 & 14.1774468787578 \tabularnewline
30 & 14.3874945699382 \tabularnewline
31 & 14.4568322948010 \tabularnewline
32 & 15.7162336455017 \tabularnewline
33 & 17.4068951855292 \tabularnewline
34 & 18.9736659610103 \tabularnewline
35 & 19.1049731745428 \tabularnewline
36 & 19.3390796058137 \tabularnewline
37 & 20.4450483002609 \tabularnewline
38 & 21.8632111090754 \tabularnewline
39 & 22.1585198061603 \tabularnewline
40 & 24.7184141886165 \tabularnewline
41 & 24.7790233867277 \tabularnewline
42 & 25.0798724079689 \tabularnewline
43 & 28.1957443597434 \tabularnewline
44 & 29.1890390386528 \tabularnewline
45 & 30.0333148353624 \tabularnewline
46 & 32.4191301548947 \tabularnewline
47 & 36.6469644036174 \tabularnewline
48 & 37.1618083521241 \tabularnewline
49 & 37.6430604494374 \tabularnewline
50 & 40.3360880601974 \tabularnewline
51 & 45.6179789118282 \tabularnewline
52 & 46.5832587954085 \tabularnewline
53 & 55.7045779088218 \tabularnewline
54 & 66.1966766537415 \tabularnewline
55 & 73.280283842245 \tabularnewline
56 & 89.5656184034923 \tabularnewline
57 & 141.601553663793 \tabularnewline
58 & 153.088209866077 \tabularnewline
59 & 308.930412876428 \tabularnewline
\hline
\end{tabular}
%Source: https://freestatistics.org/blog/index.php?pk=23213&T=1

[TABLE]
[ROW][C]Summary of Dendrogram[/C][/ROW]
[ROW][C]Label[/C][C]Height[/C][/ROW]
[ROW][C]1[/C][C]1.73205080756888[/C][/ROW]
[ROW][C]2[/C][C]2.44948974278318[/C][/ROW]
[ROW][C]3[/C][C]3.74165738677394[/C][/ROW]
[ROW][C]4[/C][C]3.74165738677394[/C][/ROW]
[ROW][C]5[/C][C]4.24264068711928[/C][/ROW]
[ROW][C]6[/C][C]4.47213595499958[/C][/ROW]
[ROW][C]7[/C][C]5.29150262212918[/C][/ROW]
[ROW][C]8[/C][C]5.29150262212918[/C][/ROW]
[ROW][C]9[/C][C]5.29150262212918[/C][/ROW]
[ROW][C]10[/C][C]6.2449979983984[/C][/ROW]
[ROW][C]11[/C][C]6.70820393249937[/C][/ROW]
[ROW][C]12[/C][C]6.85565460040104[/C][/ROW]
[ROW][C]13[/C][C]7.34846922834953[/C][/ROW]
[ROW][C]14[/C][C]7.61577310586391[/C][/ROW]
[ROW][C]15[/C][C]7.87400787401181[/C][/ROW]
[ROW][C]16[/C][C]8.42614977317636[/C][/ROW]
[ROW][C]17[/C][C]8.83176086632785[/C][/ROW]
[ROW][C]18[/C][C]9.05538513813742[/C][/ROW]
[ROW][C]19[/C][C]9.64365076099295[/C][/ROW]
[ROW][C]20[/C][C]10[/C][/ROW]
[ROW][C]21[/C][C]10.2469507659596[/C][/ROW]
[ROW][C]22[/C][C]10.8166538263920[/C][/ROW]
[ROW][C]23[/C][C]11.9582607431014[/C][/ROW]
[ROW][C]24[/C][C]12.4498995979887[/C][/ROW]
[ROW][C]25[/C][C]12.5299640861417[/C][/ROW]
[ROW][C]26[/C][C]12.7671453348037[/C][/ROW]
[ROW][C]27[/C][C]13.6381816969859[/C][/ROW]
[ROW][C]28[/C][C]14.1067359796659[/C][/ROW]
[ROW][C]29[/C][C]14.1774468787578[/C][/ROW]
[ROW][C]30[/C][C]14.3874945699382[/C][/ROW]
[ROW][C]31[/C][C]14.4568322948010[/C][/ROW]
[ROW][C]32[/C][C]15.7162336455017[/C][/ROW]
[ROW][C]33[/C][C]17.4068951855292[/C][/ROW]
[ROW][C]34[/C][C]18.9736659610103[/C][/ROW]
[ROW][C]35[/C][C]19.1049731745428[/C][/ROW]
[ROW][C]36[/C][C]19.3390796058137[/C][/ROW]
[ROW][C]37[/C][C]20.4450483002609[/C][/ROW]
[ROW][C]38[/C][C]21.8632111090754[/C][/ROW]
[ROW][C]39[/C][C]22.1585198061603[/C][/ROW]
[ROW][C]40[/C][C]24.7184141886165[/C][/ROW]
[ROW][C]41[/C][C]24.7790233867277[/C][/ROW]
[ROW][C]42[/C][C]25.0798724079689[/C][/ROW]
[ROW][C]43[/C][C]28.1957443597434[/C][/ROW]
[ROW][C]44[/C][C]29.1890390386528[/C][/ROW]
[ROW][C]45[/C][C]30.0333148353624[/C][/ROW]
[ROW][C]46[/C][C]32.4191301548947[/C][/ROW]
[ROW][C]47[/C][C]36.6469644036174[/C][/ROW]
[ROW][C]48[/C][C]37.1618083521241[/C][/ROW]
[ROW][C]49[/C][C]37.6430604494374[/C][/ROW]
[ROW][C]50[/C][C]40.3360880601974[/C][/ROW]
[ROW][C]51[/C][C]45.6179789118282[/C][/ROW]
[ROW][C]52[/C][C]46.5832587954085[/C][/ROW]
[ROW][C]53[/C][C]55.7045779088218[/C][/ROW]
[ROW][C]54[/C][C]66.1966766537415[/C][/ROW]
[ROW][C]55[/C][C]73.280283842245[/C][/ROW]
[ROW][C]56[/C][C]89.5656184034923[/C][/ROW]
[ROW][C]57[/C][C]141.601553663793[/C][/ROW]
[ROW][C]58[/C][C]153.088209866077[/C][/ROW]
[ROW][C]59[/C][C]308.930412876428[/C][/ROW]
[/TABLE]
Source: https://freestatistics.org/blog/index.php?pk=23213&T=1

Globally Unique Identifier (entire table): ba.freestatistics.org/blog/index.php?pk=23213&T=1

As an alternative you can also use a QR Code:  

The GUIDs for individual cells are displayed in the table below:

Summary of Dendrogram
LabelHeight
11.73205080756888
22.44948974278318
33.74165738677394
43.74165738677394
54.24264068711928
64.47213595499958
75.29150262212918
85.29150262212918
95.29150262212918
106.2449979983984
116.70820393249937
126.85565460040104
137.34846922834953
147.61577310586391
157.87400787401181
168.42614977317636
178.83176086632785
189.05538513813742
199.64365076099295
2010
2110.2469507659596
2210.8166538263920
2311.9582607431014
2412.4498995979887
2512.5299640861417
2612.7671453348037
2713.6381816969859
2814.1067359796659
2914.1774468787578
3014.3874945699382
3114.4568322948010
3215.7162336455017
3317.4068951855292
3418.9736659610103
3519.1049731745428
3619.3390796058137
3720.4450483002609
3821.8632111090754
3922.1585198061603
4024.7184141886165
4124.7790233867277
4225.0798724079689
4328.1957443597434
4429.1890390386528
4530.0333148353624
4632.4191301548947
4736.6469644036174
4837.1618083521241
4937.6430604494374
5040.3360880601974
5145.6179789118282
5246.5832587954085
5355.7045779088218
5466.1966766537415
5573.280283842245
5689.5656184034923
57141.601553663793
58153.088209866077
59308.930412876428


Parameters (Session):
par1 = complete ; par2 = ALL ; par3 = FALSE ; par4 = FALSE ;
Parameters (R input):
par1 = complete ; par2 = ALL ; par3 = FALSE ; par4 = FALSE ;
R code (references can be found in the software module):
par3 <- as.logical(par3)
par4 <- as.logical(par4)
if (par3 == 'TRUE'){
dum = xlab
xlab = ylab
ylab = dum
}
x <- t(y)
hc <- hclust(dist(x),method=par1)
d <- as.dendrogram(hc)
str(d)
mysub <- paste('Method: ',par1)
bitmap(file='test1.png')
if (par4 == 'TRUE'){
plot(d,main=main,ylab=ylab,xlab=xlab,horiz=par3, nodePar=list(pch = c(1,NA), cex=0.8, lab.cex = 0.8),type='t',center=T, sub=mysub)
} else {
plot(d,main=main,ylab=ylab,xlab=xlab,horiz=par3, nodePar=list(pch = c(1,NA), cex=0.8, lab.cex = 0.8), sub=mysub)
}
dev.off()
if (par2 != 'ALL'){
if (par3 == 'TRUE'){
ylab = 'cluster'
} else {
xlab = 'cluster'
}
par2 <- as.numeric(par2)
memb <- cutree(hc, k = par2)
cent <- NULL
for(k in 1:par2){
cent <- rbind(cent, colMeans(x[memb == k, , drop = FALSE]))
}
hc1 <- hclust(dist(cent),method=par1, members = table(memb))
de <- as.dendrogram(hc1)
bitmap(file='test2.png')
if (par4 == 'TRUE'){
plot(de,main=main,ylab=ylab,xlab=xlab,horiz=par3, nodePar=list(pch = c(1,NA), cex=0.8, lab.cex = 0.8),type='t',center=T, sub=mysub)
} else {
plot(de,main=main,ylab=ylab,xlab=xlab,horiz=par3, nodePar=list(pch = c(1,NA), cex=0.8, lab.cex = 0.8), sub=mysub)
}
dev.off()
str(de)
}
load(file='createtable')
a<-table.start()
a<-table.row.start(a)
a<-table.element(a,'Summary of Dendrogram',2,TRUE)
a<-table.row.end(a)
a<-table.row.start(a)
a<-table.element(a,'Label',header=TRUE)
a<-table.element(a,'Height',header=TRUE)
a<-table.row.end(a)
num <- length(x[,1])-1
for (i in 1:num)
{
a<-table.row.start(a)
a<-table.element(a,hc$labels[i])
a<-table.element(a,hc$height[i])
a<-table.row.end(a)
}
a<-table.end(a)
table.save(a,file='mytable1.tab')
if (par2 != 'ALL'){
a<-table.start()
a<-table.row.start(a)
a<-table.element(a,'Summary of Cut Dendrogram',2,TRUE)
a<-table.row.end(a)
a<-table.row.start(a)
a<-table.element(a,'Label',header=TRUE)
a<-table.element(a,'Height',header=TRUE)
a<-table.row.end(a)
num <- par2-1
for (i in 1:num)
{
a<-table.row.start(a)
a<-table.element(a,i)
a<-table.element(a,hc1$height[i])
a<-table.row.end(a)
}
a<-table.end(a)
table.save(a,file='mytable2.tab')
}