Free Statistics

of Irreproducible Research!

Author's title

Author*The author of this computation has been verified*
R Software Modulerwasp_bidensity.wasp
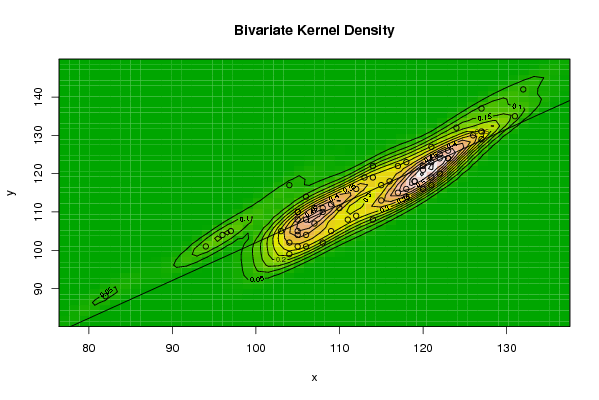
Title produced by softwareBivariate Kernel Density Estimation
Date of computationMon, 10 Nov 2008 14:30:26 -0700
Cite this page as followsStatistical Computations at FreeStatistics.org, Office for Research Development and Education, URL https://freestatistics.org/blog/index.php?v=date/2008/Nov/10/t1226352696ivu671au1thggij.htm/, Retrieved Sun, 19 May 2024 08:50:49 +0000
Statistical Computations at FreeStatistics.org, Office for Research Development and Education, URL https://freestatistics.org/blog/index.php?pk=23208, Retrieved Sun, 19 May 2024 08:50:49 +0000
QR Codes:

Original text written by user:
IsPrivate?No (this computation is public)
User-defined keywords
Estimated Impact128
Family? (F = Feedback message, R = changed R code, M = changed R Module, P = changed Parameters, D = changed Data)
F       [Bivariate Kernel Density Estimation] [Bivariate Kernel ...] [2008-11-10 21:30:26] [63db34dadd44fb018112addcdefe949f] [Current]
Feedback Forum
2008-11-20 22:55:02 [Olivier Uyttendaele] [reply
Je hebt het model correct opgemaakt. Het BKD Plot geeft zoals een scatterplot een correlatie weer tussen 2 variabelen.

Het verschil tussen een scatterplot en deze techniek zit hem in de grafische voorstelling. Bij deze techniek wordt gebruik gemaakt van hoogtelijnen. Het model vergelijkt punten met elkaar die een zelfde dichtheid vertonen. Punten uit een rode zone wijst op een hoge correlatie, punten in een groene of gele zone wijzen op een zwakke correlatie. Dit heb je volgens mij correct geformuleerd.

Post a new message
Dataseries X:
105
105
109
106
82
114
118
105
105
103
107
123
112
104
122
108
94
120
118
117
113
106
108
122
115
110
120
104
96
121
111
120
114
107
108
127
105
119
121
106
97
119
122
121
106
114
112
127
109
118
123
115
105
116
131
121
104
127
126
124
132
117
123
Dataseries Y:
105
101
105
101
88
108
116
104
110
105
107
124
109
102
125
102
101
116
114
115
119
108
110
120
113
111
121
99
104
117
108
122
122
111
111
131
108
118
119
104
105
118
124
123
114
119
116
129
112
123
124
117
110
118
135
127
117
137
130
132
142
122
126


Summary of computational transaction
Raw Inputview raw input (R code)
Raw Outputview raw output of R engine
Computing time1 seconds
R Server'Gwilym Jenkins' @ 72.249.127.135

\begin{tabular}{lllllllll}
\hline
Summary of computational transaction \tabularnewline
Raw Input & view raw input (R code)  \tabularnewline
Raw Output & view raw output of R engine  \tabularnewline
Computing time & 1 seconds \tabularnewline
R Server & 'Gwilym Jenkins' @ 72.249.127.135 \tabularnewline
\hline
\end{tabular}
%Source: https://freestatistics.org/blog/index.php?pk=23208&T=0

[TABLE]
[ROW][C]Summary of computational transaction[/C][/ROW]
[ROW][C]Raw Input[/C][C]view raw input (R code) [/C][/ROW]
[ROW][C]Raw Output[/C][C]view raw output of R engine [/C][/ROW]
[ROW][C]Computing time[/C][C]1 seconds[/C][/ROW]
[ROW][C]R Server[/C][C]'Gwilym Jenkins' @ 72.249.127.135[/C][/ROW]
[/TABLE]
Source: https://freestatistics.org/blog/index.php?pk=23208&T=0

Globally Unique Identifier (entire table): ba.freestatistics.org/blog/index.php?pk=23208&T=0

As an alternative you can also use a QR Code:  

The GUIDs for individual cells are displayed in the table below:

Summary of computational transaction
Raw Inputview raw input (R code)
Raw Outputview raw output of R engine
Computing time1 seconds
R Server'Gwilym Jenkins' @ 72.249.127.135


Bandwidth
x axis3.30381650413094
y axis4.81346475962479
Correlation
correlation used in KDE0.90827626302675
correlation(x,y)0.90827626302675

\begin{tabular}{lllllllll}
\hline
Bandwidth \tabularnewline
x axis & 3.30381650413094 \tabularnewline
y axis & 4.81346475962479 \tabularnewline
Correlation \tabularnewline
correlation used in KDE & 0.90827626302675 \tabularnewline
correlation(x,y) & 0.90827626302675 \tabularnewline
\hline
\end{tabular}
%Source: https://freestatistics.org/blog/index.php?pk=23208&T=1

[TABLE]
[ROW][C]Bandwidth[/C][/ROW]
[ROW][C]x axis[/C][C]3.30381650413094[/C][/ROW]
[ROW][C]y axis[/C][C]4.81346475962479[/C][/ROW]
[ROW][C]Correlation[/C][/ROW]
[ROW][C]correlation used in KDE[/C][C]0.90827626302675[/C][/ROW]
[ROW][C]correlation(x,y)[/C][C]0.90827626302675[/C][/ROW]
[/TABLE]
Source: https://freestatistics.org/blog/index.php?pk=23208&T=1

Globally Unique Identifier (entire table): ba.freestatistics.org/blog/index.php?pk=23208&T=1

As an alternative you can also use a QR Code:  

The GUIDs for individual cells are displayed in the table below:

Bandwidth
x axis3.30381650413094
y axis4.81346475962479
Correlation
correlation used in KDE0.90827626302675
correlation(x,y)0.90827626302675


Parameters (Session):
par1 = 50 ; par2 = 50 ; par3 = 0 ; par4 = 0 ; par5 = 0 ; par6 = Y ; par7 = Y ;
Parameters (R input):
par1 = 50 ; par2 = 50 ; par3 = 0 ; par4 = 0 ; par5 = 0 ; par6 = Y ; par7 = Y ;
R code (references can be found in the software module):
par1 <- as(par1,'numeric')
par2 <- as(par2,'numeric')
par3 <- as(par3,'numeric')
par4 <- as(par4,'numeric')
par5 <- as(par5,'numeric')
library('GenKern')
if (par3==0) par3 <- dpik(x)
if (par4==0) par4 <- dpik(y)
if (par5==0) par5 <- cor(x,y)
if (par1 > 500) par1 <- 500
if (par2 > 500) par2 <- 500
bitmap(file='bidensity.png')
op <- KernSur(x,y, xgridsize=par1, ygridsize=par2, correlation=par5, xbandwidth=par3, ybandwidth=par4)
image(op$xords, op$yords, op$zden, col=terrain.colors(100), axes=TRUE,main=main,xlab=xlab,ylab=ylab)
if (par6=='Y') contour(op$xords, op$yords, op$zden, add=TRUE)
if (par7=='Y') points(x,y)
(r<-lm(y ~ x))
abline(r)
box()
dev.off()
load(file='createtable')
a<-table.start()
a<-table.row.start(a)
a<-table.element(a,'Bandwidth',2,TRUE)
a<-table.row.end(a)
a<-table.row.start(a)
a<-table.element(a,'x axis',header=TRUE)
a<-table.element(a,par3)
a<-table.row.end(a)
a<-table.row.start(a)
a<-table.element(a,'y axis',header=TRUE)
a<-table.element(a,par4)
a<-table.row.end(a)
a<-table.row.start(a)
a<-table.element(a,'Correlation',2,TRUE)
a<-table.row.end(a)
a<-table.row.start(a)
a<-table.element(a,'correlation used in KDE',header=TRUE)
a<-table.element(a,par5)
a<-table.row.end(a)
a<-table.row.start(a)
a<-table.element(a,'correlation(x,y)',header=TRUE)
a<-table.element(a,cor(x,y))
a<-table.row.end(a)
a<-table.end(a)
table.save(a,file='mytable.tab')