Free Statistics

of Irreproducible Research!

Author's title

Author*The author of this computation has been verified*
R Software Modulerwasp_sample.wasp
Title produced by softwareMinimum Sample Size - Testing Proportions
Date of computationMon, 10 Nov 2008 10:50:36 -0700
Cite this page as followsStatistical Computations at FreeStatistics.org, Office for Research Development and Education, URL https://freestatistics.org/blog/index.php?v=date/2008/Nov/10/t1226339464cunfowyktss4kcy.htm/, Retrieved Sun, 19 May 2024 10:05:20 +0000
Statistical Computations at FreeStatistics.org, Office for Research Development and Education, URL https://freestatistics.org/blog/index.php?pk=23158, Retrieved Sun, 19 May 2024 10:05:20 +0000
QR Codes:

Original text written by user:
IsPrivate?No (this computation is public)
User-defined keywords
Estimated Impact178
Family? (F = Feedback message, R = changed R code, M = changed R Module, P = changed Parameters, D = changed Data)
F     [Testing Mean with known Variance - Critical Value] [Opdracht 4.2 1] [2008-11-10 15:34:14] [2bd2ad6af3eef3a703e9ec23e39bd695]
- RMP   [Testing Variance - p-value (probability)] [Opdracht 4.3 1.2] [2008-11-10 16:55:29] [2bd2ad6af3eef3a703e9ec23e39bd695]
- RMP     [Testing Variance - Critical Value (Region)] [Opdracht 4.3 3.1] [2008-11-10 17:34:29] [2bd2ad6af3eef3a703e9ec23e39bd695]
-           [Testing Variance - Critical Value (Region)] [Opdracht 4.3 1.23] [2008-11-10 17:42:55] [2bd2ad6af3eef3a703e9ec23e39bd695]
F RM            [Minimum Sample Size - Testing Proportions] [Opdracht 4.3 3.5] [2008-11-10 17:50:36] [2ae704d6b0222e84f58032588d68322b] [Current]
Feedback Forum
2008-11-14 11:30:33 [Ken Van den Heuvel] [reply
Je geeft geen antwoord op de vraag. Uit deze berekeningen kan je concluderen dat we de studie met de vooropgestelde gegevens niet konden uitvoeren met een kleinere testgroep, we hebben immers minimum 552 als minimum sample size nodig.

Post a new message


Summary of computational transaction
Raw Inputview raw input (R code)
Raw Outputview raw output of R engine
Computing time2 seconds
R Server'Sir Ronald Aylmer Fisher' @ 193.190.124.24

\begin{tabular}{lllllllll}
\hline
Summary of computational transaction \tabularnewline
Raw Input & view raw input (R code)  \tabularnewline
Raw Output & view raw output of R engine  \tabularnewline
Computing time & 2 seconds \tabularnewline
R Server & 'Sir Ronald Aylmer Fisher' @ 193.190.124.24 \tabularnewline
\hline
\end{tabular}
%Source: https://freestatistics.org/blog/index.php?pk=23158&T=0

[TABLE]
[ROW][C]Summary of computational transaction[/C][/ROW]
[ROW][C]Raw Input[/C][C]view raw input (R code) [/C][/ROW]
[ROW][C]Raw Output[/C][C]view raw output of R engine [/C][/ROW]
[ROW][C]Computing time[/C][C]2 seconds[/C][/ROW]
[ROW][C]R Server[/C][C]'Sir Ronald Aylmer Fisher' @ 193.190.124.24[/C][/ROW]
[/TABLE]
Source: https://freestatistics.org/blog/index.php?pk=23158&T=0

Globally Unique Identifier (entire table): ba.freestatistics.org/blog/index.php?pk=23158&T=0

As an alternative you can also use a QR Code:  

The GUIDs for individual cells are displayed in the table below:

Summary of computational transaction
Raw Inputview raw input (R code)
Raw Outputview raw output of R engine
Computing time2 seconds
R Server'Sir Ronald Aylmer Fisher' @ 193.190.124.24


Minimum Sample Size
Population Size20000
Margin of Error0.07
Confidence0.95
Power0.95
Response Distribution (Proportion)0.5
z(alpha/2) + z(beta)3.60481761149153
z(alpha) + z(beta)3.28970725390294
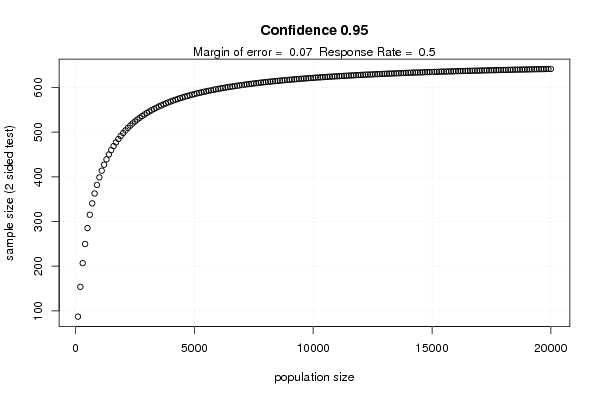
Minimum Sample Size (2 sided test)641.75351476443
Minimum Sample Size (1 sided test)537.343826472914

\begin{tabular}{lllllllll}
\hline
Minimum Sample Size \tabularnewline
Population Size & 20000 \tabularnewline
Margin of Error & 0.07 \tabularnewline
Confidence & 0.95 \tabularnewline
Power & 0.95 \tabularnewline
Response Distribution (Proportion) & 0.5 \tabularnewline
z(alpha/2) + z(beta) & 3.60481761149153 \tabularnewline
z(alpha) + z(beta) & 3.28970725390294 \tabularnewline
Minimum Sample Size (2 sided test) & 641.75351476443 \tabularnewline
Minimum Sample Size (1 sided test) & 537.343826472914 \tabularnewline
\hline
\end{tabular}
%Source: https://freestatistics.org/blog/index.php?pk=23158&T=1

[TABLE]
[ROW][C]Minimum Sample Size[/C][/ROW]
[ROW][C]Population Size[/C][C]20000[/C][/ROW]
[ROW][C]Margin of Error[/C][C]0.07[/C][/ROW]
[ROW][C]Confidence[/C][C]0.95[/C][/ROW]
[ROW][C]Power[/C][C]0.95[/C][/ROW]
[ROW][C]Response Distribution (Proportion)[/C][C]0.5[/C][/ROW]
[ROW][C]z(alpha/2) + z(beta)[/C][C]3.60481761149153[/C][/ROW]
[ROW][C]z(alpha) + z(beta)[/C][C]3.28970725390294[/C][/ROW]
[ROW][C]Minimum Sample Size (2 sided test)[/C][C]641.75351476443[/C][/ROW]
[ROW][C]Minimum Sample Size (1 sided test)[/C][C]537.343826472914[/C][/ROW]
[/TABLE]
Source: https://freestatistics.org/blog/index.php?pk=23158&T=1

Globally Unique Identifier (entire table): ba.freestatistics.org/blog/index.php?pk=23158&T=1

As an alternative you can also use a QR Code:  

The GUIDs for individual cells are displayed in the table below:

Minimum Sample Size
Population Size20000
Margin of Error0.07
Confidence0.95
Power0.95
Response Distribution (Proportion)0.5
z(alpha/2) + z(beta)3.60481761149153
z(alpha) + z(beta)3.28970725390294
Minimum Sample Size (2 sided test)641.75351476443
Minimum Sample Size (1 sided test)537.343826472914


Minimum Sample Size (infinite population)
Population Sizeinfinite
Margin of Error0.07
Confidence0.95
Power0.95
Response Distribution (Proportion)0.5
z(alpha/2) + z(beta)3.60481761149153
z(alpha) + z(beta)3.28970725390294
Minimum Sample Size (2 sided test)662.995408781605
Minimum Sample Size (1 sided test)552.151725325594

\begin{tabular}{lllllllll}
\hline
Minimum Sample Size (infinite population) \tabularnewline
Population Size & infinite \tabularnewline
Margin of Error & 0.07 \tabularnewline
Confidence & 0.95 \tabularnewline
Power & 0.95 \tabularnewline
Response Distribution (Proportion) & 0.5 \tabularnewline
z(alpha/2) + z(beta) & 3.60481761149153 \tabularnewline
z(alpha) + z(beta) & 3.28970725390294 \tabularnewline
Minimum Sample Size (2 sided test) & 662.995408781605 \tabularnewline
Minimum Sample Size (1 sided test) & 552.151725325594 \tabularnewline
\hline
\end{tabular}
%Source: https://freestatistics.org/blog/index.php?pk=23158&T=2

[TABLE]
[ROW][C]Minimum Sample Size (infinite population)[/C][/ROW]
[ROW][C]Population Size[/C][C]infinite[/C][/ROW]
[ROW][C]Margin of Error[/C][C]0.07[/C][/ROW]
[ROW][C]Confidence[/C][C]0.95[/C][/ROW]
[ROW][C]Power[/C][C]0.95[/C][/ROW]
[ROW][C]Response Distribution (Proportion)[/C][C]0.5[/C][/ROW]
[ROW][C]z(alpha/2) + z(beta)[/C][C]3.60481761149153[/C][/ROW]
[ROW][C]z(alpha) + z(beta)[/C][C]3.28970725390294[/C][/ROW]
[ROW][C]Minimum Sample Size (2 sided test)[/C][C]662.995408781605[/C][/ROW]
[ROW][C]Minimum Sample Size (1 sided test)[/C][C]552.151725325594[/C][/ROW]
[/TABLE]
Source: https://freestatistics.org/blog/index.php?pk=23158&T=2

Globally Unique Identifier (entire table): ba.freestatistics.org/blog/index.php?pk=23158&T=2

As an alternative you can also use a QR Code:  

The GUIDs for individual cells are displayed in the table below:

Minimum Sample Size (infinite population)
Population Sizeinfinite
Margin of Error0.07
Confidence0.95
Power0.95
Response Distribution (Proportion)0.5
z(alpha/2) + z(beta)3.60481761149153
z(alpha) + z(beta)3.28970725390294
Minimum Sample Size (2 sided test)662.995408781605
Minimum Sample Size (1 sided test)552.151725325594


Parameters (Session):
par1 = 320 ; par2 = 4.2 ; par3 = 4.8 ; par4 = 0.05 ;
Parameters (R input):
par1 = 20000 ; par2 = 0.07 ; par3 = 0.95 ; par4 = 0.5 ; par5 = 0.95 ;
R code (references can be found in the software module):
par1 <- as.numeric(par1)
par2 <- as.numeric(par2)
par3 <- as.numeric(par3)
par4 <- as.numeric(par4)
par5 <- as.numeric(par5)
(z <- abs(qnorm((1-par3)/2)) + abs(qnorm(1-par5)))
(z1 <- abs(qnorm(1-par3)) + abs(qnorm(1-par5)))
dum <- z*z * par4*(1-par4)
dum1 <- z1*z1 * par4*(1-par4)
par22 <- par2*par2
npop <- array(NA, 200)
ppop <- array(NA, 200)
for (i in 1:200)
{
ppop[i] <- i * 100
npop[i] <- ppop[i] * dum / (dum + (ppop[i]-1)*par22)
}
bitmap(file='pic1.png')
plot(ppop,npop, xlab='population size', ylab='sample size (2 sided test)', main = paste('Confidence',par3))
dumtext <- paste('Margin of error = ',par2)
dumtext <- paste(dumtext,' Response Rate = ')
dumtext <- paste(dumtext, par4)
mtext(dumtext)
grid()
dev.off()
(n <- par1 * dum / (dum + (par1-1)*par22))
(n1 <- par1 * dum1 / (dum1 + (par1-1)*par22))
load(file='createtable')
a<-table.start()
a<-table.row.start(a)
a<-table.element(a,'Minimum Sample Size',2,TRUE)
a<-table.row.end(a)
a<-table.row.start(a)
a<-table.element(a,'Population Size',header=TRUE)
a<-table.element(a,par1)
a<-table.row.end(a)
a<-table.row.start(a)
a<-table.element(a,'Margin of Error',header=TRUE)
a<-table.element(a,par2)
a<-table.row.end(a)
a<-table.row.start(a)
a<-table.element(a,'Confidence',header=TRUE)
a<-table.element(a,par3)
a<-table.row.end(a)
a<-table.row.start(a)
a<-table.element(a,'Power',header=TRUE)
a<-table.element(a,par5)
a<-table.row.end(a)
a<-table.row.start(a)
a<-table.element(a,'Response Distribution (Proportion)',header=TRUE)
a<-table.element(a,par4)
a<-table.row.end(a)
a<-table.row.start(a)
a<-table.element(a,'z(alpha/2) + z(beta)',header=TRUE)
a<-table.element(a,z)
a<-table.row.end(a)
a<-table.row.start(a)
a<-table.element(a,'z(alpha) + z(beta)',header=TRUE)
a<-table.element(a,z1)
a<-table.row.end(a)
a<-table.row.start(a)
a<-table.element(a,'Minimum Sample Size (2 sided test)',header=TRUE)
a<-table.element(a,n)
a<-table.row.end(a)
a<-table.row.start(a)
a<-table.element(a,'Minimum Sample Size (1 sided test)',header=TRUE)
a<-table.element(a,n1)
a<-table.row.end(a)
a<-table.end(a)
table.save(a,file='mytable.tab')
(n <- dum / par22)
(n1 <- dum1 / par22)
a<-table.start()
a<-table.row.start(a)
a<-table.element(a,'Minimum Sample Size (infinite population)',2,TRUE)
a<-table.row.end(a)
a<-table.row.start(a)
a<-table.element(a,'Population Size',header=TRUE)
a<-table.element(a,'infinite')
a<-table.row.end(a)
a<-table.row.start(a)
a<-table.element(a,'Margin of Error',header=TRUE)
a<-table.element(a,par2)
a<-table.row.end(a)
a<-table.row.start(a)
a<-table.element(a,'Confidence',header=TRUE)
a<-table.element(a,par3)
a<-table.row.end(a)
a<-table.row.start(a)
a<-table.element(a,'Power',header=TRUE)
a<-table.element(a,par5)
a<-table.row.end(a)
a<-table.row.start(a)
a<-table.element(a,'Response Distribution (Proportion)',header=TRUE)
a<-table.element(a,par4)
a<-table.row.end(a)
a<-table.row.start(a)
a<-table.element(a,'z(alpha/2) + z(beta)',header=TRUE)
a<-table.element(a,z)
a<-table.row.end(a)
a<-table.row.start(a)
a<-table.element(a,'z(alpha) + z(beta)',header=TRUE)
a<-table.element(a,z1)
a<-table.row.end(a)
a<-table.row.start(a)
a<-table.element(a,'Minimum Sample Size (2 sided test)',header=TRUE)
a<-table.element(a,n)
a<-table.row.end(a)
a<-table.row.start(a)
a<-table.element(a,'Minimum Sample Size (1 sided test)',header=TRUE)
a<-table.element(a,n1)
a<-table.row.end(a)
a<-table.end(a)
table.save(a,file='mytable.tab')