Free Statistics

of Irreproducible Research!

Author's title

Author*The author of this computation has been verified*
R Software Modulerwasp_hierarchicalclustering.wasp
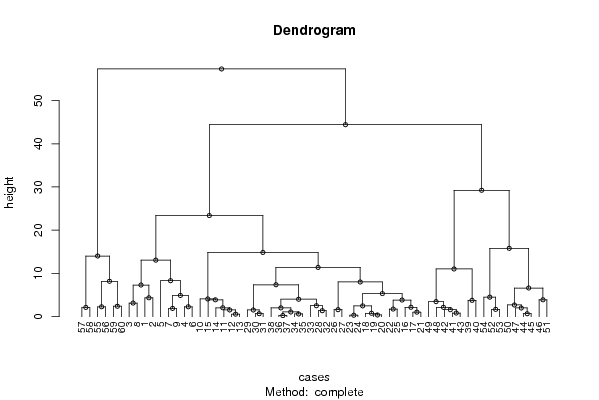
Title produced by softwareHierarchical Clustering
Date of computationMon, 10 Nov 2008 08:35:47 -0700
Cite this page as followsStatistical Computations at FreeStatistics.org, Office for Research Development and Education, URL https://freestatistics.org/blog/index.php?v=date/2008/Nov/10/t1226331375r17fz7g9ru9kq9e.htm/, Retrieved Sun, 19 May 2024 12:34:50 +0000
Statistical Computations at FreeStatistics.org, Office for Research Development and Education, URL https://freestatistics.org/blog/index.php?pk=23111, Retrieved Sun, 19 May 2024 12:34:50 +0000
QR Codes:

Original text written by user:
IsPrivate?No (this computation is public)
User-defined keywords
Estimated Impact122
Family? (F = Feedback message, R = changed R code, M = changed R Module, P = changed Parameters, D = changed Data)
F       [Hierarchical Clustering] [Hierarchical Clus...] [2008-11-10 15:35:47] [63302faa1e3976bf98d1de42298c0b24] [Current]
Feedback Forum
2008-11-23 14:45:38 [Chi-Kwong Man] [reply
Hierarchical Clustering: welke observaties kan men plaatsen in één cluster? Dit is puur exploratieve methode.
2008-11-23 20:38:32 [Elias Van Deun] [reply
Deze techniek heeft als doel het groeperen van categorieën in clusters. Clusters worden gevormd door groepen van gelijkaardige waarden.

Post a new message
Dataseries X:
105.15	118.63	118.76	107.06
105.24	121.83	119.28	109.98
105.57	119.97	119.89	112.64
105.62	124.98	120.38	112.89
106.17	129.99	121.39	112.9
106.27	126.6	121.86	112.9
106.41	121.71	122.21	112.91
106.94	119.28	122.61	112.99
107.16	122.63	123.7	113.01
107.32	116.74	125.53	113
107.32	114.23	126.03	113.07
107.35	113.23	126.17	113.07
107.55	112.75	126.39	113.21
107.87	113.54	127.55	114.13
108.37	115.3	128.86	114.59
108.38	121.05	129.59	114.88
107.92	119.51	130.4	115.3
108.03	116.78	130.52	115.33
108.14	117.17	130.55	115.36
108.3	117.5	130.67	115.41
108.64	119.65	131.13	115.43
108.66	120.97	132.15	115.43
109.04	117.18	132.69	115.43
109.03	116.87	132.8	115.43
109.03	119.46	132.96	115.56
109.54	122.52	133.05	115.88
109.75	124.1	133.23	116.02
109.83	118.39	135.32	116.09
109.65	113.1	136.22	116.28
109.82	113.94	136.33	116.28
109.95	114.58	136.53	116.28
110.12	118.79	136.6	116.25
110.15	120.44	136.77	116.07
110.21	118.37	137.49	116.08
109.99	118.44	138.06	116.07
110.14	117.93	138.46	115.92
110.14	117.76	138.34	116.07
110.81	118.29	139.06	117.22
110.97	121.11	139.95	117.75
110.99	124.86	140.41	117.78
109.73	131.17	141.39	117.78
109.81	130.16	141.87	117.81
110.02	131.76	141.91	117.81
110.18	134.7	141.99	117.74
110.21	135.32	142.26	117.75
110.25	140.23	142.38	117.76
110.36	136.31	143.17	117.76
110.51	131.62	143.28	117.75
110.6	128.9	143.8	117.8
110.95	133.89	144.16	118.09
111.18	138.21	145.36	118.95
111.19	146.12	146.83	119.03
111.69	144.69	147.56	118.9
111.7	149.18	148.04	118.9
111.83	156.6	148.69	118.9
111.77	158.87	148.93	118.87
111.73	164.85	149.21	118.88
112.01	162.89	149.86	119.36
111.86	153.31	150.64	119.39
112.04	150.91	150.69	119.47


Summary of computational transaction
Raw Inputview raw input (R code)
Raw Outputview raw output of R engine
Computing time3 seconds
R Server'Herman Ole Andreas Wold' @ 193.190.124.10:1001

\begin{tabular}{lllllllll}
\hline
Summary of computational transaction \tabularnewline
Raw Input & view raw input (R code)  \tabularnewline
Raw Output & view raw output of R engine  \tabularnewline
Computing time & 3 seconds \tabularnewline
R Server & 'Herman Ole Andreas Wold' @ 193.190.124.10:1001 \tabularnewline
\hline
\end{tabular}
%Source: https://freestatistics.org/blog/index.php?pk=23111&T=0

[TABLE]
[ROW][C]Summary of computational transaction[/C][/ROW]
[ROW][C]Raw Input[/C][C]view raw input (R code) [/C][/ROW]
[ROW][C]Raw Output[/C][C]view raw output of R engine [/C][/ROW]
[ROW][C]Computing time[/C][C]3 seconds[/C][/ROW]
[ROW][C]R Server[/C][C]'Herman Ole Andreas Wold' @ 193.190.124.10:1001[/C][/ROW]
[/TABLE]
Source: https://freestatistics.org/blog/index.php?pk=23111&T=0

Globally Unique Identifier (entire table): ba.freestatistics.org/blog/index.php?pk=23111&T=0

As an alternative you can also use a QR Code:  

The GUIDs for individual cells are displayed in the table below:

Summary of computational transaction
Raw Inputview raw input (R code)
Raw Outputview raw output of R engine
Computing time3 seconds
R Server'Herman Ole Andreas Wold' @ 193.190.124.10:1001


Summary of Dendrogram
LabelHeight
10.256515106767611
20.329089653438094
30.389101529166864
40.581721582889963
50.615060972587264
60.676978581640509
70.683008052661166
80.78752777728788
90.838749068553885
101.04297650980259
111.07935165724614
121.38133992919919
131.54159008818817
141.54677082982581
151.61012421881046
161.61421807696481
171.68662384662378
181.7578395831247
191.90761631362285
202.00432033367922
212.03246156175215
222.05246193630966
232.13843400646362
242.14785939949523
252.16834037918404
262.28363744933386
272.28853665035104
282.4085887984461
292.49329099785805
302.53136326907065
312.70064807037128
323.14227624501730
333.47680888171898
343.77828003197222
353.84316276001942
363.89617761402122
373.9040747943655
384.02925551435995
394.09793850612721
404.36404628756387
414.51559519886361
424.90451832497341
435.33867961203892
446.63045247324797
457.32215815180196
467.38052843636552
478.0225307727674
488.1787590745785
498.32397140792784
5011.0345185667523
5111.4025304209197
5213.0809976683738
5314.0341797052767
5414.8643802427145
5515.8131938582944
5623.3980084622602
5729.2442883312280
5844.4264448273773
5957.3130325493251

\begin{tabular}{lllllllll}
\hline
Summary of Dendrogram \tabularnewline
Label & Height \tabularnewline
1 & 0.256515106767611 \tabularnewline
2 & 0.329089653438094 \tabularnewline
3 & 0.389101529166864 \tabularnewline
4 & 0.581721582889963 \tabularnewline
5 & 0.615060972587264 \tabularnewline
6 & 0.676978581640509 \tabularnewline
7 & 0.683008052661166 \tabularnewline
8 & 0.78752777728788 \tabularnewline
9 & 0.838749068553885 \tabularnewline
10 & 1.04297650980259 \tabularnewline
11 & 1.07935165724614 \tabularnewline
12 & 1.38133992919919 \tabularnewline
13 & 1.54159008818817 \tabularnewline
14 & 1.54677082982581 \tabularnewline
15 & 1.61012421881046 \tabularnewline
16 & 1.61421807696481 \tabularnewline
17 & 1.68662384662378 \tabularnewline
18 & 1.7578395831247 \tabularnewline
19 & 1.90761631362285 \tabularnewline
20 & 2.00432033367922 \tabularnewline
21 & 2.03246156175215 \tabularnewline
22 & 2.05246193630966 \tabularnewline
23 & 2.13843400646362 \tabularnewline
24 & 2.14785939949523 \tabularnewline
25 & 2.16834037918404 \tabularnewline
26 & 2.28363744933386 \tabularnewline
27 & 2.28853665035104 \tabularnewline
28 & 2.4085887984461 \tabularnewline
29 & 2.49329099785805 \tabularnewline
30 & 2.53136326907065 \tabularnewline
31 & 2.70064807037128 \tabularnewline
32 & 3.14227624501730 \tabularnewline
33 & 3.47680888171898 \tabularnewline
34 & 3.77828003197222 \tabularnewline
35 & 3.84316276001942 \tabularnewline
36 & 3.89617761402122 \tabularnewline
37 & 3.9040747943655 \tabularnewline
38 & 4.02925551435995 \tabularnewline
39 & 4.09793850612721 \tabularnewline
40 & 4.36404628756387 \tabularnewline
41 & 4.51559519886361 \tabularnewline
42 & 4.90451832497341 \tabularnewline
43 & 5.33867961203892 \tabularnewline
44 & 6.63045247324797 \tabularnewline
45 & 7.32215815180196 \tabularnewline
46 & 7.38052843636552 \tabularnewline
47 & 8.0225307727674 \tabularnewline
48 & 8.1787590745785 \tabularnewline
49 & 8.32397140792784 \tabularnewline
50 & 11.0345185667523 \tabularnewline
51 & 11.4025304209197 \tabularnewline
52 & 13.0809976683738 \tabularnewline
53 & 14.0341797052767 \tabularnewline
54 & 14.8643802427145 \tabularnewline
55 & 15.8131938582944 \tabularnewline
56 & 23.3980084622602 \tabularnewline
57 & 29.2442883312280 \tabularnewline
58 & 44.4264448273773 \tabularnewline
59 & 57.3130325493251 \tabularnewline
\hline
\end{tabular}
%Source: https://freestatistics.org/blog/index.php?pk=23111&T=1

[TABLE]
[ROW][C]Summary of Dendrogram[/C][/ROW]
[ROW][C]Label[/C][C]Height[/C][/ROW]
[ROW][C]1[/C][C]0.256515106767611[/C][/ROW]
[ROW][C]2[/C][C]0.329089653438094[/C][/ROW]
[ROW][C]3[/C][C]0.389101529166864[/C][/ROW]
[ROW][C]4[/C][C]0.581721582889963[/C][/ROW]
[ROW][C]5[/C][C]0.615060972587264[/C][/ROW]
[ROW][C]6[/C][C]0.676978581640509[/C][/ROW]
[ROW][C]7[/C][C]0.683008052661166[/C][/ROW]
[ROW][C]8[/C][C]0.78752777728788[/C][/ROW]
[ROW][C]9[/C][C]0.838749068553885[/C][/ROW]
[ROW][C]10[/C][C]1.04297650980259[/C][/ROW]
[ROW][C]11[/C][C]1.07935165724614[/C][/ROW]
[ROW][C]12[/C][C]1.38133992919919[/C][/ROW]
[ROW][C]13[/C][C]1.54159008818817[/C][/ROW]
[ROW][C]14[/C][C]1.54677082982581[/C][/ROW]
[ROW][C]15[/C][C]1.61012421881046[/C][/ROW]
[ROW][C]16[/C][C]1.61421807696481[/C][/ROW]
[ROW][C]17[/C][C]1.68662384662378[/C][/ROW]
[ROW][C]18[/C][C]1.7578395831247[/C][/ROW]
[ROW][C]19[/C][C]1.90761631362285[/C][/ROW]
[ROW][C]20[/C][C]2.00432033367922[/C][/ROW]
[ROW][C]21[/C][C]2.03246156175215[/C][/ROW]
[ROW][C]22[/C][C]2.05246193630966[/C][/ROW]
[ROW][C]23[/C][C]2.13843400646362[/C][/ROW]
[ROW][C]24[/C][C]2.14785939949523[/C][/ROW]
[ROW][C]25[/C][C]2.16834037918404[/C][/ROW]
[ROW][C]26[/C][C]2.28363744933386[/C][/ROW]
[ROW][C]27[/C][C]2.28853665035104[/C][/ROW]
[ROW][C]28[/C][C]2.4085887984461[/C][/ROW]
[ROW][C]29[/C][C]2.49329099785805[/C][/ROW]
[ROW][C]30[/C][C]2.53136326907065[/C][/ROW]
[ROW][C]31[/C][C]2.70064807037128[/C][/ROW]
[ROW][C]32[/C][C]3.14227624501730[/C][/ROW]
[ROW][C]33[/C][C]3.47680888171898[/C][/ROW]
[ROW][C]34[/C][C]3.77828003197222[/C][/ROW]
[ROW][C]35[/C][C]3.84316276001942[/C][/ROW]
[ROW][C]36[/C][C]3.89617761402122[/C][/ROW]
[ROW][C]37[/C][C]3.9040747943655[/C][/ROW]
[ROW][C]38[/C][C]4.02925551435995[/C][/ROW]
[ROW][C]39[/C][C]4.09793850612721[/C][/ROW]
[ROW][C]40[/C][C]4.36404628756387[/C][/ROW]
[ROW][C]41[/C][C]4.51559519886361[/C][/ROW]
[ROW][C]42[/C][C]4.90451832497341[/C][/ROW]
[ROW][C]43[/C][C]5.33867961203892[/C][/ROW]
[ROW][C]44[/C][C]6.63045247324797[/C][/ROW]
[ROW][C]45[/C][C]7.32215815180196[/C][/ROW]
[ROW][C]46[/C][C]7.38052843636552[/C][/ROW]
[ROW][C]47[/C][C]8.0225307727674[/C][/ROW]
[ROW][C]48[/C][C]8.1787590745785[/C][/ROW]
[ROW][C]49[/C][C]8.32397140792784[/C][/ROW]
[ROW][C]50[/C][C]11.0345185667523[/C][/ROW]
[ROW][C]51[/C][C]11.4025304209197[/C][/ROW]
[ROW][C]52[/C][C]13.0809976683738[/C][/ROW]
[ROW][C]53[/C][C]14.0341797052767[/C][/ROW]
[ROW][C]54[/C][C]14.8643802427145[/C][/ROW]
[ROW][C]55[/C][C]15.8131938582944[/C][/ROW]
[ROW][C]56[/C][C]23.3980084622602[/C][/ROW]
[ROW][C]57[/C][C]29.2442883312280[/C][/ROW]
[ROW][C]58[/C][C]44.4264448273773[/C][/ROW]
[ROW][C]59[/C][C]57.3130325493251[/C][/ROW]
[/TABLE]
Source: https://freestatistics.org/blog/index.php?pk=23111&T=1

Globally Unique Identifier (entire table): ba.freestatistics.org/blog/index.php?pk=23111&T=1

As an alternative you can also use a QR Code:  

The GUIDs for individual cells are displayed in the table below:

Summary of Dendrogram
LabelHeight
10.256515106767611
20.329089653438094
30.389101529166864
40.581721582889963
50.615060972587264
60.676978581640509
70.683008052661166
80.78752777728788
90.838749068553885
101.04297650980259
111.07935165724614
121.38133992919919
131.54159008818817
141.54677082982581
151.61012421881046
161.61421807696481
171.68662384662378
181.7578395831247
191.90761631362285
202.00432033367922
212.03246156175215
222.05246193630966
232.13843400646362
242.14785939949523
252.16834037918404
262.28363744933386
272.28853665035104
282.4085887984461
292.49329099785805
302.53136326907065
312.70064807037128
323.14227624501730
333.47680888171898
343.77828003197222
353.84316276001942
363.89617761402122
373.9040747943655
384.02925551435995
394.09793850612721
404.36404628756387
414.51559519886361
424.90451832497341
435.33867961203892
446.63045247324797
457.32215815180196
467.38052843636552
478.0225307727674
488.1787590745785
498.32397140792784
5011.0345185667523
5111.4025304209197
5213.0809976683738
5314.0341797052767
5414.8643802427145
5515.8131938582944
5623.3980084622602
5729.2442883312280
5844.4264448273773
5957.3130325493251


Parameters (Session):
par1 = complete ; par2 = ALL ; par3 = FALSE ; par4 = FALSE ;
Parameters (R input):
par1 = complete ; par2 = ALL ; par3 = FALSE ; par4 = FALSE ;
R code (references can be found in the software module):
par3 <- as.logical(par3)
par4 <- as.logical(par4)
if (par3 == 'TRUE'){
dum = xlab
xlab = ylab
ylab = dum
}
x <- t(y)
hc <- hclust(dist(x),method=par1)
d <- as.dendrogram(hc)
str(d)
mysub <- paste('Method: ',par1)
bitmap(file='test1.png')
if (par4 == 'TRUE'){
plot(d,main=main,ylab=ylab,xlab=xlab,horiz=par3, nodePar=list(pch = c(1,NA), cex=0.8, lab.cex = 0.8),type='t',center=T, sub=mysub)
} else {
plot(d,main=main,ylab=ylab,xlab=xlab,horiz=par3, nodePar=list(pch = c(1,NA), cex=0.8, lab.cex = 0.8), sub=mysub)
}
dev.off()
if (par2 != 'ALL'){
if (par3 == 'TRUE'){
ylab = 'cluster'
} else {
xlab = 'cluster'
}
par2 <- as.numeric(par2)
memb <- cutree(hc, k = par2)
cent <- NULL
for(k in 1:par2){
cent <- rbind(cent, colMeans(x[memb == k, , drop = FALSE]))
}
hc1 <- hclust(dist(cent),method=par1, members = table(memb))
de <- as.dendrogram(hc1)
bitmap(file='test2.png')
if (par4 == 'TRUE'){
plot(de,main=main,ylab=ylab,xlab=xlab,horiz=par3, nodePar=list(pch = c(1,NA), cex=0.8, lab.cex = 0.8),type='t',center=T, sub=mysub)
} else {
plot(de,main=main,ylab=ylab,xlab=xlab,horiz=par3, nodePar=list(pch = c(1,NA), cex=0.8, lab.cex = 0.8), sub=mysub)
}
dev.off()
str(de)
}
load(file='createtable')
a<-table.start()
a<-table.row.start(a)
a<-table.element(a,'Summary of Dendrogram',2,TRUE)
a<-table.row.end(a)
a<-table.row.start(a)
a<-table.element(a,'Label',header=TRUE)
a<-table.element(a,'Height',header=TRUE)
a<-table.row.end(a)
num <- length(x[,1])-1
for (i in 1:num)
{
a<-table.row.start(a)
a<-table.element(a,hc$labels[i])
a<-table.element(a,hc$height[i])
a<-table.row.end(a)
}
a<-table.end(a)
table.save(a,file='mytable1.tab')
if (par2 != 'ALL'){
a<-table.start()
a<-table.row.start(a)
a<-table.element(a,'Summary of Cut Dendrogram',2,TRUE)
a<-table.row.end(a)
a<-table.row.start(a)
a<-table.element(a,'Label',header=TRUE)
a<-table.element(a,'Height',header=TRUE)
a<-table.row.end(a)
num <- par2-1
for (i in 1:num)
{
a<-table.row.start(a)
a<-table.element(a,i)
a<-table.element(a,hc1$height[i])
a<-table.row.end(a)
}
a<-table.end(a)
table.save(a,file='mytable2.tab')
}