Free Statistics

of Irreproducible Research!

Author's title

Author*Unverified author*
R Software Modulerwasp_percentiles.wasp
Title produced by softwarePercentiles
Date of computationMon, 10 Nov 2008 07:35:44 -0700
Cite this page as followsStatistical Computations at FreeStatistics.org, Office for Research Development and Education, URL https://freestatistics.org/blog/index.php?v=date/2008/Nov/10/t1226327782hm4yvmzfvxod0gh.htm/, Retrieved Sun, 19 May 2024 10:50:54 +0000
Statistical Computations at FreeStatistics.org, Office for Research Development and Education, URL https://freestatistics.org/blog/index.php?pk=23088, Retrieved Sun, 19 May 2024 10:50:54 +0000
QR Codes:

Original text written by user:
IsPrivate?No (this computation is public)
User-defined keywords
Estimated Impact163
Family? (F = Feedback message, R = changed R code, M = changed R Module, P = changed Parameters, D = changed Data)
F       [Percentiles] [various eda q5] [2008-11-10 14:35:44] [4940af498c7c54f3992f17142bd40069] [Current]
- RMPD    [Maximum-likelihood Fitting - Normal Distribution] [Various EDA Maxim...] [2008-11-16 16:21:50] [cf9c64468d04c2c4dd548cc66b4e3677]
Feedback Forum
2008-11-16 16:29:20 [Jan Van Riet] [reply
Je hebt de verkeerde methode gebruikt. Hieronder vind je de juiste, nl. die van de Maximum-likelihood Fitting - Normal Distribution:

http://www.freestatistics.org/blog/index.php?v=date/2008/Nov/16/t1226852571unwscpxacgwtznr.htm

We zien dat er een plotse daling is rond waarde 75. Nochtans wijst het gemiddelde en de standaarddeviatie hier niet op. De normaalverdeling is dus geen garantie op een goede schatting voor Yt.
2008-11-21 20:43:59 [Kim Wester] [reply
De student heeft inderdaad de verkeerde techniek toegepast. Wanneer we kijken naar bovenstaande hercomputatie kan worden gezegd dat op de grafiek de echte waarden worden weergeven door het histogram en de geschatte waarden door de curve. Deze lopen gelijk op tot bij punt 75 waar een visueel verschil tussen beide is waar te nemen. Je kan dus concluderen dat de normaalverdeling geen goede benadering is voor Yt.
2008-11-23 15:45:09 [Nathalie Boden] [reply
Hier heb ik inderdaad de verkeerde methode toegepast. We kunnen iedereen besluiten dat de normaal geen goede benadering is voor Yt. We zien bijvoorbeeld dat er bij de tussen 70-75 meer waarden voorkomen dan bij 75-80 dus met andere woorden een daling.

Post a new message
Dataseries X:
109,20
88,60
94,30
98,30
86,40
80,60
104,10
108,20
93,40
71,90
94,10
94,90
96,40
91,10
84,40
86,40
88,00
75,10
109,70
103,00
82,10
68,00
96,40
94,30
90,00
88,00
76,10
82,50
81,40
66,50
97,20
94,10
80,70
70,50
87,80
89,50
99,60
84,20
75,10
92,00
80,80
73,10
99,80
90,00
83,10
72,40
78,80
87,30
91,00
80,10
73,60
86,40
74,50
71,20
92,40
81,50
85,30
69,90
84,20
90,70
100,30


Summary of computational transaction
Raw Inputview raw input (R code)
Raw Outputview raw output of R engine
Computing time1 seconds
R Server'Gwilym Jenkins' @ 72.249.127.135

\begin{tabular}{lllllllll}
\hline
Summary of computational transaction \tabularnewline
Raw Input & view raw input (R code)  \tabularnewline
Raw Output & view raw output of R engine  \tabularnewline
Computing time & 1 seconds \tabularnewline
R Server & 'Gwilym Jenkins' @ 72.249.127.135 \tabularnewline
\hline
\end{tabular}
%Source: https://freestatistics.org/blog/index.php?pk=23088&T=0

[TABLE]
[ROW][C]Summary of computational transaction[/C][/ROW]
[ROW][C]Raw Input[/C][C]view raw input (R code) [/C][/ROW]
[ROW][C]Raw Output[/C][C]view raw output of R engine [/C][/ROW]
[ROW][C]Computing time[/C][C]1 seconds[/C][/ROW]
[ROW][C]R Server[/C][C]'Gwilym Jenkins' @ 72.249.127.135[/C][/ROW]
[/TABLE]
Source: https://freestatistics.org/blog/index.php?pk=23088&T=0

Globally Unique Identifier (entire table): ba.freestatistics.org/blog/index.php?pk=23088&T=0

As an alternative you can also use a QR Code:  

The GUIDs for individual cells are displayed in the table below:

Summary of computational transaction
Raw Inputview raw input (R code)
Raw Outputview raw output of R engine
Computing time1 seconds
R Server'Gwilym Jenkins' @ 72.249.127.135


Percentiles - Ungrouped Data
pWeighted Average at XnpWeighted Average at X(n+1)pEmpirical Distribution FunctionEmpirical Distribution Function - AveragingEmpirical Distribution Function - InterpolationClosest ObservationTrue Basic - Statistics Graphics ToolkitMS Excel (old versions)
0.0266.8366.86686868.3866.567.6466.5
0.0468.83668.91269.969.970.146868.98868
0.0670.29670.33270.570.570.9270.570.06870.5
0.0871.11671.17271.271.271.7671.270.52871.2
0.171.957272.472.472.471.972.371.9
0.1272.62472.70873.173.173.272.472.79272.4
0.1473.3773.4473.673.673.9673.673.2673.6
0.1674.28474.42874.574.574.8674.573.67274.5
0.1875.08875.175.175.175.175.175.175.1
0.275.375.576.176.176.175.175.775.1
0.2277.23477.82878.878.879.0676.177.07278.8
0.2479.63279.94480.180.180.380.178.95680.1
0.2680.5380.61280.680.680.6680.680.68880.6
0.2880.70880.73680.880.880.7880.780.76480.7
0.380.9881.1681.481.481.480.881.0481.4
0.3281.45281.48481.581.581.6281.581.41681.5
0.3481.94482.13282.182.182.2682.182.46882.1
0.3682.48482.69282.582.582.8682.582.90882.5
0.3883.29883.71684.284.283.9883.183.58484.2
0.484.284.284.284.284.284.284.284.2
0.4284.32484.43684.484.484.5884.485.26484.4
0.4485.15685.60885.385.385.7485.386.09285.3
0.4686.486.486.486.486.486.486.486.4
0.4886.486.486.486.486.486.486.486.4
0.586.8587.387.387.387.387.387.387.3
0.5287.6687.84887.887.887.8487.887.95287.8
0.5487.98888888888888888
0.5688.09688.43288.688.688.368888.16888.6
0.5888.94289.46489.589.589.3288.688.63689.5
0.689.890909090909090
0.629090.308909090.149090.39290
0.6490.71290.904919190.8290.790.79691
0.6691.02691.09291.191.191.069191.00891.1
0.6891.53292.064929291.8291.192.33692
0.792.2892.892.492.492.492.49392.4
0.7293.3293.84893.493.493.5493.493.65294.1
0.7494.194.194.194.194.194.194.194.1
0.7694.17294.394.394.394.2294.194.394.3
0.7894.394.51694.394.394.394.394.68494.3
0.894.7895.894.994.994.994.995.596.4
0.8296.496.496.496.496.496.496.496.4
0.8496.59297.28897.297.296.7296.498.21297.2
0.8697.70698.71698.398.397.8697.299.18498.3
0.8899.18499.71299.699.699.3499.699.68899.8
0.999.78100.299.899.899.899.899.9100.3
0.92100.624103.044103103100.84100.3104.056103
0.94103.374105.248104.1104.1103.44103107.052104.1
0.96106.396108.72108.2108.2106.56108.2108.68109.2
0.98108.98109.58109.2109.2109109.2109.32109.7

\begin{tabular}{lllllllll}
\hline
Percentiles - Ungrouped Data \tabularnewline
p & Weighted Average at Xnp & Weighted Average at X(n+1)p & Empirical Distribution Function & Empirical Distribution Function - Averaging & Empirical Distribution Function - Interpolation & Closest Observation & True Basic - Statistics Graphics Toolkit & MS Excel (old versions) \tabularnewline
0.02 & 66.83 & 66.86 & 68 & 68 & 68.38 & 66.5 & 67.64 & 66.5 \tabularnewline
0.04 & 68.836 & 68.912 & 69.9 & 69.9 & 70.14 & 68 & 68.988 & 68 \tabularnewline
0.06 & 70.296 & 70.332 & 70.5 & 70.5 & 70.92 & 70.5 & 70.068 & 70.5 \tabularnewline
0.08 & 71.116 & 71.172 & 71.2 & 71.2 & 71.76 & 71.2 & 70.528 & 71.2 \tabularnewline
0.1 & 71.95 & 72 & 72.4 & 72.4 & 72.4 & 71.9 & 72.3 & 71.9 \tabularnewline
0.12 & 72.624 & 72.708 & 73.1 & 73.1 & 73.2 & 72.4 & 72.792 & 72.4 \tabularnewline
0.14 & 73.37 & 73.44 & 73.6 & 73.6 & 73.96 & 73.6 & 73.26 & 73.6 \tabularnewline
0.16 & 74.284 & 74.428 & 74.5 & 74.5 & 74.86 & 74.5 & 73.672 & 74.5 \tabularnewline
0.18 & 75.088 & 75.1 & 75.1 & 75.1 & 75.1 & 75.1 & 75.1 & 75.1 \tabularnewline
0.2 & 75.3 & 75.5 & 76.1 & 76.1 & 76.1 & 75.1 & 75.7 & 75.1 \tabularnewline
0.22 & 77.234 & 77.828 & 78.8 & 78.8 & 79.06 & 76.1 & 77.072 & 78.8 \tabularnewline
0.24 & 79.632 & 79.944 & 80.1 & 80.1 & 80.3 & 80.1 & 78.956 & 80.1 \tabularnewline
0.26 & 80.53 & 80.612 & 80.6 & 80.6 & 80.66 & 80.6 & 80.688 & 80.6 \tabularnewline
0.28 & 80.708 & 80.736 & 80.8 & 80.8 & 80.78 & 80.7 & 80.764 & 80.7 \tabularnewline
0.3 & 80.98 & 81.16 & 81.4 & 81.4 & 81.4 & 80.8 & 81.04 & 81.4 \tabularnewline
0.32 & 81.452 & 81.484 & 81.5 & 81.5 & 81.62 & 81.5 & 81.416 & 81.5 \tabularnewline
0.34 & 81.944 & 82.132 & 82.1 & 82.1 & 82.26 & 82.1 & 82.468 & 82.1 \tabularnewline
0.36 & 82.484 & 82.692 & 82.5 & 82.5 & 82.86 & 82.5 & 82.908 & 82.5 \tabularnewline
0.38 & 83.298 & 83.716 & 84.2 & 84.2 & 83.98 & 83.1 & 83.584 & 84.2 \tabularnewline
0.4 & 84.2 & 84.2 & 84.2 & 84.2 & 84.2 & 84.2 & 84.2 & 84.2 \tabularnewline
0.42 & 84.324 & 84.436 & 84.4 & 84.4 & 84.58 & 84.4 & 85.264 & 84.4 \tabularnewline
0.44 & 85.156 & 85.608 & 85.3 & 85.3 & 85.74 & 85.3 & 86.092 & 85.3 \tabularnewline
0.46 & 86.4 & 86.4 & 86.4 & 86.4 & 86.4 & 86.4 & 86.4 & 86.4 \tabularnewline
0.48 & 86.4 & 86.4 & 86.4 & 86.4 & 86.4 & 86.4 & 86.4 & 86.4 \tabularnewline
0.5 & 86.85 & 87.3 & 87.3 & 87.3 & 87.3 & 87.3 & 87.3 & 87.3 \tabularnewline
0.52 & 87.66 & 87.848 & 87.8 & 87.8 & 87.84 & 87.8 & 87.952 & 87.8 \tabularnewline
0.54 & 87.988 & 88 & 88 & 88 & 88 & 88 & 88 & 88 \tabularnewline
0.56 & 88.096 & 88.432 & 88.6 & 88.6 & 88.36 & 88 & 88.168 & 88.6 \tabularnewline
0.58 & 88.942 & 89.464 & 89.5 & 89.5 & 89.32 & 88.6 & 88.636 & 89.5 \tabularnewline
0.6 & 89.8 & 90 & 90 & 90 & 90 & 90 & 90 & 90 \tabularnewline
0.62 & 90 & 90.308 & 90 & 90 & 90.14 & 90 & 90.392 & 90 \tabularnewline
0.64 & 90.712 & 90.904 & 91 & 91 & 90.82 & 90.7 & 90.796 & 91 \tabularnewline
0.66 & 91.026 & 91.092 & 91.1 & 91.1 & 91.06 & 91 & 91.008 & 91.1 \tabularnewline
0.68 & 91.532 & 92.064 & 92 & 92 & 91.82 & 91.1 & 92.336 & 92 \tabularnewline
0.7 & 92.28 & 92.8 & 92.4 & 92.4 & 92.4 & 92.4 & 93 & 92.4 \tabularnewline
0.72 & 93.32 & 93.848 & 93.4 & 93.4 & 93.54 & 93.4 & 93.652 & 94.1 \tabularnewline
0.74 & 94.1 & 94.1 & 94.1 & 94.1 & 94.1 & 94.1 & 94.1 & 94.1 \tabularnewline
0.76 & 94.172 & 94.3 & 94.3 & 94.3 & 94.22 & 94.1 & 94.3 & 94.3 \tabularnewline
0.78 & 94.3 & 94.516 & 94.3 & 94.3 & 94.3 & 94.3 & 94.684 & 94.3 \tabularnewline
0.8 & 94.78 & 95.8 & 94.9 & 94.9 & 94.9 & 94.9 & 95.5 & 96.4 \tabularnewline
0.82 & 96.4 & 96.4 & 96.4 & 96.4 & 96.4 & 96.4 & 96.4 & 96.4 \tabularnewline
0.84 & 96.592 & 97.288 & 97.2 & 97.2 & 96.72 & 96.4 & 98.212 & 97.2 \tabularnewline
0.86 & 97.706 & 98.716 & 98.3 & 98.3 & 97.86 & 97.2 & 99.184 & 98.3 \tabularnewline
0.88 & 99.184 & 99.712 & 99.6 & 99.6 & 99.34 & 99.6 & 99.688 & 99.8 \tabularnewline
0.9 & 99.78 & 100.2 & 99.8 & 99.8 & 99.8 & 99.8 & 99.9 & 100.3 \tabularnewline
0.92 & 100.624 & 103.044 & 103 & 103 & 100.84 & 100.3 & 104.056 & 103 \tabularnewline
0.94 & 103.374 & 105.248 & 104.1 & 104.1 & 103.44 & 103 & 107.052 & 104.1 \tabularnewline
0.96 & 106.396 & 108.72 & 108.2 & 108.2 & 106.56 & 108.2 & 108.68 & 109.2 \tabularnewline
0.98 & 108.98 & 109.58 & 109.2 & 109.2 & 109 & 109.2 & 109.32 & 109.7 \tabularnewline
\hline
\end{tabular}
%Source: https://freestatistics.org/blog/index.php?pk=23088&T=1

[TABLE]
[ROW][C]Percentiles - Ungrouped Data[/C][/ROW]
[ROW][C]p[/C][C]Weighted Average at Xnp[/C][C]Weighted Average at X(n+1)p[/C][C]Empirical Distribution Function[/C][C]Empirical Distribution Function - Averaging[/C][C]Empirical Distribution Function - Interpolation[/C][C]Closest Observation[/C][C]True Basic - Statistics Graphics Toolkit[/C][C]MS Excel (old versions)[/C][/ROW]
[ROW][C]0.02[/C][C]66.83[/C][C]66.86[/C][C]68[/C][C]68[/C][C]68.38[/C][C]66.5[/C][C]67.64[/C][C]66.5[/C][/ROW]
[ROW][C]0.04[/C][C]68.836[/C][C]68.912[/C][C]69.9[/C][C]69.9[/C][C]70.14[/C][C]68[/C][C]68.988[/C][C]68[/C][/ROW]
[ROW][C]0.06[/C][C]70.296[/C][C]70.332[/C][C]70.5[/C][C]70.5[/C][C]70.92[/C][C]70.5[/C][C]70.068[/C][C]70.5[/C][/ROW]
[ROW][C]0.08[/C][C]71.116[/C][C]71.172[/C][C]71.2[/C][C]71.2[/C][C]71.76[/C][C]71.2[/C][C]70.528[/C][C]71.2[/C][/ROW]
[ROW][C]0.1[/C][C]71.95[/C][C]72[/C][C]72.4[/C][C]72.4[/C][C]72.4[/C][C]71.9[/C][C]72.3[/C][C]71.9[/C][/ROW]
[ROW][C]0.12[/C][C]72.624[/C][C]72.708[/C][C]73.1[/C][C]73.1[/C][C]73.2[/C][C]72.4[/C][C]72.792[/C][C]72.4[/C][/ROW]
[ROW][C]0.14[/C][C]73.37[/C][C]73.44[/C][C]73.6[/C][C]73.6[/C][C]73.96[/C][C]73.6[/C][C]73.26[/C][C]73.6[/C][/ROW]
[ROW][C]0.16[/C][C]74.284[/C][C]74.428[/C][C]74.5[/C][C]74.5[/C][C]74.86[/C][C]74.5[/C][C]73.672[/C][C]74.5[/C][/ROW]
[ROW][C]0.18[/C][C]75.088[/C][C]75.1[/C][C]75.1[/C][C]75.1[/C][C]75.1[/C][C]75.1[/C][C]75.1[/C][C]75.1[/C][/ROW]
[ROW][C]0.2[/C][C]75.3[/C][C]75.5[/C][C]76.1[/C][C]76.1[/C][C]76.1[/C][C]75.1[/C][C]75.7[/C][C]75.1[/C][/ROW]
[ROW][C]0.22[/C][C]77.234[/C][C]77.828[/C][C]78.8[/C][C]78.8[/C][C]79.06[/C][C]76.1[/C][C]77.072[/C][C]78.8[/C][/ROW]
[ROW][C]0.24[/C][C]79.632[/C][C]79.944[/C][C]80.1[/C][C]80.1[/C][C]80.3[/C][C]80.1[/C][C]78.956[/C][C]80.1[/C][/ROW]
[ROW][C]0.26[/C][C]80.53[/C][C]80.612[/C][C]80.6[/C][C]80.6[/C][C]80.66[/C][C]80.6[/C][C]80.688[/C][C]80.6[/C][/ROW]
[ROW][C]0.28[/C][C]80.708[/C][C]80.736[/C][C]80.8[/C][C]80.8[/C][C]80.78[/C][C]80.7[/C][C]80.764[/C][C]80.7[/C][/ROW]
[ROW][C]0.3[/C][C]80.98[/C][C]81.16[/C][C]81.4[/C][C]81.4[/C][C]81.4[/C][C]80.8[/C][C]81.04[/C][C]81.4[/C][/ROW]
[ROW][C]0.32[/C][C]81.452[/C][C]81.484[/C][C]81.5[/C][C]81.5[/C][C]81.62[/C][C]81.5[/C][C]81.416[/C][C]81.5[/C][/ROW]
[ROW][C]0.34[/C][C]81.944[/C][C]82.132[/C][C]82.1[/C][C]82.1[/C][C]82.26[/C][C]82.1[/C][C]82.468[/C][C]82.1[/C][/ROW]
[ROW][C]0.36[/C][C]82.484[/C][C]82.692[/C][C]82.5[/C][C]82.5[/C][C]82.86[/C][C]82.5[/C][C]82.908[/C][C]82.5[/C][/ROW]
[ROW][C]0.38[/C][C]83.298[/C][C]83.716[/C][C]84.2[/C][C]84.2[/C][C]83.98[/C][C]83.1[/C][C]83.584[/C][C]84.2[/C][/ROW]
[ROW][C]0.4[/C][C]84.2[/C][C]84.2[/C][C]84.2[/C][C]84.2[/C][C]84.2[/C][C]84.2[/C][C]84.2[/C][C]84.2[/C][/ROW]
[ROW][C]0.42[/C][C]84.324[/C][C]84.436[/C][C]84.4[/C][C]84.4[/C][C]84.58[/C][C]84.4[/C][C]85.264[/C][C]84.4[/C][/ROW]
[ROW][C]0.44[/C][C]85.156[/C][C]85.608[/C][C]85.3[/C][C]85.3[/C][C]85.74[/C][C]85.3[/C][C]86.092[/C][C]85.3[/C][/ROW]
[ROW][C]0.46[/C][C]86.4[/C][C]86.4[/C][C]86.4[/C][C]86.4[/C][C]86.4[/C][C]86.4[/C][C]86.4[/C][C]86.4[/C][/ROW]
[ROW][C]0.48[/C][C]86.4[/C][C]86.4[/C][C]86.4[/C][C]86.4[/C][C]86.4[/C][C]86.4[/C][C]86.4[/C][C]86.4[/C][/ROW]
[ROW][C]0.5[/C][C]86.85[/C][C]87.3[/C][C]87.3[/C][C]87.3[/C][C]87.3[/C][C]87.3[/C][C]87.3[/C][C]87.3[/C][/ROW]
[ROW][C]0.52[/C][C]87.66[/C][C]87.848[/C][C]87.8[/C][C]87.8[/C][C]87.84[/C][C]87.8[/C][C]87.952[/C][C]87.8[/C][/ROW]
[ROW][C]0.54[/C][C]87.988[/C][C]88[/C][C]88[/C][C]88[/C][C]88[/C][C]88[/C][C]88[/C][C]88[/C][/ROW]
[ROW][C]0.56[/C][C]88.096[/C][C]88.432[/C][C]88.6[/C][C]88.6[/C][C]88.36[/C][C]88[/C][C]88.168[/C][C]88.6[/C][/ROW]
[ROW][C]0.58[/C][C]88.942[/C][C]89.464[/C][C]89.5[/C][C]89.5[/C][C]89.32[/C][C]88.6[/C][C]88.636[/C][C]89.5[/C][/ROW]
[ROW][C]0.6[/C][C]89.8[/C][C]90[/C][C]90[/C][C]90[/C][C]90[/C][C]90[/C][C]90[/C][C]90[/C][/ROW]
[ROW][C]0.62[/C][C]90[/C][C]90.308[/C][C]90[/C][C]90[/C][C]90.14[/C][C]90[/C][C]90.392[/C][C]90[/C][/ROW]
[ROW][C]0.64[/C][C]90.712[/C][C]90.904[/C][C]91[/C][C]91[/C][C]90.82[/C][C]90.7[/C][C]90.796[/C][C]91[/C][/ROW]
[ROW][C]0.66[/C][C]91.026[/C][C]91.092[/C][C]91.1[/C][C]91.1[/C][C]91.06[/C][C]91[/C][C]91.008[/C][C]91.1[/C][/ROW]
[ROW][C]0.68[/C][C]91.532[/C][C]92.064[/C][C]92[/C][C]92[/C][C]91.82[/C][C]91.1[/C][C]92.336[/C][C]92[/C][/ROW]
[ROW][C]0.7[/C][C]92.28[/C][C]92.8[/C][C]92.4[/C][C]92.4[/C][C]92.4[/C][C]92.4[/C][C]93[/C][C]92.4[/C][/ROW]
[ROW][C]0.72[/C][C]93.32[/C][C]93.848[/C][C]93.4[/C][C]93.4[/C][C]93.54[/C][C]93.4[/C][C]93.652[/C][C]94.1[/C][/ROW]
[ROW][C]0.74[/C][C]94.1[/C][C]94.1[/C][C]94.1[/C][C]94.1[/C][C]94.1[/C][C]94.1[/C][C]94.1[/C][C]94.1[/C][/ROW]
[ROW][C]0.76[/C][C]94.172[/C][C]94.3[/C][C]94.3[/C][C]94.3[/C][C]94.22[/C][C]94.1[/C][C]94.3[/C][C]94.3[/C][/ROW]
[ROW][C]0.78[/C][C]94.3[/C][C]94.516[/C][C]94.3[/C][C]94.3[/C][C]94.3[/C][C]94.3[/C][C]94.684[/C][C]94.3[/C][/ROW]
[ROW][C]0.8[/C][C]94.78[/C][C]95.8[/C][C]94.9[/C][C]94.9[/C][C]94.9[/C][C]94.9[/C][C]95.5[/C][C]96.4[/C][/ROW]
[ROW][C]0.82[/C][C]96.4[/C][C]96.4[/C][C]96.4[/C][C]96.4[/C][C]96.4[/C][C]96.4[/C][C]96.4[/C][C]96.4[/C][/ROW]
[ROW][C]0.84[/C][C]96.592[/C][C]97.288[/C][C]97.2[/C][C]97.2[/C][C]96.72[/C][C]96.4[/C][C]98.212[/C][C]97.2[/C][/ROW]
[ROW][C]0.86[/C][C]97.706[/C][C]98.716[/C][C]98.3[/C][C]98.3[/C][C]97.86[/C][C]97.2[/C][C]99.184[/C][C]98.3[/C][/ROW]
[ROW][C]0.88[/C][C]99.184[/C][C]99.712[/C][C]99.6[/C][C]99.6[/C][C]99.34[/C][C]99.6[/C][C]99.688[/C][C]99.8[/C][/ROW]
[ROW][C]0.9[/C][C]99.78[/C][C]100.2[/C][C]99.8[/C][C]99.8[/C][C]99.8[/C][C]99.8[/C][C]99.9[/C][C]100.3[/C][/ROW]
[ROW][C]0.92[/C][C]100.624[/C][C]103.044[/C][C]103[/C][C]103[/C][C]100.84[/C][C]100.3[/C][C]104.056[/C][C]103[/C][/ROW]
[ROW][C]0.94[/C][C]103.374[/C][C]105.248[/C][C]104.1[/C][C]104.1[/C][C]103.44[/C][C]103[/C][C]107.052[/C][C]104.1[/C][/ROW]
[ROW][C]0.96[/C][C]106.396[/C][C]108.72[/C][C]108.2[/C][C]108.2[/C][C]106.56[/C][C]108.2[/C][C]108.68[/C][C]109.2[/C][/ROW]
[ROW][C]0.98[/C][C]108.98[/C][C]109.58[/C][C]109.2[/C][C]109.2[/C][C]109[/C][C]109.2[/C][C]109.32[/C][C]109.7[/C][/ROW]
[/TABLE]
Source: https://freestatistics.org/blog/index.php?pk=23088&T=1

Globally Unique Identifier (entire table): ba.freestatistics.org/blog/index.php?pk=23088&T=1

As an alternative you can also use a QR Code:  

The GUIDs for individual cells are displayed in the table below:

Percentiles - Ungrouped Data
pWeighted Average at XnpWeighted Average at X(n+1)pEmpirical Distribution FunctionEmpirical Distribution Function - AveragingEmpirical Distribution Function - InterpolationClosest ObservationTrue Basic - Statistics Graphics ToolkitMS Excel (old versions)
0.0266.8366.86686868.3866.567.6466.5
0.0468.83668.91269.969.970.146868.98868
0.0670.29670.33270.570.570.9270.570.06870.5
0.0871.11671.17271.271.271.7671.270.52871.2
0.171.957272.472.472.471.972.371.9
0.1272.62472.70873.173.173.272.472.79272.4
0.1473.3773.4473.673.673.9673.673.2673.6
0.1674.28474.42874.574.574.8674.573.67274.5
0.1875.08875.175.175.175.175.175.175.1
0.275.375.576.176.176.175.175.775.1
0.2277.23477.82878.878.879.0676.177.07278.8
0.2479.63279.94480.180.180.380.178.95680.1
0.2680.5380.61280.680.680.6680.680.68880.6
0.2880.70880.73680.880.880.7880.780.76480.7
0.380.9881.1681.481.481.480.881.0481.4
0.3281.45281.48481.581.581.6281.581.41681.5
0.3481.94482.13282.182.182.2682.182.46882.1
0.3682.48482.69282.582.582.8682.582.90882.5
0.3883.29883.71684.284.283.9883.183.58484.2
0.484.284.284.284.284.284.284.284.2
0.4284.32484.43684.484.484.5884.485.26484.4
0.4485.15685.60885.385.385.7485.386.09285.3
0.4686.486.486.486.486.486.486.486.4
0.4886.486.486.486.486.486.486.486.4
0.586.8587.387.387.387.387.387.387.3
0.5287.6687.84887.887.887.8487.887.95287.8
0.5487.98888888888888888
0.5688.09688.43288.688.688.368888.16888.6
0.5888.94289.46489.589.589.3288.688.63689.5
0.689.890909090909090
0.629090.308909090.149090.39290
0.6490.71290.904919190.8290.790.79691
0.6691.02691.09291.191.191.069191.00891.1
0.6891.53292.064929291.8291.192.33692
0.792.2892.892.492.492.492.49392.4
0.7293.3293.84893.493.493.5493.493.65294.1
0.7494.194.194.194.194.194.194.194.1
0.7694.17294.394.394.394.2294.194.394.3
0.7894.394.51694.394.394.394.394.68494.3
0.894.7895.894.994.994.994.995.596.4
0.8296.496.496.496.496.496.496.496.4
0.8496.59297.28897.297.296.7296.498.21297.2
0.8697.70698.71698.398.397.8697.299.18498.3
0.8899.18499.71299.699.699.3499.699.68899.8
0.999.78100.299.899.899.899.899.9100.3
0.92100.624103.044103103100.84100.3104.056103
0.94103.374105.248104.1104.1103.44103107.052104.1
0.96106.396108.72108.2108.2106.56108.2108.68109.2
0.98108.98109.58109.2109.2109109.2109.32109.7


Parameters (Session):
Parameters (R input):
R code (references can be found in the software module):
x <-sort(x[!is.na(x)])
q1 <- function(data,n,p,i,f) {
np <- n*p;
i <<- floor(np)
f <<- np - i
qvalue <- (1-f)*data[i] + f*data[i+1]
}
q2 <- function(data,n,p,i,f) {
np <- (n+1)*p
i <<- floor(np)
f <<- np - i
qvalue <- (1-f)*data[i] + f*data[i+1]
}
q3 <- function(data,n,p,i,f) {
np <- n*p
i <<- floor(np)
f <<- np - i
if (f==0) {
qvalue <- data[i]
} else {
qvalue <- data[i+1]
}
}
q4 <- function(data,n,p,i,f) {
np <- n*p
i <<- floor(np)
f <<- np - i
if (f==0) {
qvalue <- (data[i]+data[i+1])/2
} else {
qvalue <- data[i+1]
}
}
q5 <- function(data,n,p,i,f) {
np <- (n-1)*p
i <<- floor(np)
f <<- np - i
if (f==0) {
qvalue <- data[i+1]
} else {
qvalue <- data[i+1] + f*(data[i+2]-data[i+1])
}
}
q6 <- function(data,n,p,i,f) {
np <- n*p+0.5
i <<- floor(np)
f <<- np - i
qvalue <- data[i]
}
q7 <- function(data,n,p,i,f) {
np <- (n+1)*p
i <<- floor(np)
f <<- np - i
if (f==0) {
qvalue <- data[i]
} else {
qvalue <- f*data[i] + (1-f)*data[i+1]
}
}
q8 <- function(data,n,p,i,f) {
np <- (n+1)*p
i <<- floor(np)
f <<- np - i
if (f==0) {
qvalue <- data[i]
} else {
if (f == 0.5) {
qvalue <- (data[i]+data[i+1])/2
} else {
if (f < 0.5) {
qvalue <- data[i]
} else {
qvalue <- data[i+1]
}
}
}
}
lx <- length(x)
qval <- array(NA,dim=c(99,8))
mystep <- 25
mystart <- 25
if (lx>10){
mystep=10
mystart=10
}
if (lx>20){
mystep=5
mystart=5
}
if (lx>50){
mystep=2
mystart=2
}
if (lx>=100){
mystep=1
mystart=1
}
for (perc in seq(mystart,99,mystep)) {
qval[perc,1] <- q1(x,lx,perc/100,i,f)
qval[perc,2] <- q2(x,lx,perc/100,i,f)
qval[perc,3] <- q3(x,lx,perc/100,i,f)
qval[perc,4] <- q4(x,lx,perc/100,i,f)
qval[perc,5] <- q5(x,lx,perc/100,i,f)
qval[perc,6] <- q6(x,lx,perc/100,i,f)
qval[perc,7] <- q7(x,lx,perc/100,i,f)
qval[perc,8] <- q8(x,lx,perc/100,i,f)
}
bitmap(file='test1.png')
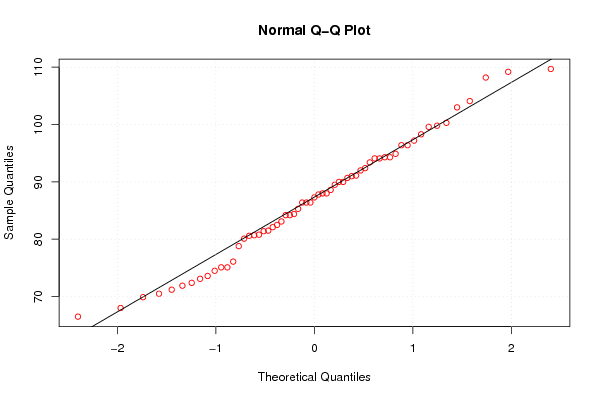
myqqnorm <- qqnorm(x,col=2)
qqline(x)
grid()
dev.off()
load(file='createtable')
a<-table.start()
a<-table.row.start(a)
a<-table.element(a,'Percentiles - Ungrouped Data',9,TRUE)
a<-table.row.end(a)
a<-table.row.start(a)
a<-table.element(a,'p',1,TRUE)
a<-table.element(a,hyperlink('method_1.htm', 'Weighted Average at Xnp',''),1,TRUE)
a<-table.element(a,hyperlink('method_2.htm','Weighted Average at X(n+1)p',''),1,TRUE)
a<-table.element(a,hyperlink('method_3.htm','Empirical Distribution Function',''),1,TRUE)
a<-table.element(a,hyperlink('method_4.htm','Empirical Distribution Function - Averaging',''),1,TRUE)
a<-table.element(a,hyperlink('method_5.htm','Empirical Distribution Function - Interpolation',''),1,TRUE)
a<-table.element(a,hyperlink('method_6.htm','Closest Observation',''),1,TRUE)
a<-table.element(a,hyperlink('method_7.htm','True Basic - Statistics Graphics Toolkit',''),1,TRUE)
a<-table.element(a,hyperlink('method_8.htm','MS Excel (old versions)',''),1,TRUE)
a<-table.row.end(a)
for (perc in seq(mystart,99,mystep)) {
a<-table.row.start(a)
a<-table.element(a,round(perc/100,2),1,TRUE)
for (j in 1:8) {
a<-table.element(a,round(qval[perc,j],6))
}
a<-table.row.end(a)
}
a<-table.end(a)
table.save(a,file='mytable.tab')