Free Statistics

of Irreproducible Research!

Author's title

Author*The author of this computation has been verified*
R Software Modulerwasp_cloud.wasp
Title produced by softwareTrivariate Scatterplots
Date of computationMon, 10 Nov 2008 07:13:12 -0700
Cite this page as followsStatistical Computations at FreeStatistics.org, Office for Research Development and Education, URL https://freestatistics.org/blog/index.php?v=date/2008/Nov/10/t1226326431w4v6g8apw9a24vt.htm/, Retrieved Sun, 19 May 2024 11:39:27 +0000
Statistical Computations at FreeStatistics.org, Office for Research Development and Education, URL https://freestatistics.org/blog/index.php?pk=23074, Retrieved Sun, 19 May 2024 11:39:27 +0000
QR Codes:

Original text written by user:
IsPrivate?No (this computation is public)
User-defined keywords
Estimated Impact163
Family? (F = Feedback message, R = changed R code, M = changed R Module, P = changed Parameters, D = changed Data)
F       [Trivariate Scatterplots] [Various EDA topic...] [2008-11-10 14:13:12] [3bb0537fcae9c337e49b9ce75ff3d4da] [Current]
Feedback Forum
2008-11-18 19:14:52 [Ruben Jacobs] [reply
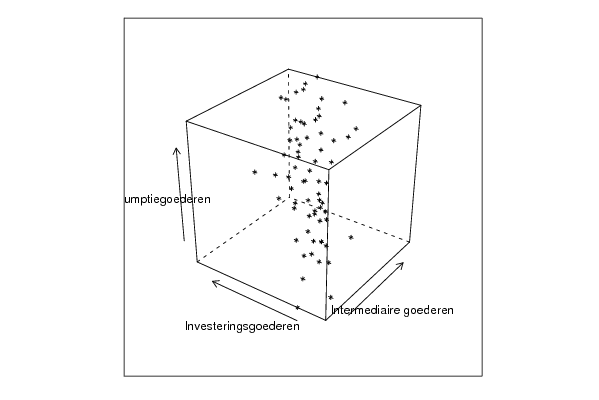
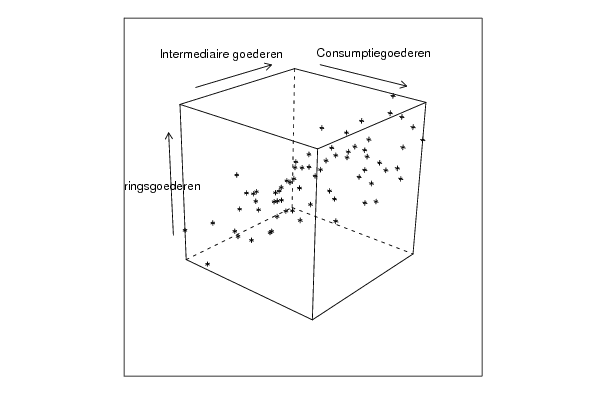
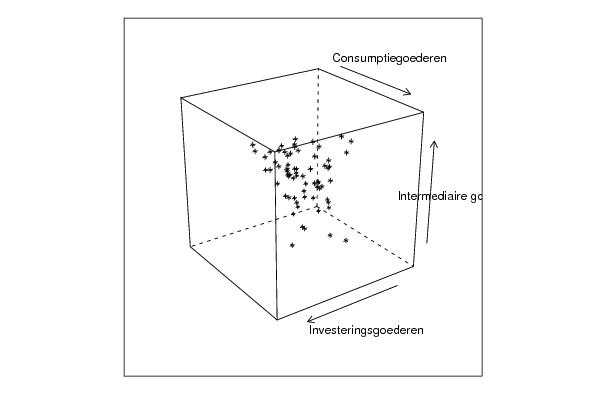
Ook bij deze berekening worden 3 reeksen met elkaar vergeleken. In de eerste grafieken kan je de scatterplots (kubussen) zien. Deze geven correlatie weer van 3 variabelen.
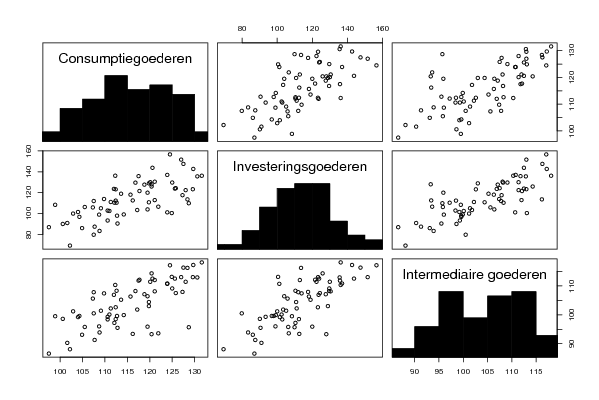
Vervolgens in de Matrix worden de correlaties weergeven aan de hand van koppels. De derde dimensie is hier dus weggelaten, en kan dus een beetje voor een vertekend beeld zorgen. Op hoofddiagonaal kan je het histogram zien van elke tijdreeks. Hier zijn correlaties onderling duidelijk zichtbaar.
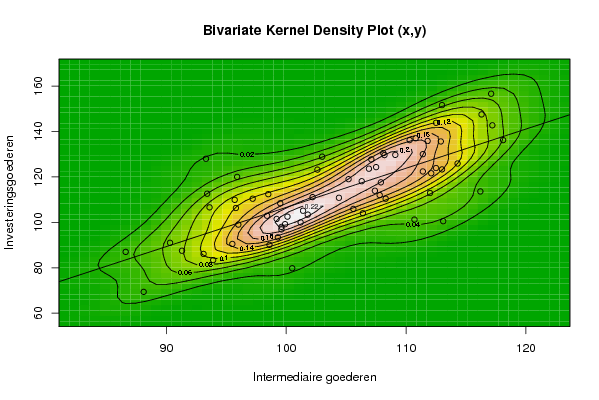
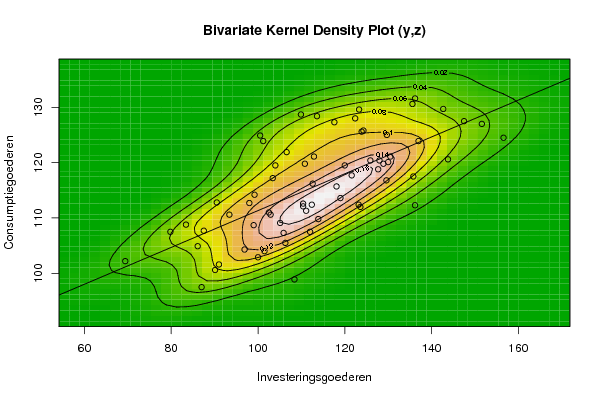
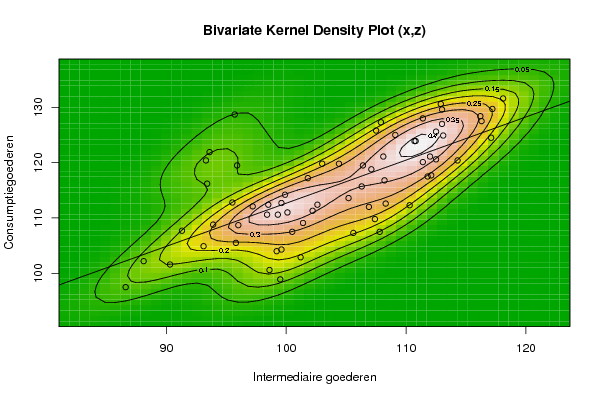
Tenslotte heb je ook nog de Bivariate Kernell Density Plots. Hier wordt de derde dimensie weergeven door hoogtelijnen.
2008-11-20 15:38:23 [Bas van Keken] [reply
In de 'kubussen' kan in dit geval met een beetje ruimtelijke fantasie een stijgende rechte worden getrokken, welk bij elke doorsnede later tweedimensionaal (2-d) wordt bevestigd. Ook zijn in de density plots geen losse groepen data te onderscheiden.
2008-11-20 21:54:02 [Olivier Uyttendaele] [reply
In dit model vind je 3 soorten grafieken, de kubussen, een matrix en bivariate density plots.
Bij de kubussen moet echter wel opletten bij de visuele interpretatie.

Zij geven ons een verkeerd beeld, er is niet echt een duidelijk patroon te zien. Dit is logisch aangezien het een 3D figuur betreft die op een 2D scherm wordt geprojecteerd. Je kan niet zien hoe de afstand tussen de punten zich verhoudt. De punten worden meer op 1 lijn geprojecteerd (2D scherm).

In de matrix daaronder krijg je dan een projectie van de kubussen (scatterplots), deze kunnen wederom een verkeerd beeld geven aangezien je nog een dimensie moet toevoegen. Op de hoofddiagonaal staan de histogrammen.

Uit de bovenstaande scatterplots wordt dan een bivariate Kernel density plot getekend.
Hier wordt wederom zoals bij Q1 gewerkt met hoogtelijnen die punten met een zelfde dichtheid gaan verbinden. Aangezien je hier duidelijk clusters kunt waarnemen, geeft dit plot meer en duidelijkere info dan een scatterplot & correlatie.
2008-11-24 19:36:33 [Steven Hulsmans] [reply
De kubussen kunnen wel een vertekend beeld geven. Punten die dicht bij mekaar liggen, kunnen in werkelijkheid heel ver uit mekaar liggen.Hieruit kunnen we de correlaties afleiden.

Post a new message
Dataseries X:
99.3
99.2
108.3
105.6
99.5
107.4
93.1
88.1
110.7
113.1
99.6
93.6
98.6
99.6
114.3
107.8
101.2
112.5
100.5
93.9
116.2
112
106.4
95.7
96
95.8
103
102.2
98.4
111.4
86.6
91.3
107.9
101.8
104.4
93.4
100.1
98.5
112.9
101.4
107.1
110.8
90.3
95.5
111.4
113
107.5
95.9
106.3
105.2
117.2
106.9
108.2
113
97.2
99.9
108.1
118.1
109.1
93.3
112.1
111.8
112.5
116.3
110.3
117.1
102.6
Dataseries Y:
93.4
101.5
110.4
105.9
108.4
113.9
86.1
69.4
101.2
100.5
98
106.6
90.1
96.9
125.9
112
100
123.9
79.8
83.4
113.6
112.9
104
109.9
99
106.3
128.9
111.1
102.9
130
87
87.5
117.6
103.4
110.8
112.6
102.5
112.4
135.6
105.1
127.7
137
91
90.5
122.4
123.3
124.3
120
118.1
119
142.7
123.6
129.6
151.6
110.4
99.2
130.5
136.2
129.7
128
121.6
135.8
143.8
147.5
136.2
156.6
123.2
Dataseries Z:
110.6
104
112.6
107.3
98.9
109.8
104.9
102.2
123.9
124.9
112.7
121.9
100.6
104.3
120.4
107.5
102.9
125.6
107.5
108.8
128.4
121.1
119.5
128.7
108.7
105.5
119.8
111.3
110.6
120.1
97.5
107.7
127.3
117.2
119.8
116.2
111
112.4
130.6
109.1
118.8
123.9
101.6
112.8
128
129.6
125.8
119.5
115.7
113.6
129.7
112
116.8
127
112.1
114.2
121.1
131.6
125
120.4
117.7
117.5
120.6
127.5
112.3
124.5
112.4


Summary of computational transaction
Raw Inputview raw input (R code)
Raw Outputview raw output of R engine
Computing time5 seconds
R Server'George Udny Yule' @ 72.249.76.132

\begin{tabular}{lllllllll}
\hline
Summary of computational transaction \tabularnewline
Raw Input & view raw input (R code)  \tabularnewline
Raw Output & view raw output of R engine  \tabularnewline
Computing time & 5 seconds \tabularnewline
R Server & 'George Udny Yule' @ 72.249.76.132 \tabularnewline
\hline
\end{tabular}
%Source: https://freestatistics.org/blog/index.php?pk=23074&T=0

[TABLE]
[ROW][C]Summary of computational transaction[/C][/ROW]
[ROW][C]Raw Input[/C][C]view raw input (R code) [/C][/ROW]
[ROW][C]Raw Output[/C][C]view raw output of R engine [/C][/ROW]
[ROW][C]Computing time[/C][C]5 seconds[/C][/ROW]
[ROW][C]R Server[/C][C]'George Udny Yule' @ 72.249.76.132[/C][/ROW]
[/TABLE]
Source: https://freestatistics.org/blog/index.php?pk=23074&T=0

Globally Unique Identifier (entire table): ba.freestatistics.org/blog/index.php?pk=23074&T=0

As an alternative you can also use a QR Code:  

The GUIDs for individual cells are displayed in the table below:

Summary of computational transaction
Raw Inputview raw input (R code)
Raw Outputview raw output of R engine
Computing time5 seconds
R Server'George Udny Yule' @ 72.249.76.132


Parameters (Session):
par1 = 50 ; par2 = 50 ; par3 = Y ; par4 = Y ; par5 = Intermediaire goederen ; par6 = Investeringsgoederen ; par7 = Consumptiegoederen ;
Parameters (R input):
par1 = 50 ; par2 = 50 ; par3 = Y ; par4 = Y ; par5 = Intermediaire goederen ; par6 = Investeringsgoederen ; par7 = Consumptiegoederen ;
R code (references can be found in the software module):
x <- array(x,dim=c(length(x),1))
colnames(x) <- par5
y <- array(y,dim=c(length(y),1))
colnames(y) <- par6
z <- array(z,dim=c(length(z),1))
colnames(z) <- par7
d <- data.frame(cbind(z,y,x))
colnames(d) <- list(par7,par6,par5)
par1 <- as.numeric(par1)
par2 <- as.numeric(par2)
if (par1>500) par1 <- 500
if (par2>500) par2 <- 500
if (par1<10) par1 <- 10
if (par2<10) par2 <- 10
library(GenKern)
library(lattice)
panel.hist <- function(x, ...)
{
usr <- par('usr'); on.exit(par(usr))
par(usr = c(usr[1:2], 0, 1.5) )
h <- hist(x, plot = FALSE)
breaks <- h$breaks; nB <- length(breaks)
y <- h$counts; y <- y/max(y)
rect(breaks[-nB], 0, breaks[-1], y, col='black', ...)
}
bitmap(file='cloud1.png')
cloud(z~x*y, screen = list(x=-45, y=45, z=35),xlab=par5,ylab=par6,zlab=par7)
dev.off()
bitmap(file='cloud2.png')
cloud(z~x*y, screen = list(x=35, y=45, z=25),xlab=par5,ylab=par6,zlab=par7)
dev.off()
bitmap(file='cloud3.png')
cloud(z~x*y, screen = list(x=35, y=-25, z=90),xlab=par5,ylab=par6,zlab=par7)
dev.off()
bitmap(file='pairs.png')
pairs(d,diag.panel=panel.hist)
dev.off()
x <- as.vector(x)
y <- as.vector(y)
z <- as.vector(z)
bitmap(file='bidensity1.png')
op <- KernSur(x,y, xgridsize=par1, ygridsize=par2, correlation=cor(x,y), xbandwidth=dpik(x), ybandwidth=dpik(y))
image(op$xords, op$yords, op$zden, col=terrain.colors(100), axes=TRUE,main='Bivariate Kernel Density Plot (x,y)',xlab=par5,ylab=par6)
if (par3=='Y') contour(op$xords, op$yords, op$zden, add=TRUE)
if (par4=='Y') points(x,y)
(r<-lm(y ~ x))
abline(r)
box()
dev.off()
bitmap(file='bidensity2.png')
op <- KernSur(y,z, xgridsize=par1, ygridsize=par2, correlation=cor(y,z), xbandwidth=dpik(y), ybandwidth=dpik(z))
op
image(op$xords, op$yords, op$zden, col=terrain.colors(100), axes=TRUE,main='Bivariate Kernel Density Plot (y,z)',xlab=par6,ylab=par7)
if (par3=='Y') contour(op$xords, op$yords, op$zden, add=TRUE)
if (par4=='Y') points(y,z)
(r<-lm(z ~ y))
abline(r)
box()
dev.off()
bitmap(file='bidensity3.png')
op <- KernSur(x,z, xgridsize=par1, ygridsize=par2, correlation=cor(x,z), xbandwidth=dpik(x), ybandwidth=dpik(z))
op
image(op$xords, op$yords, op$zden, col=terrain.colors(100), axes=TRUE,main='Bivariate Kernel Density Plot (x,z)',xlab=par5,ylab=par7)
if (par3=='Y') contour(op$xords, op$yords, op$zden, add=TRUE)
if (par4=='Y') points(x,z)
(r<-lm(z ~ x))
abline(r)
box()
dev.off()