Free Statistics

of Irreproducible Research!

Author's title

Author*Unverified author*
R Software Modulerwasp_cloud.wasp
Title produced by softwareTrivariate Scatterplots
Date of computationMon, 10 Nov 2008 06:25:14 -0700
Cite this page as followsStatistical Computations at FreeStatistics.org, Office for Research Development and Education, URL https://freestatistics.org/blog/index.php?v=date/2008/Nov/10/t122632359499eghh7qez2hwcx.htm/, Retrieved Sun, 19 May 2024 10:22:20 +0000
Statistical Computations at FreeStatistics.org, Office for Research Development and Education, URL https://freestatistics.org/blog/index.php?pk=23039, Retrieved Sun, 19 May 2024 10:22:20 +0000
QR Codes:

Original text written by user:
IsPrivate?No (this computation is public)
User-defined keywordstrivariate scatterplots Q1
Estimated Impact168
Family? (F = Feedback message, R = changed R code, M = changed R Module, P = changed Parameters, D = changed Data)
F       [Trivariate Scatterplots] [trivariate scatte...] [2008-11-10 13:25:14] [d8c5724db236abb5950452133b88474d] [Current]
Feedback Forum
2008-11-14 17:30:54 [Kevin Neelen] [reply
Hier wordt er gebruikt gemaakt van het Bivariate Scatterplot.
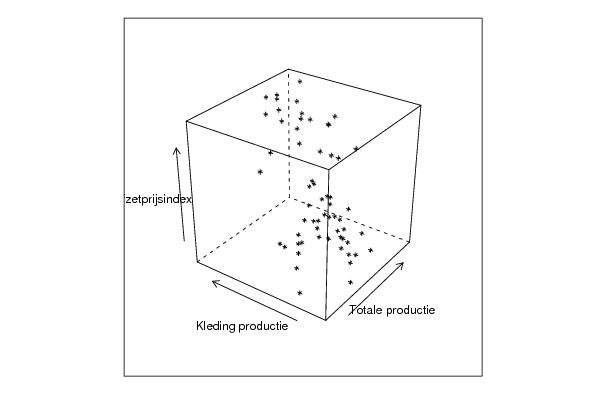
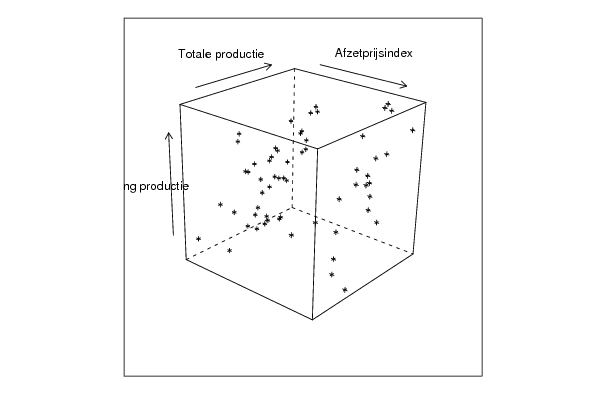
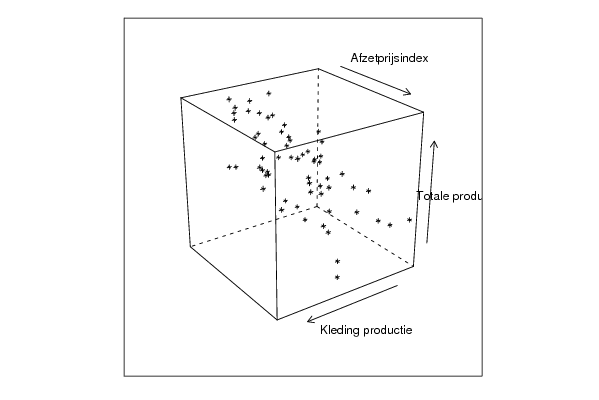
Als we de verschillende kubussen bestuderen, zien we dat er altijd een vertekend beeld wordt gegeven welk perspectief je ook kiest (aangezien een 3D-weergave hier in 2D moet worden weergegeven).
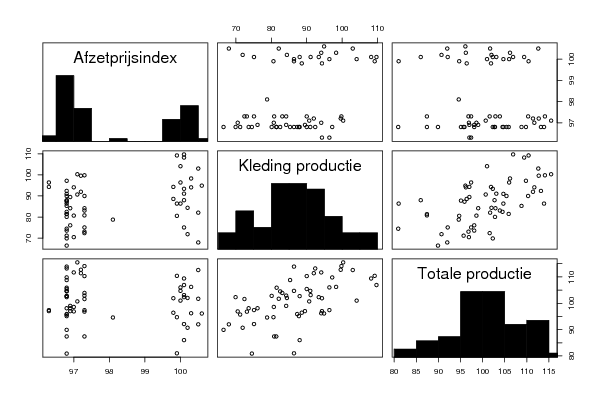
Daarnaast zien we ook hstogrammen van de drie tijdreeksen waarbij rechtsboven scatterplots staan voor 2-tot-2-combinaties. Deze geeft zeker niet alle informatie weer aangezien hier de derde dimense wordt weggelaten.

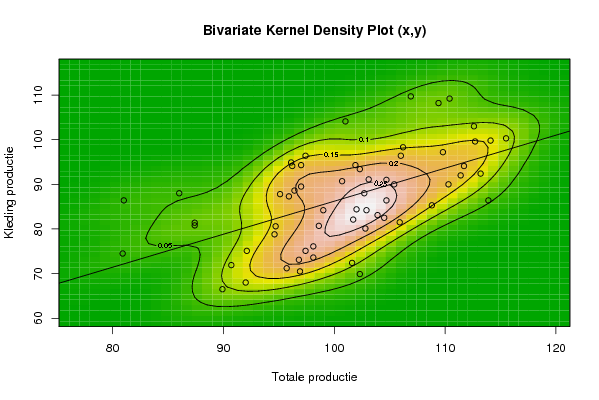
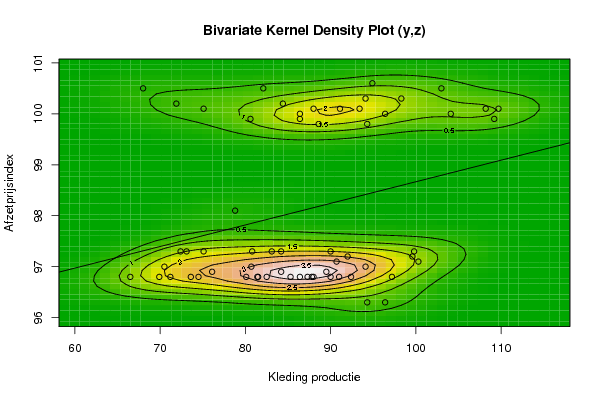
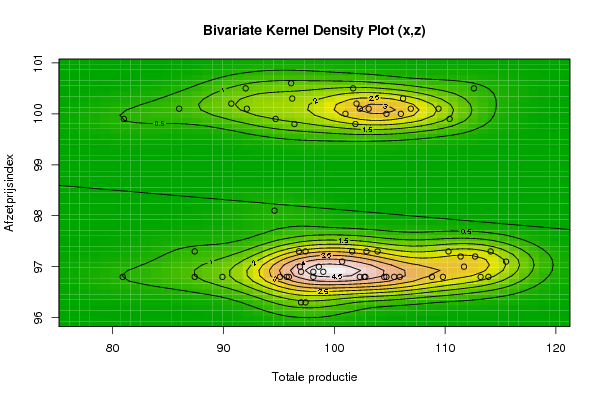
Als we de scatterplots bekijken, kunnen we inderdaad besluiten dat het verband tussen kledingproductie en totale productie het grootst is aangezien we hier het beste een rechte kunnen trekken van links onder naar rechts boven wat betekent dat de correaltie het hoogste is (evenals het bestaande verband tussen beide reeksen). Dezlefde conclusie kunnen we trekken als we kijken naar de Bivariate Kernel Density Plots. Bij de 2 andere grafieken van het Bivariate Kerbel Density zien we dat de gegevens uiteenvallen in twee clusters.
2008-11-17 20:17:39 [Kevin Engels] [reply
Het antwoord en de berekening van de student zijn correct.
2008-11-20 14:01:46 [Julie Leurentop] [reply
De eerste student geeft inderdaad een goede samenvatting van het correcte besluit.
2008-11-21 09:35:46 [90714a39acc78a7b2ecd294ecc6b2864] [reply
De Trivariate Scatterplot geeft een 3D figuur weer op een 2D scherm. Het is moeilijk om inzicht te krijgen in de structuur van de data. De 2D scatterplot geeft een vertekend beeld weer. Het beste verband bestaat tussen de kledingproductie en de totale productie omdat er min of meer een stijgende rechte is te trekken door de waarden.

De onderste van de twee Bivariate Kernel Density Plots geeft duidelijk weer dat er een verband bestaat tussen de kledingproductie en de totale productie aangezien er zich een cluster vormt.
2008-11-21 11:13:32 [Stijn Van de Velde] [reply
Het voordeel is hier dat we 3 reeksen tegelijk met elkaar kunnen vergelijken, en dit niet zoals bij de Bivariate Kernel Density een voor een moeten gaan doen.

Eerst en vooral krijgen we 3D kubussen te zien. Hieruit kunnen we echter weinig conclusies trekken, aangezien deze kubussen op een 2D scherm worden weer gegeven en zo voor een vertekend beeld zorgen. Van uit welke we hoek we ook kijken, het blijft gevaarlijk om op deze manier besluiten te nemen.

Als oplossing daarvoor kijgen we de Bivariate Kernel Density Plot grafieken. Deze grafiek vermijd het probleem door te werken met hoogtelijnen. De hoogste punten, die waar de dichtheid van de data het grootste is, krijgen dan een wit/roze kleur. De groene kleuren duiden op gebieden zonder enige dichtheid.

We zien dan dat het verband tussen kledingproductie en totale productie het grootst is aangezien we hier kunnen spreken van een positief lineair verband. Alle punten, op enkele ouliers na, lijken ook in hetzelfde cluster te liggen.
Dat kunnen we ook zien op de grafiek met de 9 vakjes.
De 2 andere verbanden lijken uiteen te vallen in 2 clusters.
2008-11-23 16:05:06 [Karen Van den Broeck] [reply
De student heeft het hier bij het rechte eind. Het verband tussen de totale productie en de kledingproductie is inderdaad het grootst.

Post a new message
Dataseries X:
110,40
96,40
101,90
106,20
81,00
94,70
101,00
109,40
102,30
90,70
96,20
96,10
106,00
103,10
102,00
104,70
86,00
92,10
106,90
112,60
101,70
92,00
97,40
97,00
105,40
102,70
98,10
104,50
87,40
89,90
109,80
111,70
98,60
96,90
95,10
97,00
112,70
102,90
97,40
111,40
87,40
96,80
114,10
110,30
103,90
101,60
94,60
95,90
104,70
102,80
98,10
113,90
80,90
95,70
113,20
105,90
108,80
102,30
99,00
100,70
115,50
Dataseries Y:
109,20
88,60
94,30
98,30
86,40
80,60
104,10
108,20
93,40
71,90
94,10
94,90
96,40
91,10
84,40
86,40
88,00
75,10
109,70
103,00
82,10
68,00
96,40
94,30
90,00
88,00
76,10
82,50
81,40
66,50
97,20
94,10
80,70
70,50
87,80
89,50
99,60
84,20
75,10
92,00
80,80
73,10
99,80
90,00
83,10
72,40
78,80
87,30
91,00
80,10
73,60
86,40
74,50
71,20
92,40
81,50
85,30
69,90
84,20
90,70
100,30
Dataseries Z:
99,90
99,80
99,80
100,30
99,90
99,90
100,00
100,10
100,10
100,20
100,30
100,60
100,00
100,10
100,20
100,00
100,10
100,10
100,10
100,50
100,50
100,50
96,30
96,30
96,80
96,80
96,90
96,80
96,80
96,80
96,80
97,00
97,00
97,00
96,80
96,90
97,20
97,30
97,30
97,20
97,30
97,30
97,30
97,30
97,30
97,30
98,10
96,80
96,80
96,80
96,80
96,80
96,80
96,80
96,80
96,80
96,80
96,80
96,90
97,10
97,10


Summary of computational transaction
Raw Inputview raw input (R code)
Raw Outputview raw output of R engine
Computing time5 seconds
R Server'Sir Ronald Aylmer Fisher' @ 193.190.124.24

\begin{tabular}{lllllllll}
\hline
Summary of computational transaction \tabularnewline
Raw Input & view raw input (R code)  \tabularnewline
Raw Output & view raw output of R engine  \tabularnewline
Computing time & 5 seconds \tabularnewline
R Server & 'Sir Ronald Aylmer Fisher' @ 193.190.124.24 \tabularnewline
\hline
\end{tabular}
%Source: https://freestatistics.org/blog/index.php?pk=23039&T=0

[TABLE]
[ROW][C]Summary of computational transaction[/C][/ROW]
[ROW][C]Raw Input[/C][C]view raw input (R code) [/C][/ROW]
[ROW][C]Raw Output[/C][C]view raw output of R engine [/C][/ROW]
[ROW][C]Computing time[/C][C]5 seconds[/C][/ROW]
[ROW][C]R Server[/C][C]'Sir Ronald Aylmer Fisher' @ 193.190.124.24[/C][/ROW]
[/TABLE]
Source: https://freestatistics.org/blog/index.php?pk=23039&T=0

Globally Unique Identifier (entire table): ba.freestatistics.org/blog/index.php?pk=23039&T=0

As an alternative you can also use a QR Code:  

The GUIDs for individual cells are displayed in the table below:

Summary of computational transaction
Raw Inputview raw input (R code)
Raw Outputview raw output of R engine
Computing time5 seconds
R Server'Sir Ronald Aylmer Fisher' @ 193.190.124.24


Parameters (Session):
par1 = 50 ; par2 = 50 ; par3 = Y ; par4 = Y ; par5 = Totale productie ; par6 = Kleding productie ; par7 = Afzetprijsindex ;
Parameters (R input):
par1 = 50 ; par2 = 50 ; par3 = Y ; par4 = Y ; par5 = Totale productie ; par6 = Kleding productie ; par7 = Afzetprijsindex ;
R code (references can be found in the software module):
x <- array(x,dim=c(length(x),1))
colnames(x) <- par5
y <- array(y,dim=c(length(y),1))
colnames(y) <- par6
z <- array(z,dim=c(length(z),1))
colnames(z) <- par7
d <- data.frame(cbind(z,y,x))
colnames(d) <- list(par7,par6,par5)
par1 <- as.numeric(par1)
par2 <- as.numeric(par2)
if (par1>500) par1 <- 500
if (par2>500) par2 <- 500
if (par1<10) par1 <- 10
if (par2<10) par2 <- 10
library(GenKern)
library(lattice)
panel.hist <- function(x, ...)
{
usr <- par('usr'); on.exit(par(usr))
par(usr = c(usr[1:2], 0, 1.5) )
h <- hist(x, plot = FALSE)
breaks <- h$breaks; nB <- length(breaks)
y <- h$counts; y <- y/max(y)
rect(breaks[-nB], 0, breaks[-1], y, col='black', ...)
}
bitmap(file='cloud1.png')
cloud(z~x*y, screen = list(x=-45, y=45, z=35),xlab=par5,ylab=par6,zlab=par7)
dev.off()
bitmap(file='cloud2.png')
cloud(z~x*y, screen = list(x=35, y=45, z=25),xlab=par5,ylab=par6,zlab=par7)
dev.off()
bitmap(file='cloud3.png')
cloud(z~x*y, screen = list(x=35, y=-25, z=90),xlab=par5,ylab=par6,zlab=par7)
dev.off()
bitmap(file='pairs.png')
pairs(d,diag.panel=panel.hist)
dev.off()
x <- as.vector(x)
y <- as.vector(y)
z <- as.vector(z)
bitmap(file='bidensity1.png')
op <- KernSur(x,y, xgridsize=par1, ygridsize=par2, correlation=cor(x,y), xbandwidth=dpik(x), ybandwidth=dpik(y))
image(op$xords, op$yords, op$zden, col=terrain.colors(100), axes=TRUE,main='Bivariate Kernel Density Plot (x,y)',xlab=par5,ylab=par6)
if (par3=='Y') contour(op$xords, op$yords, op$zden, add=TRUE)
if (par4=='Y') points(x,y)
(r<-lm(y ~ x))
abline(r)
box()
dev.off()
bitmap(file='bidensity2.png')
op <- KernSur(y,z, xgridsize=par1, ygridsize=par2, correlation=cor(y,z), xbandwidth=dpik(y), ybandwidth=dpik(z))
op
image(op$xords, op$yords, op$zden, col=terrain.colors(100), axes=TRUE,main='Bivariate Kernel Density Plot (y,z)',xlab=par6,ylab=par7)
if (par3=='Y') contour(op$xords, op$yords, op$zden, add=TRUE)
if (par4=='Y') points(y,z)
(r<-lm(z ~ y))
abline(r)
box()
dev.off()
bitmap(file='bidensity3.png')
op <- KernSur(x,z, xgridsize=par1, ygridsize=par2, correlation=cor(x,z), xbandwidth=dpik(x), ybandwidth=dpik(z))
op
image(op$xords, op$yords, op$zden, col=terrain.colors(100), axes=TRUE,main='Bivariate Kernel Density Plot (x,z)',xlab=par5,ylab=par7)
if (par3=='Y') contour(op$xords, op$yords, op$zden, add=TRUE)
if (par4=='Y') points(x,z)
(r<-lm(z ~ x))
abline(r)
box()
dev.off()