Free Statistics

of Irreproducible Research!

Author's title

Author*The author of this computation has been verified*
R Software Modulerwasp_hierarchicalclustering.wasp
Title produced by softwareHierarchical Clustering
Date of computationMon, 10 Nov 2008 06:18:47 -0700
Cite this page as followsStatistical Computations at FreeStatistics.org, Office for Research Development and Education, URL https://freestatistics.org/blog/index.php?v=date/2008/Nov/10/t1226323168ugn89rgr8ten9dw.htm/, Retrieved Sun, 19 May 2024 08:56:38 +0000
Statistical Computations at FreeStatistics.org, Office for Research Development and Education, URL https://freestatistics.org/blog/index.php?pk=23034, Retrieved Sun, 19 May 2024 08:56:38 +0000
QR Codes:

Original text written by user:
IsPrivate?No (this computation is public)
User-defined keywords
Estimated Impact164
Family? (F = Feedback message, R = changed R code, M = changed R Module, P = changed Parameters, D = changed Data)
F       [Hierarchical Clustering] [Hierachical] [2008-11-10 13:18:47] [6fc58909ffe15c247a4f6748c8841ab4] [Current]
Feedback Forum
2008-11-24 11:44:58 [Lindsay Heyndrickx] [reply
Dit is een goede uitleg maar deze methode is niet zo efficiënt voor tijdreeksen.
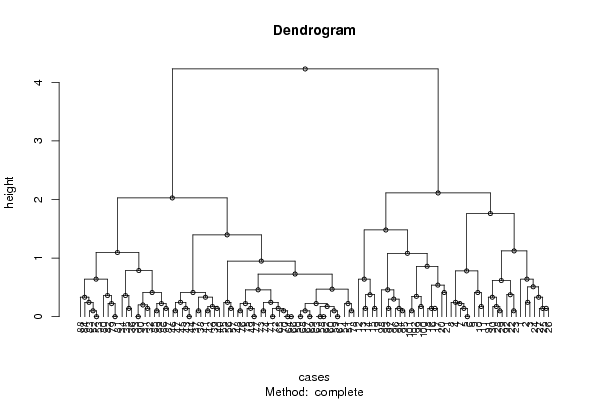
Hier worden de maanden horizontaal weergegeven hier staat bij welke puntjes als gemeenschappelijk beschouwd kunnen worden. De punten vallen uit elkaar in twee takken dit is het verschil tussen de eerste 12 maanden en de maanden die daarop volgen. Dit is niet zo een goede methode om te gebruiken op tijdreeksen. Dit word meer gebruikt in de marketing.

Post a new message
Dataseries X:
7.4	6.2	9.0
7.2	6.1	8.8
7.1	5.9	8.7
6.9	5.6	8.7
6.8	5.5	8.6
6.8	5.5	8.6
6.8	5.6	8.5
6.9	5.7	8.5
6.7	5.6	8.3
6.6	5.4	8.2
6.5	5.3	8.1
6.4	5.3	7.8
6.3	5.4	7.5
6.3	5.5	7.4
6.3	5.6	7.3
6.5	5.7	7.7
6.6	5.8	7.7
6.5	5.8	7.6
6.4	5.7	7.3
6.5	5.9	7.2
6.7	6.1	7.5
7.1	6.4	8.0
7.1	6.4	8.1
7.2	6.3	8.4
7.2	6.2	8.6
7.3	6.2	8.7
7.3	6.3	8.6
7.3	6.5	8.4
7.3	6.6	8.4
7.4	6.6	8.5
7.6	6.7	8.9
7.6	6.6	8.8
7.6	6.7	8.7
7.7	7.0	8.6
7.8	7.2	8.6
7.9	7.3	8.6
8.1	7.5	8.8
8.1	7.6	8.8
8.1	7.7	8.8
8.2	7.8	8.8
8.2	7.8	8.7
8.2	7.7	8.7
8.2	7.6	8.9
8.2	7.6	8.9
8.2	7.7	9.0
8.3	7.8	8.9
8.3	7.8	9.0
8.4	7.8	9.1
8.4	7.7	9.3
8.4	7.6	9.4
8.3	7.4	9.4
8.0	7.1	9.2
8.0	7.1	9.2
8.2	7.3	9.4
8.6	7.6	9.9
8.7	7.8	10.0
8.7	7.7	9.9
8.5	7.6	9.6
8.4	7.5	9.5
8.4	7.5	9.6
8.4	7.5	9.5
8.5	7.6	9.6
8.5	7.6	9.6
8.5	7.7	9.5
8.5	7.8	9.5
8.5	7.7	9.5
8.4	7.6	9.5
8.4	7.6	9.4
8.4	7.6	9.5
8.5	7.7	9.5
8.6	7.8	9.5
8.6	7.8	9.5
8.6	7.9	9.5
8.6	7.9	9.4
8.5	7.8	9.3
8.4	7.8	9.2
8.4	7.7	9.3
8.3	7.5	9.4
8.2	7.1	9.5
8.1	6.9	9.6
8.2	7.1	9.5
8.1	7.1	9.3
8.0	7.1	9.1
7.9	7.0	9.0
7.8	6.9	9.0
7.7	6.8	8.9
7.7	6.7	9.0
7.9	6.8	9.2
7.8	6.8	9.0
7.6	6.7	8.7
7.4	6.8	8.3
7.3	6.7	8.0
7.1	6.6	7.7
7.1	6.4	7.9
7.0	6.4	7.9
7.0	6.4	7.8
7.0	6.5	7.7
6.9	6.5	7.5
6.8	6.4	7.3
6.7	6.3	7.2
6.6	6.2	7.1
6.6	6.3	7.1


Summary of computational transaction
Raw Inputview raw input (R code)
Raw Outputview raw output of R engine
Computing time2 seconds
R Server'Gwilym Jenkins' @ 72.249.127.135

\begin{tabular}{lllllllll}
\hline
Summary of computational transaction \tabularnewline
Raw Input & view raw input (R code)  \tabularnewline
Raw Output & view raw output of R engine  \tabularnewline
Computing time & 2 seconds \tabularnewline
R Server & 'Gwilym Jenkins' @ 72.249.127.135 \tabularnewline
\hline
\end{tabular}
%Source: https://freestatistics.org/blog/index.php?pk=23034&T=0

[TABLE]
[ROW][C]Summary of computational transaction[/C][/ROW]
[ROW][C]Raw Input[/C][C]view raw input (R code) [/C][/ROW]
[ROW][C]Raw Output[/C][C]view raw output of R engine [/C][/ROW]
[ROW][C]Computing time[/C][C]2 seconds[/C][/ROW]
[ROW][C]R Server[/C][C]'Gwilym Jenkins' @ 72.249.127.135[/C][/ROW]
[/TABLE]
Source: https://freestatistics.org/blog/index.php?pk=23034&T=0

Globally Unique Identifier (entire table): ba.freestatistics.org/blog/index.php?pk=23034&T=0

As an alternative you can also use a QR Code:  

The GUIDs for individual cells are displayed in the table below:

Summary of computational transaction
Raw Inputview raw input (R code)
Raw Outputview raw output of R engine
Computing time2 seconds
R Server'Gwilym Jenkins' @ 72.249.127.135


Summary of Dendrogram
LabelHeight
10
20
30
40
50
60
70
80
90
100
110
120
130
140
150.0999999999999996
160.0999999999999996
170.0999999999999996
180.0999999999999996
190.0999999999999996
200.0999999999999996
210.0999999999999996
220.0999999999999996
230.0999999999999996
240.0999999999999996
250.0999999999999996
260.0999999999999996
270.0999999999999996
280.0999999999999996
290.100000000000001
300.141421356237309
310.141421356237309
320.141421356237309
330.141421356237309
340.141421356237309
350.141421356237309
360.141421356237309
370.141421356237309
380.141421356237309
390.141421356237309
400.141421356237309
410.141421356237310
420.141421356237310
430.141421356237310
440.141421356237310
450.141421356237310
460.141421356237310
470.173205080756887
480.173205080756888
490.173205080756888
500.173205080756888
510.173205080756888
520.200000000000001
530.223606797749978
540.223606797749978
550.223606797749979
560.223606797749979
570.223606797749980
580.223606797749980
590.244948974278317
600.244948974278318
610.244948974278318
620.244948974278318
630.244948974278318
640.244948974278318
650.300000000000000
660.331662479035539
670.331662479035540
680.33166247903554
690.33166247903554
700.346410161513776
710.360555127546398
720.360555127546399
730.374165738677394
740.374165738677394
750.412310562561766
760.412310562561766
770.412310562561767
780.412310562561767
790.458257569495584
800.458257569495584
810.469041575982343
820.509901951359278
830.53851648071345
840.616441400296898
850.640312423743284
860.640312423743285
870.640312423743285
880.728010988928052
890.781024967590665
900.787400787401182
910.860232526704263
920.948683298050514
931.08166538263920
941.09544511501033
951.12249721603218
961.39642400437689
971.47986485869487
981.7606816861659
992.02731349327133
1002.11187120819429
1014.22965719651132

\begin{tabular}{lllllllll}
\hline
Summary of Dendrogram \tabularnewline
Label & Height \tabularnewline
1 & 0 \tabularnewline
2 & 0 \tabularnewline
3 & 0 \tabularnewline
4 & 0 \tabularnewline
5 & 0 \tabularnewline
6 & 0 \tabularnewline
7 & 0 \tabularnewline
8 & 0 \tabularnewline
9 & 0 \tabularnewline
10 & 0 \tabularnewline
11 & 0 \tabularnewline
12 & 0 \tabularnewline
13 & 0 \tabularnewline
14 & 0 \tabularnewline
15 & 0.0999999999999996 \tabularnewline
16 & 0.0999999999999996 \tabularnewline
17 & 0.0999999999999996 \tabularnewline
18 & 0.0999999999999996 \tabularnewline
19 & 0.0999999999999996 \tabularnewline
20 & 0.0999999999999996 \tabularnewline
21 & 0.0999999999999996 \tabularnewline
22 & 0.0999999999999996 \tabularnewline
23 & 0.0999999999999996 \tabularnewline
24 & 0.0999999999999996 \tabularnewline
25 & 0.0999999999999996 \tabularnewline
26 & 0.0999999999999996 \tabularnewline
27 & 0.0999999999999996 \tabularnewline
28 & 0.0999999999999996 \tabularnewline
29 & 0.100000000000001 \tabularnewline
30 & 0.141421356237309 \tabularnewline
31 & 0.141421356237309 \tabularnewline
32 & 0.141421356237309 \tabularnewline
33 & 0.141421356237309 \tabularnewline
34 & 0.141421356237309 \tabularnewline
35 & 0.141421356237309 \tabularnewline
36 & 0.141421356237309 \tabularnewline
37 & 0.141421356237309 \tabularnewline
38 & 0.141421356237309 \tabularnewline
39 & 0.141421356237309 \tabularnewline
40 & 0.141421356237309 \tabularnewline
41 & 0.141421356237310 \tabularnewline
42 & 0.141421356237310 \tabularnewline
43 & 0.141421356237310 \tabularnewline
44 & 0.141421356237310 \tabularnewline
45 & 0.141421356237310 \tabularnewline
46 & 0.141421356237310 \tabularnewline
47 & 0.173205080756887 \tabularnewline
48 & 0.173205080756888 \tabularnewline
49 & 0.173205080756888 \tabularnewline
50 & 0.173205080756888 \tabularnewline
51 & 0.173205080756888 \tabularnewline
52 & 0.200000000000001 \tabularnewline
53 & 0.223606797749978 \tabularnewline
54 & 0.223606797749978 \tabularnewline
55 & 0.223606797749979 \tabularnewline
56 & 0.223606797749979 \tabularnewline
57 & 0.223606797749980 \tabularnewline
58 & 0.223606797749980 \tabularnewline
59 & 0.244948974278317 \tabularnewline
60 & 0.244948974278318 \tabularnewline
61 & 0.244948974278318 \tabularnewline
62 & 0.244948974278318 \tabularnewline
63 & 0.244948974278318 \tabularnewline
64 & 0.244948974278318 \tabularnewline
65 & 0.300000000000000 \tabularnewline
66 & 0.331662479035539 \tabularnewline
67 & 0.331662479035540 \tabularnewline
68 & 0.33166247903554 \tabularnewline
69 & 0.33166247903554 \tabularnewline
70 & 0.346410161513776 \tabularnewline
71 & 0.360555127546398 \tabularnewline
72 & 0.360555127546399 \tabularnewline
73 & 0.374165738677394 \tabularnewline
74 & 0.374165738677394 \tabularnewline
75 & 0.412310562561766 \tabularnewline
76 & 0.412310562561766 \tabularnewline
77 & 0.412310562561767 \tabularnewline
78 & 0.412310562561767 \tabularnewline
79 & 0.458257569495584 \tabularnewline
80 & 0.458257569495584 \tabularnewline
81 & 0.469041575982343 \tabularnewline
82 & 0.509901951359278 \tabularnewline
83 & 0.53851648071345 \tabularnewline
84 & 0.616441400296898 \tabularnewline
85 & 0.640312423743284 \tabularnewline
86 & 0.640312423743285 \tabularnewline
87 & 0.640312423743285 \tabularnewline
88 & 0.728010988928052 \tabularnewline
89 & 0.781024967590665 \tabularnewline
90 & 0.787400787401182 \tabularnewline
91 & 0.860232526704263 \tabularnewline
92 & 0.948683298050514 \tabularnewline
93 & 1.08166538263920 \tabularnewline
94 & 1.09544511501033 \tabularnewline
95 & 1.12249721603218 \tabularnewline
96 & 1.39642400437689 \tabularnewline
97 & 1.47986485869487 \tabularnewline
98 & 1.7606816861659 \tabularnewline
99 & 2.02731349327133 \tabularnewline
100 & 2.11187120819429 \tabularnewline
101 & 4.22965719651132 \tabularnewline
\hline
\end{tabular}
%Source: https://freestatistics.org/blog/index.php?pk=23034&T=1

[TABLE]
[ROW][C]Summary of Dendrogram[/C][/ROW]
[ROW][C]Label[/C][C]Height[/C][/ROW]
[ROW][C]1[/C][C]0[/C][/ROW]
[ROW][C]2[/C][C]0[/C][/ROW]
[ROW][C]3[/C][C]0[/C][/ROW]
[ROW][C]4[/C][C]0[/C][/ROW]
[ROW][C]5[/C][C]0[/C][/ROW]
[ROW][C]6[/C][C]0[/C][/ROW]
[ROW][C]7[/C][C]0[/C][/ROW]
[ROW][C]8[/C][C]0[/C][/ROW]
[ROW][C]9[/C][C]0[/C][/ROW]
[ROW][C]10[/C][C]0[/C][/ROW]
[ROW][C]11[/C][C]0[/C][/ROW]
[ROW][C]12[/C][C]0[/C][/ROW]
[ROW][C]13[/C][C]0[/C][/ROW]
[ROW][C]14[/C][C]0[/C][/ROW]
[ROW][C]15[/C][C]0.0999999999999996[/C][/ROW]
[ROW][C]16[/C][C]0.0999999999999996[/C][/ROW]
[ROW][C]17[/C][C]0.0999999999999996[/C][/ROW]
[ROW][C]18[/C][C]0.0999999999999996[/C][/ROW]
[ROW][C]19[/C][C]0.0999999999999996[/C][/ROW]
[ROW][C]20[/C][C]0.0999999999999996[/C][/ROW]
[ROW][C]21[/C][C]0.0999999999999996[/C][/ROW]
[ROW][C]22[/C][C]0.0999999999999996[/C][/ROW]
[ROW][C]23[/C][C]0.0999999999999996[/C][/ROW]
[ROW][C]24[/C][C]0.0999999999999996[/C][/ROW]
[ROW][C]25[/C][C]0.0999999999999996[/C][/ROW]
[ROW][C]26[/C][C]0.0999999999999996[/C][/ROW]
[ROW][C]27[/C][C]0.0999999999999996[/C][/ROW]
[ROW][C]28[/C][C]0.0999999999999996[/C][/ROW]
[ROW][C]29[/C][C]0.100000000000001[/C][/ROW]
[ROW][C]30[/C][C]0.141421356237309[/C][/ROW]
[ROW][C]31[/C][C]0.141421356237309[/C][/ROW]
[ROW][C]32[/C][C]0.141421356237309[/C][/ROW]
[ROW][C]33[/C][C]0.141421356237309[/C][/ROW]
[ROW][C]34[/C][C]0.141421356237309[/C][/ROW]
[ROW][C]35[/C][C]0.141421356237309[/C][/ROW]
[ROW][C]36[/C][C]0.141421356237309[/C][/ROW]
[ROW][C]37[/C][C]0.141421356237309[/C][/ROW]
[ROW][C]38[/C][C]0.141421356237309[/C][/ROW]
[ROW][C]39[/C][C]0.141421356237309[/C][/ROW]
[ROW][C]40[/C][C]0.141421356237309[/C][/ROW]
[ROW][C]41[/C][C]0.141421356237310[/C][/ROW]
[ROW][C]42[/C][C]0.141421356237310[/C][/ROW]
[ROW][C]43[/C][C]0.141421356237310[/C][/ROW]
[ROW][C]44[/C][C]0.141421356237310[/C][/ROW]
[ROW][C]45[/C][C]0.141421356237310[/C][/ROW]
[ROW][C]46[/C][C]0.141421356237310[/C][/ROW]
[ROW][C]47[/C][C]0.173205080756887[/C][/ROW]
[ROW][C]48[/C][C]0.173205080756888[/C][/ROW]
[ROW][C]49[/C][C]0.173205080756888[/C][/ROW]
[ROW][C]50[/C][C]0.173205080756888[/C][/ROW]
[ROW][C]51[/C][C]0.173205080756888[/C][/ROW]
[ROW][C]52[/C][C]0.200000000000001[/C][/ROW]
[ROW][C]53[/C][C]0.223606797749978[/C][/ROW]
[ROW][C]54[/C][C]0.223606797749978[/C][/ROW]
[ROW][C]55[/C][C]0.223606797749979[/C][/ROW]
[ROW][C]56[/C][C]0.223606797749979[/C][/ROW]
[ROW][C]57[/C][C]0.223606797749980[/C][/ROW]
[ROW][C]58[/C][C]0.223606797749980[/C][/ROW]
[ROW][C]59[/C][C]0.244948974278317[/C][/ROW]
[ROW][C]60[/C][C]0.244948974278318[/C][/ROW]
[ROW][C]61[/C][C]0.244948974278318[/C][/ROW]
[ROW][C]62[/C][C]0.244948974278318[/C][/ROW]
[ROW][C]63[/C][C]0.244948974278318[/C][/ROW]
[ROW][C]64[/C][C]0.244948974278318[/C][/ROW]
[ROW][C]65[/C][C]0.300000000000000[/C][/ROW]
[ROW][C]66[/C][C]0.331662479035539[/C][/ROW]
[ROW][C]67[/C][C]0.331662479035540[/C][/ROW]
[ROW][C]68[/C][C]0.33166247903554[/C][/ROW]
[ROW][C]69[/C][C]0.33166247903554[/C][/ROW]
[ROW][C]70[/C][C]0.346410161513776[/C][/ROW]
[ROW][C]71[/C][C]0.360555127546398[/C][/ROW]
[ROW][C]72[/C][C]0.360555127546399[/C][/ROW]
[ROW][C]73[/C][C]0.374165738677394[/C][/ROW]
[ROW][C]74[/C][C]0.374165738677394[/C][/ROW]
[ROW][C]75[/C][C]0.412310562561766[/C][/ROW]
[ROW][C]76[/C][C]0.412310562561766[/C][/ROW]
[ROW][C]77[/C][C]0.412310562561767[/C][/ROW]
[ROW][C]78[/C][C]0.412310562561767[/C][/ROW]
[ROW][C]79[/C][C]0.458257569495584[/C][/ROW]
[ROW][C]80[/C][C]0.458257569495584[/C][/ROW]
[ROW][C]81[/C][C]0.469041575982343[/C][/ROW]
[ROW][C]82[/C][C]0.509901951359278[/C][/ROW]
[ROW][C]83[/C][C]0.53851648071345[/C][/ROW]
[ROW][C]84[/C][C]0.616441400296898[/C][/ROW]
[ROW][C]85[/C][C]0.640312423743284[/C][/ROW]
[ROW][C]86[/C][C]0.640312423743285[/C][/ROW]
[ROW][C]87[/C][C]0.640312423743285[/C][/ROW]
[ROW][C]88[/C][C]0.728010988928052[/C][/ROW]
[ROW][C]89[/C][C]0.781024967590665[/C][/ROW]
[ROW][C]90[/C][C]0.787400787401182[/C][/ROW]
[ROW][C]91[/C][C]0.860232526704263[/C][/ROW]
[ROW][C]92[/C][C]0.948683298050514[/C][/ROW]
[ROW][C]93[/C][C]1.08166538263920[/C][/ROW]
[ROW][C]94[/C][C]1.09544511501033[/C][/ROW]
[ROW][C]95[/C][C]1.12249721603218[/C][/ROW]
[ROW][C]96[/C][C]1.39642400437689[/C][/ROW]
[ROW][C]97[/C][C]1.47986485869487[/C][/ROW]
[ROW][C]98[/C][C]1.7606816861659[/C][/ROW]
[ROW][C]99[/C][C]2.02731349327133[/C][/ROW]
[ROW][C]100[/C][C]2.11187120819429[/C][/ROW]
[ROW][C]101[/C][C]4.22965719651132[/C][/ROW]
[/TABLE]
Source: https://freestatistics.org/blog/index.php?pk=23034&T=1

Globally Unique Identifier (entire table): ba.freestatistics.org/blog/index.php?pk=23034&T=1

As an alternative you can also use a QR Code:  

The GUIDs for individual cells are displayed in the table below:

Summary of Dendrogram
LabelHeight
10
20
30
40
50
60
70
80
90
100
110
120
130
140
150.0999999999999996
160.0999999999999996
170.0999999999999996
180.0999999999999996
190.0999999999999996
200.0999999999999996
210.0999999999999996
220.0999999999999996
230.0999999999999996
240.0999999999999996
250.0999999999999996
260.0999999999999996
270.0999999999999996
280.0999999999999996
290.100000000000001
300.141421356237309
310.141421356237309
320.141421356237309
330.141421356237309
340.141421356237309
350.141421356237309
360.141421356237309
370.141421356237309
380.141421356237309
390.141421356237309
400.141421356237309
410.141421356237310
420.141421356237310
430.141421356237310
440.141421356237310
450.141421356237310
460.141421356237310
470.173205080756887
480.173205080756888
490.173205080756888
500.173205080756888
510.173205080756888
520.200000000000001
530.223606797749978
540.223606797749978
550.223606797749979
560.223606797749979
570.223606797749980
580.223606797749980
590.244948974278317
600.244948974278318
610.244948974278318
620.244948974278318
630.244948974278318
640.244948974278318
650.300000000000000
660.331662479035539
670.331662479035540
680.33166247903554
690.33166247903554
700.346410161513776
710.360555127546398
720.360555127546399
730.374165738677394
740.374165738677394
750.412310562561766
760.412310562561766
770.412310562561767
780.412310562561767
790.458257569495584
800.458257569495584
810.469041575982343
820.509901951359278
830.53851648071345
840.616441400296898
850.640312423743284
860.640312423743285
870.640312423743285
880.728010988928052
890.781024967590665
900.787400787401182
910.860232526704263
920.948683298050514
931.08166538263920
941.09544511501033
951.12249721603218
961.39642400437689
971.47986485869487
981.7606816861659
992.02731349327133
1002.11187120819429
1014.22965719651132


Parameters (Session):
par1 = complete ; par2 = ALL ; par3 = FALSE ; par4 = FALSE ;
Parameters (R input):
par1 = complete ; par2 = ALL ; par3 = FALSE ; par4 = FALSE ;
R code (references can be found in the software module):
par3 <- as.logical(par3)
par4 <- as.logical(par4)
if (par3 == 'TRUE'){
dum = xlab
xlab = ylab
ylab = dum
}
x <- t(y)
hc <- hclust(dist(x),method=par1)
d <- as.dendrogram(hc)
str(d)
mysub <- paste('Method: ',par1)
bitmap(file='test1.png')
if (par4 == 'TRUE'){
plot(d,main=main,ylab=ylab,xlab=xlab,horiz=par3, nodePar=list(pch = c(1,NA), cex=0.8, lab.cex = 0.8),type='t',center=T, sub=mysub)
} else {
plot(d,main=main,ylab=ylab,xlab=xlab,horiz=par3, nodePar=list(pch = c(1,NA), cex=0.8, lab.cex = 0.8), sub=mysub)
}
dev.off()
if (par2 != 'ALL'){
if (par3 == 'TRUE'){
ylab = 'cluster'
} else {
xlab = 'cluster'
}
par2 <- as.numeric(par2)
memb <- cutree(hc, k = par2)
cent <- NULL
for(k in 1:par2){
cent <- rbind(cent, colMeans(x[memb == k, , drop = FALSE]))
}
hc1 <- hclust(dist(cent),method=par1, members = table(memb))
de <- as.dendrogram(hc1)
bitmap(file='test2.png')
if (par4 == 'TRUE'){
plot(de,main=main,ylab=ylab,xlab=xlab,horiz=par3, nodePar=list(pch = c(1,NA), cex=0.8, lab.cex = 0.8),type='t',center=T, sub=mysub)
} else {
plot(de,main=main,ylab=ylab,xlab=xlab,horiz=par3, nodePar=list(pch = c(1,NA), cex=0.8, lab.cex = 0.8), sub=mysub)
}
dev.off()
str(de)
}
load(file='createtable')
a<-table.start()
a<-table.row.start(a)
a<-table.element(a,'Summary of Dendrogram',2,TRUE)
a<-table.row.end(a)
a<-table.row.start(a)
a<-table.element(a,'Label',header=TRUE)
a<-table.element(a,'Height',header=TRUE)
a<-table.row.end(a)
num <- length(x[,1])-1
for (i in 1:num)
{
a<-table.row.start(a)
a<-table.element(a,hc$labels[i])
a<-table.element(a,hc$height[i])
a<-table.row.end(a)
}
a<-table.end(a)
table.save(a,file='mytable1.tab')
if (par2 != 'ALL'){
a<-table.start()
a<-table.row.start(a)
a<-table.element(a,'Summary of Cut Dendrogram',2,TRUE)
a<-table.row.end(a)
a<-table.row.start(a)
a<-table.element(a,'Label',header=TRUE)
a<-table.element(a,'Height',header=TRUE)
a<-table.row.end(a)
num <- par2-1
for (i in 1:num)
{
a<-table.row.start(a)
a<-table.element(a,i)
a<-table.element(a,hc1$height[i])
a<-table.row.end(a)
}
a<-table.end(a)
table.save(a,file='mytable2.tab')
}