Free Statistics

of Irreproducible Research!

Author's title

Author*Unverified author*
R Software Modulerwasp_cloud.wasp
Title produced by softwareTrivariate Scatterplots
Date of computationMon, 10 Nov 2008 03:51:27 -0700
Cite this page as followsStatistical Computations at FreeStatistics.org, Office for Research Development and Education, URL https://freestatistics.org/blog/index.php?v=date/2008/Nov/10/t1226314346x7kol0tntg9upq1.htm/, Retrieved Sun, 19 May 2024 09:25:01 +0000
Statistical Computations at FreeStatistics.org, Office for Research Development and Education, URL https://freestatistics.org/blog/index.php?pk=22926, Retrieved Sun, 19 May 2024 09:25:01 +0000
QR Codes:

Original text written by user:
IsPrivate?No (this computation is public)
User-defined keywords
Estimated Impact182
Family? (F = Feedback message, R = changed R code, M = changed R Module, P = changed Parameters, D = changed Data)
F       [Trivariate Scatterplots] [Various EDA Topic...] [2008-11-10 10:51:27] [33f3d2151f6019d17feb8eee7259f239] [Current]
Feedback Forum
2008-11-19 15:12:29 [Sam De Cuyper] [reply
Ook hier maakt de studente enkel de berekening zonder conclusies te geven.
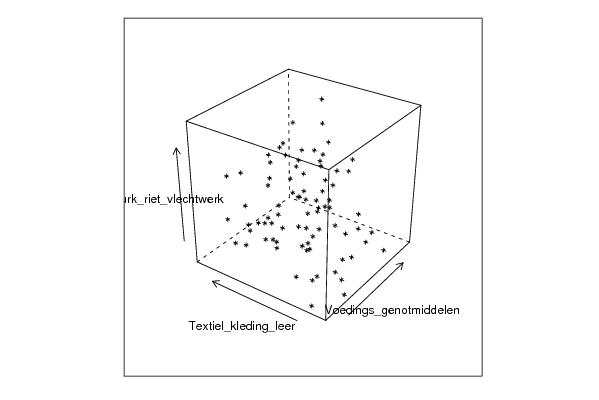
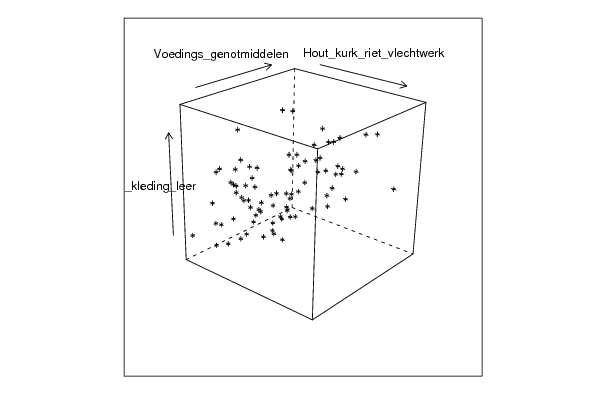
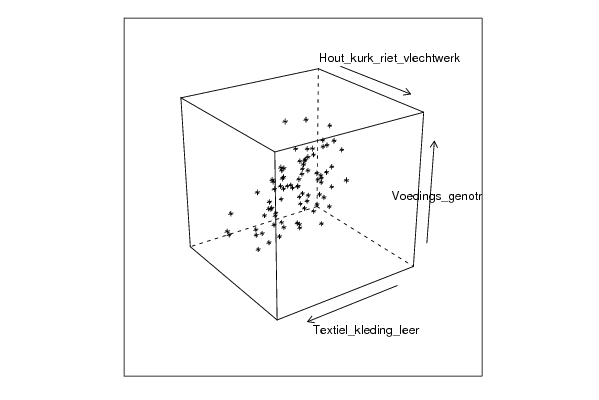
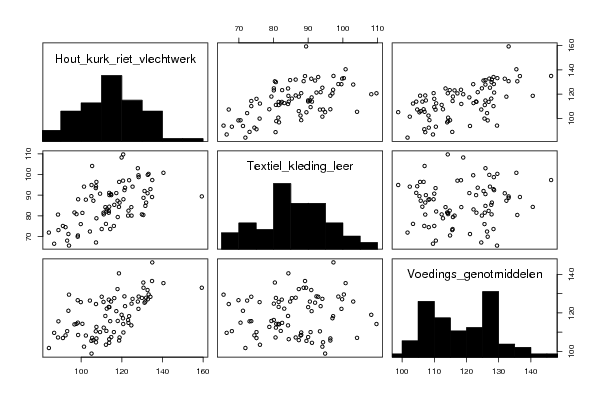
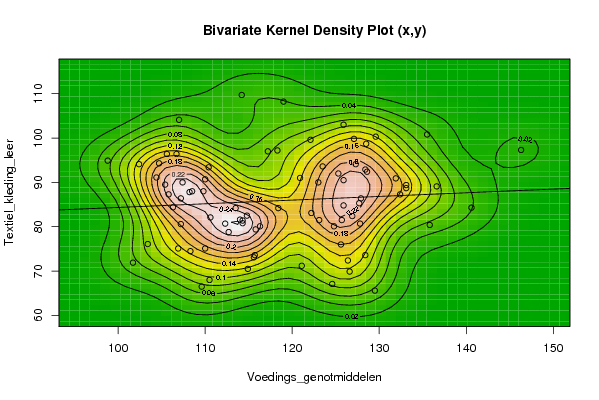
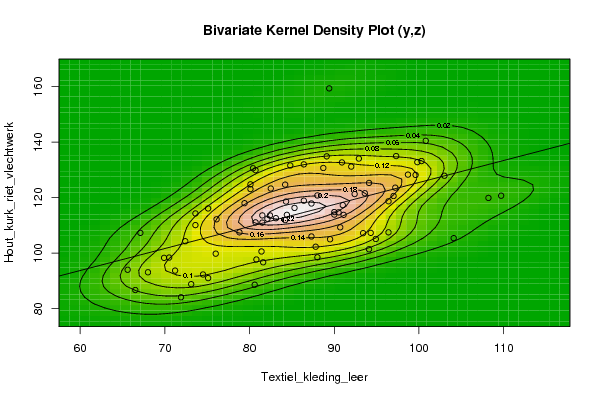
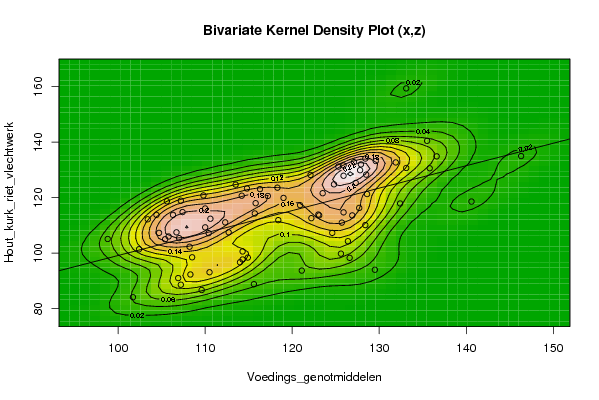
Via de trivariate scatterplot kunnen we het verband tussen 3 variabelen gelijktijdig bestuderen. Naargelang de rotatie van de 3D figuren zal je andere dingen zien. Je moet daarom voorzichtig zijn bij de interpretatie van deze figuren. In het algemeen dien je de 2 dimensionale figuur van de matrix te bekijken, waarbij een vertekening tot stand komt door weglating van de 3de dimensie. Als oplossing zou je de bivariate density moeten gebruiken.
2008-11-20 13:50:27 [Steven Vanhooreweghe] [reply
Die 'vierkante boxen' worden steeds op een andere manier weergegeven, zodat je steeds de dingen anders zou kunnen zien. Dit is echter een nogal vage manier van beoordelen. De scatterplots verduidelijken meer

Post a new message
Dataseries X:
107,2
107
119
110,4
101,7
102,4
98,8
105,6
104,4
106,3
107,2
108,5
106,9
114,2
125,9
110,6
110,5
106,7
104,7
107,4
109,8
103,4
114,8
114,3
109,6
118,3
127,3
112,3
114,9
108,2
105,4
122,1
113,5
110
125,3
114,3
115,6
127,1
123
122,2
126,4
112,7
105,8
120,9
116,3
115,7
127,9
108,3
121,1
128,6
123,1
127,7
126,6
118,4
110
129,6
115,8
125,9
128,4
114
125,6
128,5
136,6
133,1
124,6
123,5
117,2
135,5
124,8
127,8
133,1
125,7
128,4
131,9
146,3
140,6
129,5
132,4
125,9
126,9
135,8
Dataseries Y:
80,6
104,1
108,2
93,4
71,9
94,1
94,9
96,4
91,1
84,4
86,4
88
75,1
109,7
103
82,1
68
96,4
94,3
90
88
76,1
82,5
81,4
66,5
97,2
94,1
80,7
70,5
87,8
89,5
99,6
84,2
75,1
92
80,8
73,1
99,8
90
83,1
72,4
78,8
87,3
91
80,1
73,6
86,4
74,5
71,2
92,4
81,5
85,3
69,9
84,2
90,7
100,3
79,4
84,8
92,9
81,6
76
98,7
89,1
88,7
67,1
93,6
97
100,8
80,1
80,7
89,4
81,5
73,6
90,9
97,3
84,3
65,6
87,3
90,5
82,4
80,4
Dataseries Z:
88,6
105,4
119,9
107,2
84,1
101,4
105,1
118,7
113,8
113,8
118,9
98,5
91
120,7
127,9
112,4
93,1
107,5
107,3
114,8
120,8
112,2
123,3
100,6
86,7
123,6
125,3
111,1
98,4
102,3
105
128,2
124,7
116,1
131,2
97,7
88,8
132,8
113,9
112,6
104,3
107,5
106
117,3
123,1
114,3
132
92,3
93,7
121,3
113,6
116,3
98,3
111,9
109,3
133,2
118
131,6
134,1
96,7
99,8
128,3
134,9
130,7
107,3
121,6
120,6
140,5
124,8
129,9
159,4
111
110,1
132,7
135
118,6
94
117,9
114,7
113,6
130,6


Summary of computational transaction
Raw Inputview raw input (R code)
Raw Outputview raw output of R engine
Computing time5 seconds
R Server'Sir Ronald Aylmer Fisher' @ 193.190.124.24

\begin{tabular}{lllllllll}
\hline
Summary of computational transaction \tabularnewline
Raw Input & view raw input (R code)  \tabularnewline
Raw Output & view raw output of R engine  \tabularnewline
Computing time & 5 seconds \tabularnewline
R Server & 'Sir Ronald Aylmer Fisher' @ 193.190.124.24 \tabularnewline
\hline
\end{tabular}
%Source: https://freestatistics.org/blog/index.php?pk=22926&T=0

[TABLE]
[ROW][C]Summary of computational transaction[/C][/ROW]
[ROW][C]Raw Input[/C][C]view raw input (R code) [/C][/ROW]
[ROW][C]Raw Output[/C][C]view raw output of R engine [/C][/ROW]
[ROW][C]Computing time[/C][C]5 seconds[/C][/ROW]
[ROW][C]R Server[/C][C]'Sir Ronald Aylmer Fisher' @ 193.190.124.24[/C][/ROW]
[/TABLE]
Source: https://freestatistics.org/blog/index.php?pk=22926&T=0

Globally Unique Identifier (entire table): ba.freestatistics.org/blog/index.php?pk=22926&T=0

As an alternative you can also use a QR Code:  

The GUIDs for individual cells are displayed in the table below:

Summary of computational transaction
Raw Inputview raw input (R code)
Raw Outputview raw output of R engine
Computing time5 seconds
R Server'Sir Ronald Aylmer Fisher' @ 193.190.124.24


Parameters (Session):
par1 = 50 ; par2 = 50 ; par3 = Y ; par4 = Y ; par5 = Voedings_genotmiddelen ; par6 = Textiel_kleding_leer ; par7 = Hout_kurk_riet_vlechtwerk ;
Parameters (R input):
par1 = 50 ; par2 = 50 ; par3 = Y ; par4 = Y ; par5 = Voedings_genotmiddelen ; par6 = Textiel_kleding_leer ; par7 = Hout_kurk_riet_vlechtwerk ;
R code (references can be found in the software module):
x <- array(x,dim=c(length(x),1))
colnames(x) <- par5
y <- array(y,dim=c(length(y),1))
colnames(y) <- par6
z <- array(z,dim=c(length(z),1))
colnames(z) <- par7
d <- data.frame(cbind(z,y,x))
colnames(d) <- list(par7,par6,par5)
par1 <- as.numeric(par1)
par2 <- as.numeric(par2)
if (par1>500) par1 <- 500
if (par2>500) par2 <- 500
if (par1<10) par1 <- 10
if (par2<10) par2 <- 10
library(GenKern)
library(lattice)
panel.hist <- function(x, ...)
{
usr <- par('usr'); on.exit(par(usr))
par(usr = c(usr[1:2], 0, 1.5) )
h <- hist(x, plot = FALSE)
breaks <- h$breaks; nB <- length(breaks)
y <- h$counts; y <- y/max(y)
rect(breaks[-nB], 0, breaks[-1], y, col='black', ...)
}
bitmap(file='cloud1.png')
cloud(z~x*y, screen = list(x=-45, y=45, z=35),xlab=par5,ylab=par6,zlab=par7)
dev.off()
bitmap(file='cloud2.png')
cloud(z~x*y, screen = list(x=35, y=45, z=25),xlab=par5,ylab=par6,zlab=par7)
dev.off()
bitmap(file='cloud3.png')
cloud(z~x*y, screen = list(x=35, y=-25, z=90),xlab=par5,ylab=par6,zlab=par7)
dev.off()
bitmap(file='pairs.png')
pairs(d,diag.panel=panel.hist)
dev.off()
x <- as.vector(x)
y <- as.vector(y)
z <- as.vector(z)
bitmap(file='bidensity1.png')
op <- KernSur(x,y, xgridsize=par1, ygridsize=par2, correlation=cor(x,y), xbandwidth=dpik(x), ybandwidth=dpik(y))
image(op$xords, op$yords, op$zden, col=terrain.colors(100), axes=TRUE,main='Bivariate Kernel Density Plot (x,y)',xlab=par5,ylab=par6)
if (par3=='Y') contour(op$xords, op$yords, op$zden, add=TRUE)
if (par4=='Y') points(x,y)
(r<-lm(y ~ x))
abline(r)
box()
dev.off()
bitmap(file='bidensity2.png')
op <- KernSur(y,z, xgridsize=par1, ygridsize=par2, correlation=cor(y,z), xbandwidth=dpik(y), ybandwidth=dpik(z))
op
image(op$xords, op$yords, op$zden, col=terrain.colors(100), axes=TRUE,main='Bivariate Kernel Density Plot (y,z)',xlab=par6,ylab=par7)
if (par3=='Y') contour(op$xords, op$yords, op$zden, add=TRUE)
if (par4=='Y') points(y,z)
(r<-lm(z ~ y))
abline(r)
box()
dev.off()
bitmap(file='bidensity3.png')
op <- KernSur(x,z, xgridsize=par1, ygridsize=par2, correlation=cor(x,z), xbandwidth=dpik(x), ybandwidth=dpik(z))
op
image(op$xords, op$yords, op$zden, col=terrain.colors(100), axes=TRUE,main='Bivariate Kernel Density Plot (x,z)',xlab=par5,ylab=par7)
if (par3=='Y') contour(op$xords, op$yords, op$zden, add=TRUE)
if (par4=='Y') points(x,z)
(r<-lm(z ~ x))
abline(r)
box()
dev.off()