Free Statistics

of Irreproducible Research!

Author's title

Author*The author of this computation has been verified*
R Software Modulerwasp_bidensity.wasp
Title produced by softwareBivariate Kernel Density Estimation
Date of computationMon, 10 Nov 2008 02:57:48 -0700
Cite this page as followsStatistical Computations at FreeStatistics.org, Office for Research Development and Education, URL https://freestatistics.org/blog/index.php?v=date/2008/Nov/10/t1226311133jjidgj4vuk2n44f.htm/, Retrieved Sun, 19 May 2024 10:19:33 +0000
Statistical Computations at FreeStatistics.org, Office for Research Development and Education, URL https://freestatistics.org/blog/index.php?pk=22900, Retrieved Sun, 19 May 2024 10:19:33 +0000
QR Codes:

Original text written by user:
IsPrivate?No (this computation is public)
User-defined keywordsBert Moons, inflatie, Bivariate Kernel Density
Estimated Impact211
Family? (F = Feedback message, R = changed R code, M = changed R Module, P = changed Parameters, D = changed Data)
F       [Bivariate Kernel Density Estimation] [Bivariate Kernel ...] [2008-11-10 09:57:48] [1828943283e41f5e3270e2e73d6433b4] [Current]
Feedback Forum
2008-11-19 11:09:30 [Toon Wouters] [reply
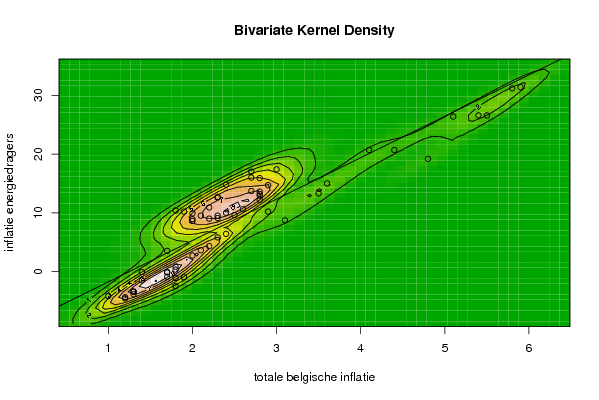
De lijn in de grafiek stelt de regressielijn voor. De hoogtelijnen stellen de concentratie van de puntenwolken voor. De waarschijnlijkheid is het grootst op de middelste hoogtelijnen. Uit deze grafiek kunnen we concluderen dat de gevormde figuren ellipsvormig zijn en dat ze van links onder naar rechts boven wijzen wat wil zeggen dat er een possitief verband is. Indien de figuren cirkelvormig waren, wees dit op minder verband
2008-11-20 15:18:03 [Natalie De Wilde] [reply
Goed.
Naast de puntenwolk zijn er 2 extra aspecten: de regressielijn en de hoogtelijnen. Deze suggereren de derde dimensie die zichtbaar is bij de trivariate scatterplot. De hoogtelijnen duiden op de concentratie, de dichtheid van de punten.
De output vertoont inderdaad een lineair verloop, de hoogtelijnen zijn ovaal. De cirkels duiden erop dat er geen verband is.
2008-11-23 20:27:42 [Vincent Vanden Poel] [reply
Goed opgelost. Bij de bivaariate density wordt een een 3e dimensie toegevoegd op basis van hoogtelijnen. Deze hoogtelijnen stellen de concentratie van de punten voor. De elipsvorm wijst inderdaad op een sterke correlatie tussen de belgische inflatie en de inflatie van energie. In dit geval gaat het om een sterk positief verband tussen de twee variabelen. Indien de éne stijgt zal de andere mee stijgen en omgekeerd.
2008-11-24 18:21:13 [Sören Van Donink] [reply
Zeer goed. Ik zou eventueel de uitleg van bovenstaande personen over de derde dimensie en regressierechte kunnen herhalen maar is beetje overbodig aangezien ik van mening ben dat zij het reeds heel duidelijk hebben uitgelegd.

Post a new message
Dataseries X:
4.8
5.5
5.4
5.9
5.8
5.1
4.1
4.4
3.6
3.5
3.1
2.9
2.2
1.4
1.2
1.3
1.3
1.3
1.8
1.8
1.8
1.7
2.1
2
1.7
1.9
2.3
2.4
2.5
2.8
2.6
2.2
2.8
2.8
2.8
2.3
2.2
3
2.9
2.7
2.7
2.3
2.4
2.8
2.3
2
1.9
2.3
2.7
1.8
2
2.1
2
2.4
1.7
1
1.2
1.4
1.7
1.8
Dataseries Y:
19.2
26.6
26.6
31.4
31.2
26.4
20.7
20.7
15
13.3
8.7
10.2
4.3
-0.1
-4.6
-3.9
-3.5
-3.4
-2.5
-1.1
0.3
-0.9
3.6
2.7
-0.2
-1
5.8
6.4
9.6
13.2
10.6
10.9
12.9
15.9
12.2
9.1
9
17.4
14.7
17
13.7
9.5
14.8
13.6
12.6
8.9
10.2
12.7
16
10.4
9.9
9.5
8.6
10
3.5
-4.2
-4.4
-1.5
-0.1
0.8


Summary of computational transaction
Raw Inputview raw input (R code)
Raw Outputview raw output of R engine
Computing time3 seconds
R Server'Sir Ronald Aylmer Fisher' @ 193.190.124.24

\begin{tabular}{lllllllll}
\hline
Summary of computational transaction \tabularnewline
Raw Input & view raw input (R code)  \tabularnewline
Raw Output & view raw output of R engine  \tabularnewline
Computing time & 3 seconds \tabularnewline
R Server & 'Sir Ronald Aylmer Fisher' @ 193.190.124.24 \tabularnewline
\hline
\end{tabular}
%Source: https://freestatistics.org/blog/index.php?pk=22900&T=0

[TABLE]
[ROW][C]Summary of computational transaction[/C][/ROW]
[ROW][C]Raw Input[/C][C]view raw input (R code) [/C][/ROW]
[ROW][C]Raw Output[/C][C]view raw output of R engine [/C][/ROW]
[ROW][C]Computing time[/C][C]3 seconds[/C][/ROW]
[ROW][C]R Server[/C][C]'Sir Ronald Aylmer Fisher' @ 193.190.124.24[/C][/ROW]
[/TABLE]
Source: https://freestatistics.org/blog/index.php?pk=22900&T=0

Globally Unique Identifier (entire table): ba.freestatistics.org/blog/index.php?pk=22900&T=0

As an alternative you can also use a QR Code:  

The GUIDs for individual cells are displayed in the table below:

Summary of computational transaction
Raw Inputview raw input (R code)
Raw Outputview raw output of R engine
Computing time3 seconds
R Server'Sir Ronald Aylmer Fisher' @ 193.190.124.24


Bandwidth
x axis0.349723132959552
y axis2.89706462473735
Correlation
correlation used in KDE0.913837761374175
correlation(x,y)0.913837761374175

\begin{tabular}{lllllllll}
\hline
Bandwidth \tabularnewline
x axis & 0.349723132959552 \tabularnewline
y axis & 2.89706462473735 \tabularnewline
Correlation \tabularnewline
correlation used in KDE & 0.913837761374175 \tabularnewline
correlation(x,y) & 0.913837761374175 \tabularnewline
\hline
\end{tabular}
%Source: https://freestatistics.org/blog/index.php?pk=22900&T=1

[TABLE]
[ROW][C]Bandwidth[/C][/ROW]
[ROW][C]x axis[/C][C]0.349723132959552[/C][/ROW]
[ROW][C]y axis[/C][C]2.89706462473735[/C][/ROW]
[ROW][C]Correlation[/C][/ROW]
[ROW][C]correlation used in KDE[/C][C]0.913837761374175[/C][/ROW]
[ROW][C]correlation(x,y)[/C][C]0.913837761374175[/C][/ROW]
[/TABLE]
Source: https://freestatistics.org/blog/index.php?pk=22900&T=1

Globally Unique Identifier (entire table): ba.freestatistics.org/blog/index.php?pk=22900&T=1

As an alternative you can also use a QR Code:  

The GUIDs for individual cells are displayed in the table below:

Bandwidth
x axis0.349723132959552
y axis2.89706462473735
Correlation
correlation used in KDE0.913837761374175
correlation(x,y)0.913837761374175


Parameters (Session):
par1 = 50 ; par2 = 50 ; par3 = 0 ; par4 = 0 ; par5 = 0 ; par6 = Y ; par7 = Y ;
Parameters (R input):
par1 = 50 ; par2 = 50 ; par3 = 0 ; par4 = 0 ; par5 = 0 ; par6 = Y ; par7 = Y ;
R code (references can be found in the software module):
par1 <- as(par1,'numeric')
par2 <- as(par2,'numeric')
par3 <- as(par3,'numeric')
par4 <- as(par4,'numeric')
par5 <- as(par5,'numeric')
library('GenKern')
if (par3==0) par3 <- dpik(x)
if (par4==0) par4 <- dpik(y)
if (par5==0) par5 <- cor(x,y)
if (par1 > 500) par1 <- 500
if (par2 > 500) par2 <- 500
bitmap(file='bidensity.png')
op <- KernSur(x,y, xgridsize=par1, ygridsize=par2, correlation=par5, xbandwidth=par3, ybandwidth=par4)
image(op$xords, op$yords, op$zden, col=terrain.colors(100), axes=TRUE,main=main,xlab=xlab,ylab=ylab)
if (par6=='Y') contour(op$xords, op$yords, op$zden, add=TRUE)
if (par7=='Y') points(x,y)
(r<-lm(y ~ x))
abline(r)
box()
dev.off()
load(file='createtable')
a<-table.start()
a<-table.row.start(a)
a<-table.element(a,'Bandwidth',2,TRUE)
a<-table.row.end(a)
a<-table.row.start(a)
a<-table.element(a,'x axis',header=TRUE)
a<-table.element(a,par3)
a<-table.row.end(a)
a<-table.row.start(a)
a<-table.element(a,'y axis',header=TRUE)
a<-table.element(a,par4)
a<-table.row.end(a)
a<-table.row.start(a)
a<-table.element(a,'Correlation',2,TRUE)
a<-table.row.end(a)
a<-table.row.start(a)
a<-table.element(a,'correlation used in KDE',header=TRUE)
a<-table.element(a,par5)
a<-table.row.end(a)
a<-table.row.start(a)
a<-table.element(a,'correlation(x,y)',header=TRUE)
a<-table.element(a,cor(x,y))
a<-table.row.end(a)
a<-table.end(a)
table.save(a,file='mytable.tab')