Free Statistics

of Irreproducible Research!

Author's title

Author*The author of this computation has been verified*
R Software Modulerwasp_cloud.wasp
Title produced by softwareTrivariate Scatterplots
Date of computationMon, 10 Nov 2008 02:30:46 -0700
Cite this page as followsStatistical Computations at FreeStatistics.org, Office for Research Development and Education, URL https://freestatistics.org/blog/index.php?v=date/2008/Nov/10/t12263094826m39vkuw7w8m0mu.htm/, Retrieved Sun, 19 May 2024 11:33:29 +0000
Statistical Computations at FreeStatistics.org, Office for Research Development and Education, URL https://freestatistics.org/blog/index.php?pk=22894, Retrieved Sun, 19 May 2024 11:33:29 +0000
QR Codes:

Original text written by user:
IsPrivate?No (this computation is public)
User-defined keywords
Estimated Impact219
Family? (F = Feedback message, R = changed R code, M = changed R Module, P = changed Parameters, D = changed Data)
F     [Univariate Data Series] [VMAW] [2008-10-13 16:54:40] [cbd3d88cd5aad6543e769146e7e26b0c]
F RMPD    [Trivariate Scatterplots] [Opdracht 4 Q1 3] [2008-11-10 09:30:46] [2ae704d6b0222e84f58032588d68322b] [Current]
Feedback Forum
2008-11-19 15:30:24 [Mehmet Yilmaz] [reply
Trivariate Scatterplots:
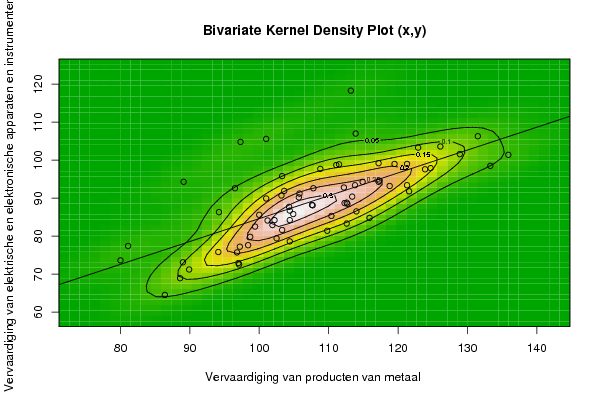
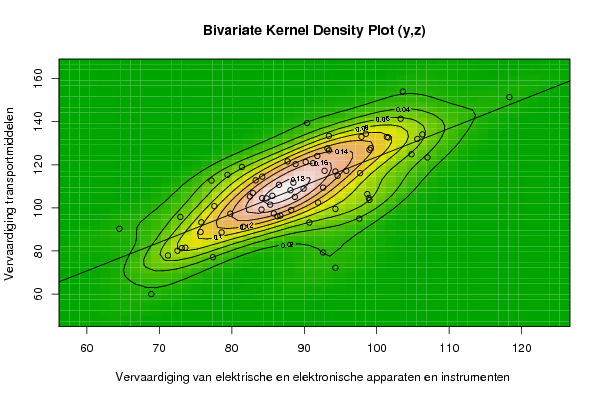
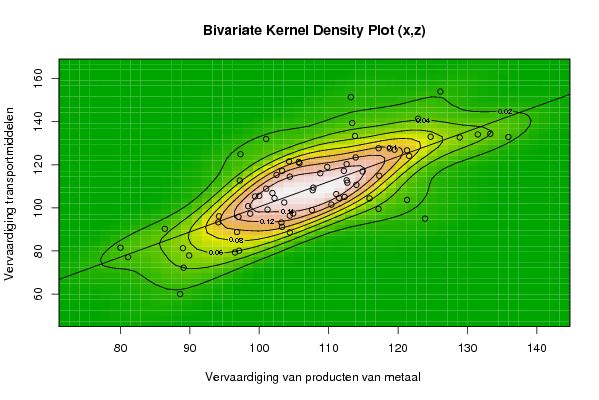
Hiermee kan men verschillende berekeningen maken in 1 keer met o. a de Bivarlate kernel density.
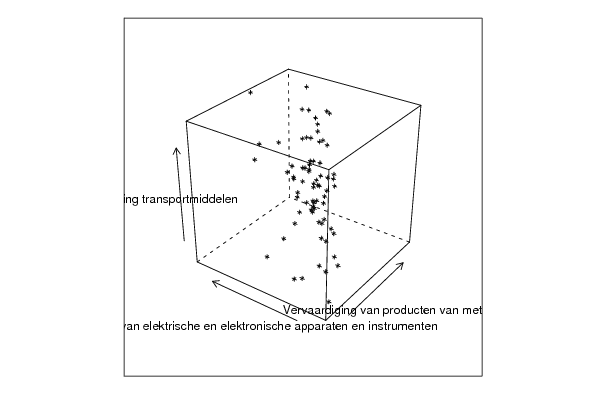
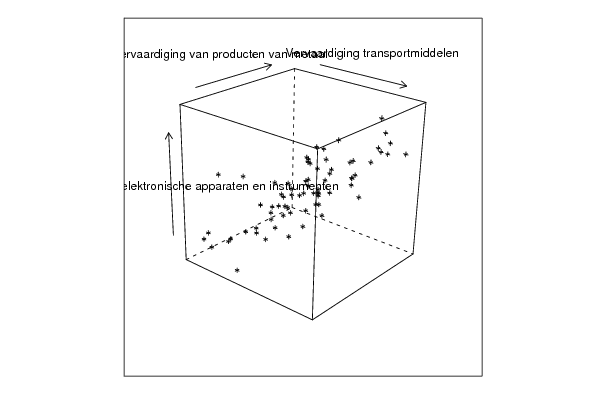
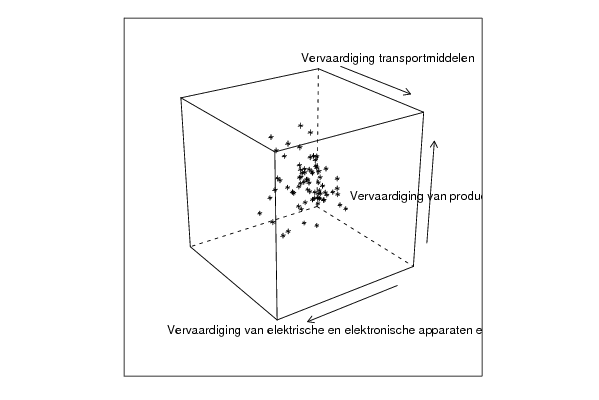
Je krijgt eerst 3 vierkanten te zien die telkens het verband tussen 3 variabelen weergeven. Het nadeel hiervan is dat je de afstand tussen de punten niet goed kan inschatten.
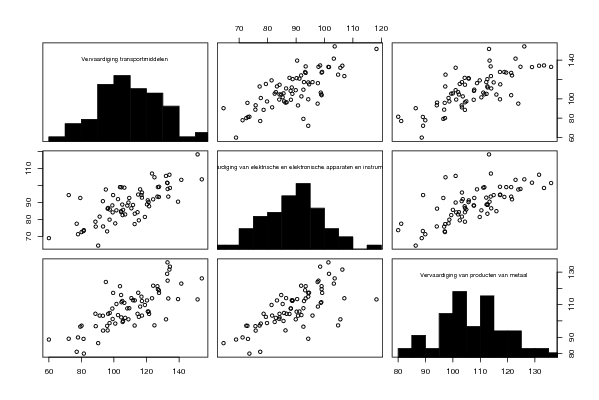
Vervolgens is er het 2-dimensioneel scatterplot. Je kan hieruit afleiden of een variabele een normaalverdeling heeft en of er correlatie is tussen de verschillende variabelen.
Hoe dichter de punten hoe groter de waarschijnlijkheid. Het nadeel van deze methode is dat je een vertekend beeld kan krijgen.
2008-11-24 17:27:39 [Jan Cavents] [reply
ook deze methode is bedoeld om een grafisch beeld te geven van de verbanden tussen de 3 tijdsreeksen. hoe dichter de punten bij elkaar, hoe groter de correlatie. het nadeel is wel dat we de kubus niet kunnen kantelen, en zo waarschijnlijk een beeld krijgen dat niet volledig correct is.

2008-11-24 18:53:05 [Steven Hulsmans] [reply
We moeten er rekening mee houden dat we vertekeningen hebben bij deze techniek. Punten die achter mekaar of dicht bij mekaar liggen kunnen in werkelijkheid verder uit mekaar liggen.Hieruit leiden we een 2 dimensioneel scatterplot af. Deze verklaart of de variabelen een normaalverdeling hebben en of er correlatie aanwezig is.

Post a new message
Dataseries X:
97.3
101
113.2
101
105.7
113.9
86.4
96.5
103.3
114.9
105.8
94.2
98.4
99.4
108.8
112.6
104.4
112.2
81.1
97.1
112.6
113.8
107.8
103.2
103.3
101.2
107.7
110.4
101.9
115.9
89.9
88.6
117.2
123.9
100
103.6
94.1
98.7
119.5
112.7
104.4
124.7
89.1
97
121.6
118.8
114
111.5
97.2
102.5
113.4
109.8
104.9
126.1
80
96.8
117.2
112.3
117.3
111.1
102.2
104.3
122.9
107.6
121.3
131.5
89
104.4
128.9
135.9
133.3
121.3
Dataseries Y:
104.8
105.6
118.3
89.9
90.2
107
64.5
92.6
95.8
94.3
91.2
86.3
77.6
82.5
97.7
83.3
84.2
92.8
77.4
72.5
88.8
93.4
92.6
90.7
81.6
84.1
88.1
85.3
82.9
84.8
71.2
68.9
94.3
97.6
85.6
91.9
75.8
79.8
99
88.5
86.7
97.9
94.3
72.9
91.8
93.2
86.5
98.9
77.2
79.4
90.4
81.4
85.8
103.6
73.6
75.7
99.2
88.7
94.6
98.7
84.2
87.7
103.3
88.2
93.4
106.3
73.1
78.6
101.6
101.4
98.5
99
Dataseries Z:
124.9
132
151.4
108.9
121.3
123.4
90.3
79.3
117.2
116.9
120.8
96.1
100.8
105.3
116.1
112.8
114.5
117.2
77.1
80.1
120.3
133.4
109.4
93.2
91.2
99.2
108.2
101.5
106.9
104.4
77.9
60
99.5
95
105.6
102.5
93.3
97.3
127
111.7
96.4
133
72.2
95.8
124.1
127.6
110.7
104.6
112.7
115.3
139.4
119
97.4
154
81.5
88.8
127.7
105.1
114.9
106.4
104.5
121.6
141.4
99
126.7
134.1
81.3
88.6
132.7
132.9
134.4
103.7


Summary of computational transaction
Raw Inputview raw input (R code)
Raw Outputview raw output of R engine
Computing time7 seconds
R Server'Sir Ronald Aylmer Fisher' @ 193.190.124.24

\begin{tabular}{lllllllll}
\hline
Summary of computational transaction \tabularnewline
Raw Input & view raw input (R code)  \tabularnewline
Raw Output & view raw output of R engine  \tabularnewline
Computing time & 7 seconds \tabularnewline
R Server & 'Sir Ronald Aylmer Fisher' @ 193.190.124.24 \tabularnewline
\hline
\end{tabular}
%Source: https://freestatistics.org/blog/index.php?pk=22894&T=0

[TABLE]
[ROW][C]Summary of computational transaction[/C][/ROW]
[ROW][C]Raw Input[/C][C]view raw input (R code) [/C][/ROW]
[ROW][C]Raw Output[/C][C]view raw output of R engine [/C][/ROW]
[ROW][C]Computing time[/C][C]7 seconds[/C][/ROW]
[ROW][C]R Server[/C][C]'Sir Ronald Aylmer Fisher' @ 193.190.124.24[/C][/ROW]
[/TABLE]
Source: https://freestatistics.org/blog/index.php?pk=22894&T=0

Globally Unique Identifier (entire table): ba.freestatistics.org/blog/index.php?pk=22894&T=0

As an alternative you can also use a QR Code:  

The GUIDs for individual cells are displayed in the table below:

Summary of computational transaction
Raw Inputview raw input (R code)
Raw Outputview raw output of R engine
Computing time7 seconds
R Server'Sir Ronald Aylmer Fisher' @ 193.190.124.24


Parameters (Session):
par1 = 50 ; par2 = 50 ; par3 = Y ; par4 = Y ; par5 = Vervaardiging van producten van metaal ; par6 = Vervaardiging van elektrische en elektronische apparaten en instrumenten ; par7 = Vervaardiging transportmiddelen ;
Parameters (R input):
par1 = 50 ; par2 = 50 ; par3 = Y ; par4 = Y ; par5 = Vervaardiging van producten van metaal ; par6 = Vervaardiging van elektrische en elektronische apparaten en instrumenten ; par7 = Vervaardiging transportmiddelen ;
R code (references can be found in the software module):
x <- array(x,dim=c(length(x),1))
colnames(x) <- par5
y <- array(y,dim=c(length(y),1))
colnames(y) <- par6
z <- array(z,dim=c(length(z),1))
colnames(z) <- par7
d <- data.frame(cbind(z,y,x))
colnames(d) <- list(par7,par6,par5)
par1 <- as.numeric(par1)
par2 <- as.numeric(par2)
if (par1>500) par1 <- 500
if (par2>500) par2 <- 500
if (par1<10) par1 <- 10
if (par2<10) par2 <- 10
library(GenKern)
library(lattice)
panel.hist <- function(x, ...)
{
usr <- par('usr'); on.exit(par(usr))
par(usr = c(usr[1:2], 0, 1.5) )
h <- hist(x, plot = FALSE)
breaks <- h$breaks; nB <- length(breaks)
y <- h$counts; y <- y/max(y)
rect(breaks[-nB], 0, breaks[-1], y, col='black', ...)
}
bitmap(file='cloud1.png')
cloud(z~x*y, screen = list(x=-45, y=45, z=35),xlab=par5,ylab=par6,zlab=par7)
dev.off()
bitmap(file='cloud2.png')
cloud(z~x*y, screen = list(x=35, y=45, z=25),xlab=par5,ylab=par6,zlab=par7)
dev.off()
bitmap(file='cloud3.png')
cloud(z~x*y, screen = list(x=35, y=-25, z=90),xlab=par5,ylab=par6,zlab=par7)
dev.off()
bitmap(file='pairs.png')
pairs(d,diag.panel=panel.hist)
dev.off()
x <- as.vector(x)
y <- as.vector(y)
z <- as.vector(z)
bitmap(file='bidensity1.png')
op <- KernSur(x,y, xgridsize=par1, ygridsize=par2, correlation=cor(x,y), xbandwidth=dpik(x), ybandwidth=dpik(y))
image(op$xords, op$yords, op$zden, col=terrain.colors(100), axes=TRUE,main='Bivariate Kernel Density Plot (x,y)',xlab=par5,ylab=par6)
if (par3=='Y') contour(op$xords, op$yords, op$zden, add=TRUE)
if (par4=='Y') points(x,y)
(r<-lm(y ~ x))
abline(r)
box()
dev.off()
bitmap(file='bidensity2.png')
op <- KernSur(y,z, xgridsize=par1, ygridsize=par2, correlation=cor(y,z), xbandwidth=dpik(y), ybandwidth=dpik(z))
op
image(op$xords, op$yords, op$zden, col=terrain.colors(100), axes=TRUE,main='Bivariate Kernel Density Plot (y,z)',xlab=par6,ylab=par7)
if (par3=='Y') contour(op$xords, op$yords, op$zden, add=TRUE)
if (par4=='Y') points(y,z)
(r<-lm(z ~ y))
abline(r)
box()
dev.off()
bitmap(file='bidensity3.png')
op <- KernSur(x,z, xgridsize=par1, ygridsize=par2, correlation=cor(x,z), xbandwidth=dpik(x), ybandwidth=dpik(z))
op
image(op$xords, op$yords, op$zden, col=terrain.colors(100), axes=TRUE,main='Bivariate Kernel Density Plot (x,z)',xlab=par5,ylab=par7)
if (par3=='Y') contour(op$xords, op$yords, op$zden, add=TRUE)
if (par4=='Y') points(x,z)
(r<-lm(z ~ x))
abline(r)
box()
dev.off()