Free Statistics

of Irreproducible Research!

Author's title

Author*The author of this computation has been verified*
R Software Modulerwasp_hierarchicalclustering.wasp
Title produced by softwareHierarchical Clustering
Date of computationSun, 09 Nov 2008 15:15:21 -0700
Cite this page as followsStatistical Computations at FreeStatistics.org, Office for Research Development and Education, URL https://freestatistics.org/blog/index.php?v=date/2008/Nov/09/t12262690124axmamvxofj3n9h.htm/, Retrieved Sun, 19 May 2024 08:56:24 +0000
Statistical Computations at FreeStatistics.org, Office for Research Development and Education, URL https://freestatistics.org/blog/index.php?pk=22883, Retrieved Sun, 19 May 2024 08:56:24 +0000
QR Codes:

Original text written by user:
IsPrivate?No (this computation is public)
User-defined keywords
Estimated Impact148
Family? (F = Feedback message, R = changed R code, M = changed R Module, P = changed Parameters, D = changed Data)
-     [Testing Sample Mean with known Variance - Confidence Interval] [Q6] [2008-11-05 19:49:40] [1e1d8320a8a1170c475bf6e4ce119de6]
- RMPD    [Hierarchical Clustering] [Q2] [2008-11-09 22:15:21] [fdd69703d301fae09456f660b2f52997] [Current]
Feedback Forum

Post a new message
Dataseries X:
1332.7	744.8	64.5	53.3
1343.8	672.1	57.9	66.9
1421.6	666.6	72.5	73.7
1329.8	760.8	82.9	71.9
1306.8	756	62.7	67.9
1412.8	604.4	66.6	77.5
1358.1	883.9	70.9	82
1163.9	527.9	56.3	40.5
1467.9	756.2	81.2	76.2
1433.7	812.9	67.8	75
1362.2	655.6	57.2	64
1299	707.6	62.8	77.2
1291.5	612.6	51.2	63.9
1452.7	659.2	66.5	71.4
1555.4	833.4	71.5	71.3
1402.5	727.8	67.8	50
1242.9	797.2	56.9	47.9
1514.6	753	90.6	55.2
1308.6	762	64.1	61.8
1239.3	613.7	65.7	53.6
1519.9	759.2	77.9	60
1659.4	816.4	84.2	72.7
1597.6	736.8	81.7	63.6
1340.6	680.1	65.9	62.1
1427.2	736.5	76.1	58.1
1438.1	637.2	80.1	68.1
1616.2	801.9	74.3	65.5
1392.8	772.3	86.5	59.3
1318.7	897.3	70.9	65.7
1420.9	792.1	91.5	68.3
1221	826.8	93.7	77.8
1310	666.8	77.5	49.1
1466.7	906.6	100.3	96.9
1299.3	871.4	85.7	64.6
1640	891	95	67
1506.3	739.2	73.7	64.6
1530.2	833.6	87.6	84.3
1661.9	715.6	87.6	72.6
1880.3	871.6	92.9	71.3
1230.8	751.6	80.7	52.8
1406.5	1005.5	74	63.9
1523.5	681.2	87.7	67.9
1323.2	837.3	68.2	74.1
1319.2	674.7	117.4	61.7
1500.7	806.3	100.1	74.1
1483	860.2	97.7	83.5
1497	689.8	101.1	75.6
1219.8	691.6	87.6	77.9
1472.9	682.6	83.2	69.2
1423.9	800.1	85.9	67.8
1629.6	1023.7	118	74.8
1353.4	733.5	87.3	69.7
1366.8	875.3	79.5	69.9
1527.1	770.2	93.2	84.3
1487.6	1005.7	99.2	81.7
1478.6	982.3	66.6	69.3
1536.7	742.9	83.9	83.8
1682.1	974.2	100.4	96
1576.5	822.3	73.5	74.2
1280.5	773.2	60.8	70.4


Summary of computational transaction
Raw Inputview raw input (R code)
Raw Outputview raw output of R engine
Computing time2 seconds
R Server'Sir Ronald Aylmer Fisher' @ 193.190.124.24

\begin{tabular}{lllllllll}
\hline
Summary of computational transaction \tabularnewline
Raw Input & view raw input (R code)  \tabularnewline
Raw Output & view raw output of R engine  \tabularnewline
Computing time & 2 seconds \tabularnewline
R Server & 'Sir Ronald Aylmer Fisher' @ 193.190.124.24 \tabularnewline
\hline
\end{tabular}
%Source: https://freestatistics.org/blog/index.php?pk=22883&T=0

[TABLE]
[ROW][C]Summary of computational transaction[/C][/ROW]
[ROW][C]Raw Input[/C][C]view raw input (R code) [/C][/ROW]
[ROW][C]Raw Output[/C][C]view raw output of R engine [/C][/ROW]
[ROW][C]Computing time[/C][C]2 seconds[/C][/ROW]
[ROW][C]R Server[/C][C]'Sir Ronald Aylmer Fisher' @ 193.190.124.24[/C][/ROW]
[/TABLE]
Source: https://freestatistics.org/blog/index.php?pk=22883&T=0

Globally Unique Identifier (entire table): ba.freestatistics.org/blog/index.php?pk=22883&T=0

As an alternative you can also use a QR Code:  

The GUIDs for individual cells are displayed in the table below:

Summary of computational transaction
Raw Inputview raw input (R code)
Raw Outputview raw output of R engine
Computing time2 seconds
R Server'Sir Ronald Aylmer Fisher' @ 193.190.124.24


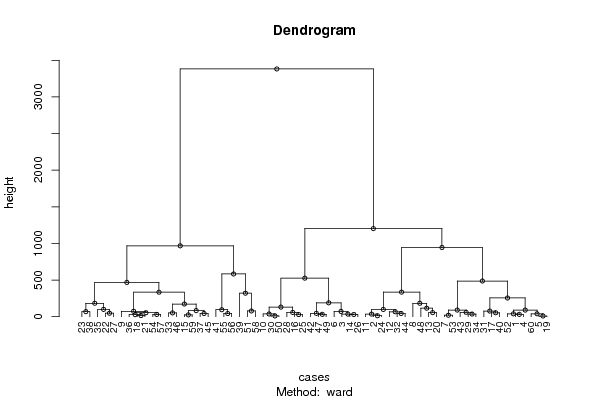
Summary of Dendrogram
LabelHeight
18.85494212290515
210.2279030108816
312.6996062931101
415.8385605406553
519.2359039298911
624.1004149341873
728.1475732839986
828.6405307213397
929.8832729131199
1030.4004934170485
1130.8047074324688
1231.5280827200132
1334.9322789588908
1435.1176389143834
1535.6008426866556
1636.5707863979078
1738.4613843571213
1839.1834708518015
1942.9543944201289
2043.3108531432943
2143.5639759434329
2244.6210549016530
2347.1841074939434
2451.038906728103
2553.0680694956959
2653.6888015539384
2755.1578643531456
2857.6835603709639
2959.4460935409873
3066.4627566779564
3168.5546497328957
3271.6705743709065
3373.3481828871525
3476.2674164099332
3577.2379440430673
3682.6471113345416
3789.454724127598
3889.9400046249197
3994.3906816738263
4098.0445799036604
4199.320618871841
42115.148376076700
43130.421807563817
44172.65571564099
45182.470380793106
46182.891267727916
47188.558462082211
48254.72856076033
49320.25023469103
50333.574297031748
51334.891331545112
52467.451853099401
53486.638134936534
54525.662150516458
55582.389426488984
56944.599626611977
57966.756896711748
581202.39501240223
593381.28192838584

\begin{tabular}{lllllllll}
\hline
Summary of Dendrogram \tabularnewline
Label & Height \tabularnewline
1 & 8.85494212290515 \tabularnewline
2 & 10.2279030108816 \tabularnewline
3 & 12.6996062931101 \tabularnewline
4 & 15.8385605406553 \tabularnewline
5 & 19.2359039298911 \tabularnewline
6 & 24.1004149341873 \tabularnewline
7 & 28.1475732839986 \tabularnewline
8 & 28.6405307213397 \tabularnewline
9 & 29.8832729131199 \tabularnewline
10 & 30.4004934170485 \tabularnewline
11 & 30.8047074324688 \tabularnewline
12 & 31.5280827200132 \tabularnewline
13 & 34.9322789588908 \tabularnewline
14 & 35.1176389143834 \tabularnewline
15 & 35.6008426866556 \tabularnewline
16 & 36.5707863979078 \tabularnewline
17 & 38.4613843571213 \tabularnewline
18 & 39.1834708518015 \tabularnewline
19 & 42.9543944201289 \tabularnewline
20 & 43.3108531432943 \tabularnewline
21 & 43.5639759434329 \tabularnewline
22 & 44.6210549016530 \tabularnewline
23 & 47.1841074939434 \tabularnewline
24 & 51.038906728103 \tabularnewline
25 & 53.0680694956959 \tabularnewline
26 & 53.6888015539384 \tabularnewline
27 & 55.1578643531456 \tabularnewline
28 & 57.6835603709639 \tabularnewline
29 & 59.4460935409873 \tabularnewline
30 & 66.4627566779564 \tabularnewline
31 & 68.5546497328957 \tabularnewline
32 & 71.6705743709065 \tabularnewline
33 & 73.3481828871525 \tabularnewline
34 & 76.2674164099332 \tabularnewline
35 & 77.2379440430673 \tabularnewline
36 & 82.6471113345416 \tabularnewline
37 & 89.454724127598 \tabularnewline
38 & 89.9400046249197 \tabularnewline
39 & 94.3906816738263 \tabularnewline
40 & 98.0445799036604 \tabularnewline
41 & 99.320618871841 \tabularnewline
42 & 115.148376076700 \tabularnewline
43 & 130.421807563817 \tabularnewline
44 & 172.65571564099 \tabularnewline
45 & 182.470380793106 \tabularnewline
46 & 182.891267727916 \tabularnewline
47 & 188.558462082211 \tabularnewline
48 & 254.72856076033 \tabularnewline
49 & 320.25023469103 \tabularnewline
50 & 333.574297031748 \tabularnewline
51 & 334.891331545112 \tabularnewline
52 & 467.451853099401 \tabularnewline
53 & 486.638134936534 \tabularnewline
54 & 525.662150516458 \tabularnewline
55 & 582.389426488984 \tabularnewline
56 & 944.599626611977 \tabularnewline
57 & 966.756896711748 \tabularnewline
58 & 1202.39501240223 \tabularnewline
59 & 3381.28192838584 \tabularnewline
\hline
\end{tabular}
%Source: https://freestatistics.org/blog/index.php?pk=22883&T=1

[TABLE]
[ROW][C]Summary of Dendrogram[/C][/ROW]
[ROW][C]Label[/C][C]Height[/C][/ROW]
[ROW][C]1[/C][C]8.85494212290515[/C][/ROW]
[ROW][C]2[/C][C]10.2279030108816[/C][/ROW]
[ROW][C]3[/C][C]12.6996062931101[/C][/ROW]
[ROW][C]4[/C][C]15.8385605406553[/C][/ROW]
[ROW][C]5[/C][C]19.2359039298911[/C][/ROW]
[ROW][C]6[/C][C]24.1004149341873[/C][/ROW]
[ROW][C]7[/C][C]28.1475732839986[/C][/ROW]
[ROW][C]8[/C][C]28.6405307213397[/C][/ROW]
[ROW][C]9[/C][C]29.8832729131199[/C][/ROW]
[ROW][C]10[/C][C]30.4004934170485[/C][/ROW]
[ROW][C]11[/C][C]30.8047074324688[/C][/ROW]
[ROW][C]12[/C][C]31.5280827200132[/C][/ROW]
[ROW][C]13[/C][C]34.9322789588908[/C][/ROW]
[ROW][C]14[/C][C]35.1176389143834[/C][/ROW]
[ROW][C]15[/C][C]35.6008426866556[/C][/ROW]
[ROW][C]16[/C][C]36.5707863979078[/C][/ROW]
[ROW][C]17[/C][C]38.4613843571213[/C][/ROW]
[ROW][C]18[/C][C]39.1834708518015[/C][/ROW]
[ROW][C]19[/C][C]42.9543944201289[/C][/ROW]
[ROW][C]20[/C][C]43.3108531432943[/C][/ROW]
[ROW][C]21[/C][C]43.5639759434329[/C][/ROW]
[ROW][C]22[/C][C]44.6210549016530[/C][/ROW]
[ROW][C]23[/C][C]47.1841074939434[/C][/ROW]
[ROW][C]24[/C][C]51.038906728103[/C][/ROW]
[ROW][C]25[/C][C]53.0680694956959[/C][/ROW]
[ROW][C]26[/C][C]53.6888015539384[/C][/ROW]
[ROW][C]27[/C][C]55.1578643531456[/C][/ROW]
[ROW][C]28[/C][C]57.6835603709639[/C][/ROW]
[ROW][C]29[/C][C]59.4460935409873[/C][/ROW]
[ROW][C]30[/C][C]66.4627566779564[/C][/ROW]
[ROW][C]31[/C][C]68.5546497328957[/C][/ROW]
[ROW][C]32[/C][C]71.6705743709065[/C][/ROW]
[ROW][C]33[/C][C]73.3481828871525[/C][/ROW]
[ROW][C]34[/C][C]76.2674164099332[/C][/ROW]
[ROW][C]35[/C][C]77.2379440430673[/C][/ROW]
[ROW][C]36[/C][C]82.6471113345416[/C][/ROW]
[ROW][C]37[/C][C]89.454724127598[/C][/ROW]
[ROW][C]38[/C][C]89.9400046249197[/C][/ROW]
[ROW][C]39[/C][C]94.3906816738263[/C][/ROW]
[ROW][C]40[/C][C]98.0445799036604[/C][/ROW]
[ROW][C]41[/C][C]99.320618871841[/C][/ROW]
[ROW][C]42[/C][C]115.148376076700[/C][/ROW]
[ROW][C]43[/C][C]130.421807563817[/C][/ROW]
[ROW][C]44[/C][C]172.65571564099[/C][/ROW]
[ROW][C]45[/C][C]182.470380793106[/C][/ROW]
[ROW][C]46[/C][C]182.891267727916[/C][/ROW]
[ROW][C]47[/C][C]188.558462082211[/C][/ROW]
[ROW][C]48[/C][C]254.72856076033[/C][/ROW]
[ROW][C]49[/C][C]320.25023469103[/C][/ROW]
[ROW][C]50[/C][C]333.574297031748[/C][/ROW]
[ROW][C]51[/C][C]334.891331545112[/C][/ROW]
[ROW][C]52[/C][C]467.451853099401[/C][/ROW]
[ROW][C]53[/C][C]486.638134936534[/C][/ROW]
[ROW][C]54[/C][C]525.662150516458[/C][/ROW]
[ROW][C]55[/C][C]582.389426488984[/C][/ROW]
[ROW][C]56[/C][C]944.599626611977[/C][/ROW]
[ROW][C]57[/C][C]966.756896711748[/C][/ROW]
[ROW][C]58[/C][C]1202.39501240223[/C][/ROW]
[ROW][C]59[/C][C]3381.28192838584[/C][/ROW]
[/TABLE]
Source: https://freestatistics.org/blog/index.php?pk=22883&T=1

Globally Unique Identifier (entire table): ba.freestatistics.org/blog/index.php?pk=22883&T=1

As an alternative you can also use a QR Code:  

The GUIDs for individual cells are displayed in the table below:

Summary of Dendrogram
LabelHeight
18.85494212290515
210.2279030108816
312.6996062931101
415.8385605406553
519.2359039298911
624.1004149341873
728.1475732839986
828.6405307213397
929.8832729131199
1030.4004934170485
1130.8047074324688
1231.5280827200132
1334.9322789588908
1435.1176389143834
1535.6008426866556
1636.5707863979078
1738.4613843571213
1839.1834708518015
1942.9543944201289
2043.3108531432943
2143.5639759434329
2244.6210549016530
2347.1841074939434
2451.038906728103
2553.0680694956959
2653.6888015539384
2755.1578643531456
2857.6835603709639
2959.4460935409873
3066.4627566779564
3168.5546497328957
3271.6705743709065
3373.3481828871525
3476.2674164099332
3577.2379440430673
3682.6471113345416
3789.454724127598
3889.9400046249197
3994.3906816738263
4098.0445799036604
4199.320618871841
42115.148376076700
43130.421807563817
44172.65571564099
45182.470380793106
46182.891267727916
47188.558462082211
48254.72856076033
49320.25023469103
50333.574297031748
51334.891331545112
52467.451853099401
53486.638134936534
54525.662150516458
55582.389426488984
56944.599626611977
57966.756896711748
581202.39501240223
593381.28192838584


Parameters (Session):
par1 = ward ; par2 = ALL ; par3 = FALSE ; par4 = FALSE ;
Parameters (R input):
par1 = ward ; par2 = ALL ; par3 = FALSE ; par4 = FALSE ;
R code (references can be found in the software module):
par3 <- as.logical(par3)
par4 <- as.logical(par4)
if (par3 == 'TRUE'){
dum = xlab
xlab = ylab
ylab = dum
}
x <- t(y)
hc <- hclust(dist(x),method=par1)
d <- as.dendrogram(hc)
str(d)
mysub <- paste('Method: ',par1)
bitmap(file='test1.png')
if (par4 == 'TRUE'){
plot(d,main=main,ylab=ylab,xlab=xlab,horiz=par3, nodePar=list(pch = c(1,NA), cex=0.8, lab.cex = 0.8),type='t',center=T, sub=mysub)
} else {
plot(d,main=main,ylab=ylab,xlab=xlab,horiz=par3, nodePar=list(pch = c(1,NA), cex=0.8, lab.cex = 0.8), sub=mysub)
}
dev.off()
if (par2 != 'ALL'){
if (par3 == 'TRUE'){
ylab = 'cluster'
} else {
xlab = 'cluster'
}
par2 <- as.numeric(par2)
memb <- cutree(hc, k = par2)
cent <- NULL
for(k in 1:par2){
cent <- rbind(cent, colMeans(x[memb == k, , drop = FALSE]))
}
hc1 <- hclust(dist(cent),method=par1, members = table(memb))
de <- as.dendrogram(hc1)
bitmap(file='test2.png')
if (par4 == 'TRUE'){
plot(de,main=main,ylab=ylab,xlab=xlab,horiz=par3, nodePar=list(pch = c(1,NA), cex=0.8, lab.cex = 0.8),type='t',center=T, sub=mysub)
} else {
plot(de,main=main,ylab=ylab,xlab=xlab,horiz=par3, nodePar=list(pch = c(1,NA), cex=0.8, lab.cex = 0.8), sub=mysub)
}
dev.off()
str(de)
}
load(file='createtable')
a<-table.start()
a<-table.row.start(a)
a<-table.element(a,'Summary of Dendrogram',2,TRUE)
a<-table.row.end(a)
a<-table.row.start(a)
a<-table.element(a,'Label',header=TRUE)
a<-table.element(a,'Height',header=TRUE)
a<-table.row.end(a)
num <- length(x[,1])-1
for (i in 1:num)
{
a<-table.row.start(a)
a<-table.element(a,hc$labels[i])
a<-table.element(a,hc$height[i])
a<-table.row.end(a)
}
a<-table.end(a)
table.save(a,file='mytable1.tab')
if (par2 != 'ALL'){
a<-table.start()
a<-table.row.start(a)
a<-table.element(a,'Summary of Cut Dendrogram',2,TRUE)
a<-table.row.end(a)
a<-table.row.start(a)
a<-table.element(a,'Label',header=TRUE)
a<-table.element(a,'Height',header=TRUE)
a<-table.row.end(a)
num <- par2-1
for (i in 1:num)
{
a<-table.row.start(a)
a<-table.element(a,i)
a<-table.element(a,hc1$height[i])
a<-table.row.end(a)
}
a<-table.end(a)
table.save(a,file='mytable2.tab')
}