Free Statistics

of Irreproducible Research!

Author's title

Author*The author of this computation has been verified*
R Software Modulerwasp_cloud.wasp
Title produced by softwareTrivariate Scatterplots
Date of computationSun, 09 Nov 2008 10:53:04 -0700
Cite this page as followsStatistical Computations at FreeStatistics.org, Office for Research Development and Education, URL https://freestatistics.org/blog/index.php?v=date/2008/Nov/09/t12262534146gx32t7uwezbj9e.htm/, Retrieved Sun, 19 May 2024 12:18:03 +0000
Statistical Computations at FreeStatistics.org, Office for Research Development and Education, URL https://freestatistics.org/blog/index.php?pk=22797, Retrieved Sun, 19 May 2024 12:18:03 +0000
QR Codes:

Original text written by user:
IsPrivate?No (this computation is public)
User-defined keywords
Estimated Impact169
Family? (F = Feedback message, R = changed R code, M = changed R Module, P = changed Parameters, D = changed Data)
F       [Trivariate Scatterplots] [Uitvoer - Invoer ...] [2008-11-09 17:53:04] [54ae75b68e6a45c6d55fa4235827d5b3] [Current]
Feedback Forum
2008-11-22 10:03:08 [Astrid Sniekers] [reply
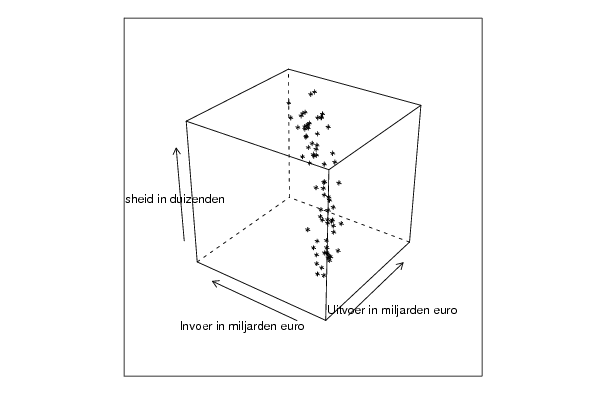
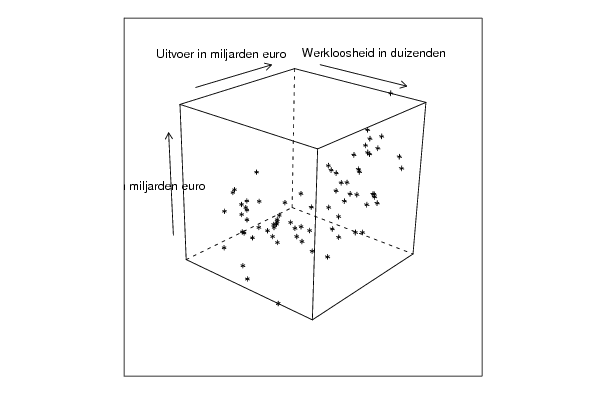
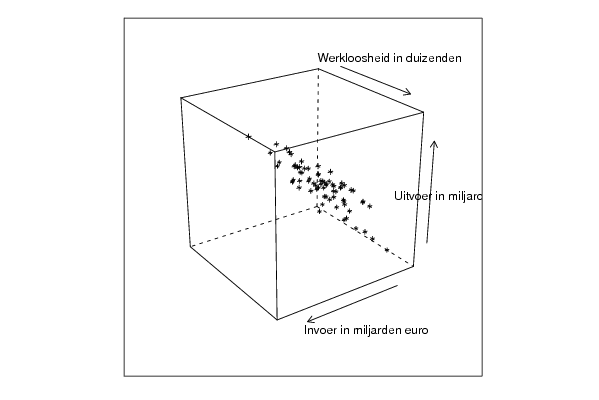
= 3-dimenstionale kubus op 2 dimensioneel scherm -> reductie
2 punten die op het scherm dicht bij elkaar liggen, kunnen in werkelijkheid ver van elkaar liggen.

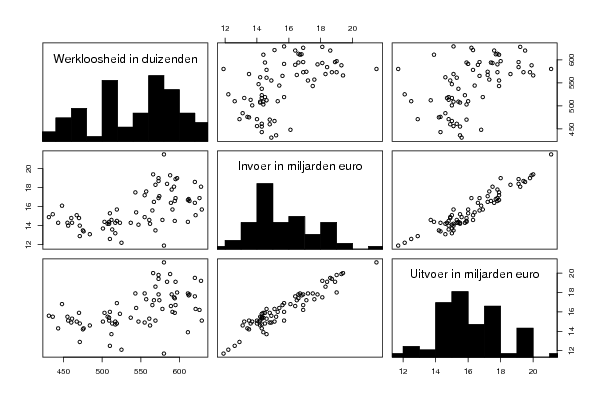
Boven hoofddiagonaal: scatterplots tussen 2 variabelen -> heel wat informatie wordt niet weergegeven -> men krijgt een vertekend beeld.
2008-11-24 19:10:04 [Liese Tormans] [reply
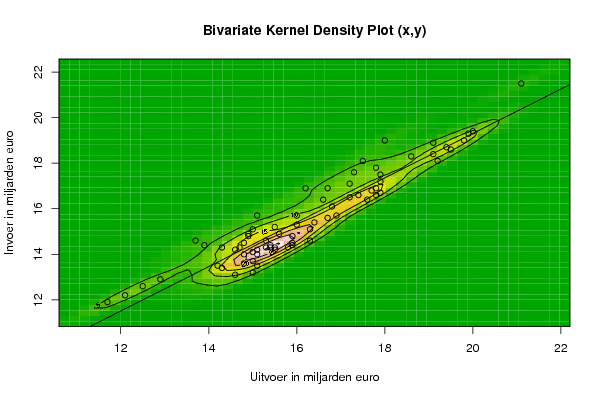
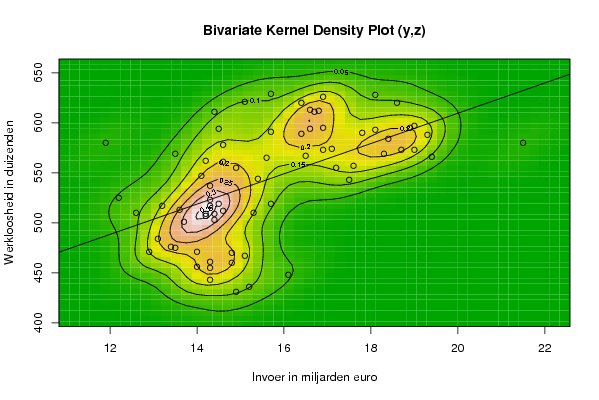
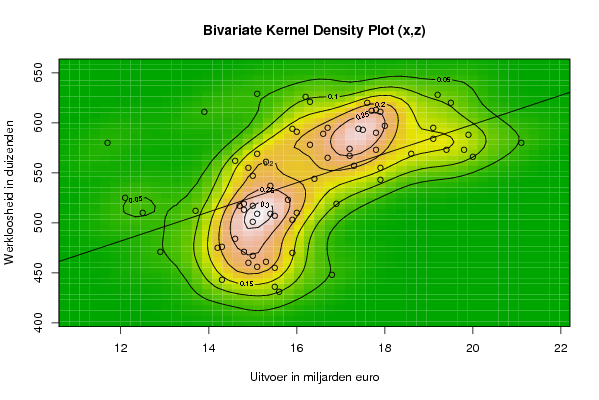
Aan de hand van de Trivariate Scatterplots is het niet eenvoudig een mooi patroon te vinden en een conclusie te trekken. Want de 3D voorstelling geeft een vertekend beeld op een 2D scherm. Daarnaast weet je niet hoe 3D zich uit tussen de afstand van de punten. De
Bivariate Density is een betere methode om te gaan kijken of er een verband is en of er eventuele clusters zijn.

Post a new message
Dataseries X:
15
14,9
16,8
14,3
15,5
15,6
14,6
12,5
14,8
15,9
14,8
12,9
14,3
14,2
15,9
15,3
15,5
15,1
15
12,1
15,8
16,9
15,1
13,7
14,8
14,7
16
15,4
15
15,5
15,1
11,7
16,3
16,7
15
14,9
14,6
15,3
17,9
16,4
15,4
17,9
15,9
13,9
17,8
17,9
17,4
16,7
16
16,6
19,1
17,8
17,2
18,6
16,3
15,1
19,2
17,7
19,1
18
17,5
17,8
21,1
17,2
19,4
19,8
17,6
16,2
19,5
19,9
20
17,3
Dataseries Y:
15,1
14,8
16,1
14,3
15,2
14,9
13,1
12,6
13,6
14,4
14
12,9
13,4
13,5
14,8
14,3
14,3
14
13,2
12,2
14,3
15,7
14,2
14,6
14,5
14,3
15,3
14,4
13,7
14,2
13,5
11,9
14,6
15,6
14,1
14,9
14,2
14,6
17,2
15,4
14,3
17,5
14,5
14,4
16,6
16,7
16,6
16,9
15,7
16,4
18,4
16,9
16,5
18,3
15,1
15,7
18,1
16,8
18,9
19
18,1
17,8
21,5
17,1
18,7
19
16,4
16,9
18,6
19,3
19,4
17,6
Dataseries Z:
467
460
448
443
436
431
484
510
513
503
471
471
476
475
470
461
455
456
517
525
523
519
509
512
519
517
510
509
501
507
569
580
578
565
547
555
562
561
555
544
537
543
594
611
613
611
594
595
591
589
584
573
567
569
621
629
628
612
595
597
593
590
580
574
573
573
620
626
620
588
566
557


Summary of computational transaction
Raw Inputview raw input (R code)
Raw Outputview raw output of R engine
Computing time5 seconds
R Server'Herman Ole Andreas Wold' @ 193.190.124.10:1001

\begin{tabular}{lllllllll}
\hline
Summary of computational transaction \tabularnewline
Raw Input & view raw input (R code)  \tabularnewline
Raw Output & view raw output of R engine  \tabularnewline
Computing time & 5 seconds \tabularnewline
R Server & 'Herman Ole Andreas Wold' @ 193.190.124.10:1001 \tabularnewline
\hline
\end{tabular}
%Source: https://freestatistics.org/blog/index.php?pk=22797&T=0

[TABLE]
[ROW][C]Summary of computational transaction[/C][/ROW]
[ROW][C]Raw Input[/C][C]view raw input (R code) [/C][/ROW]
[ROW][C]Raw Output[/C][C]view raw output of R engine [/C][/ROW]
[ROW][C]Computing time[/C][C]5 seconds[/C][/ROW]
[ROW][C]R Server[/C][C]'Herman Ole Andreas Wold' @ 193.190.124.10:1001[/C][/ROW]
[/TABLE]
Source: https://freestatistics.org/blog/index.php?pk=22797&T=0

Globally Unique Identifier (entire table): ba.freestatistics.org/blog/index.php?pk=22797&T=0

As an alternative you can also use a QR Code:  

The GUIDs for individual cells are displayed in the table below:

Summary of computational transaction
Raw Inputview raw input (R code)
Raw Outputview raw output of R engine
Computing time5 seconds
R Server'Herman Ole Andreas Wold' @ 193.190.124.10:1001


Parameters (Session):
par1 = 50 ; par2 = 50 ; par3 = Y ; par4 = Y ; par5 = Uitvoer in miljarden euro ; par6 = Invoer in miljarden euro ; par7 = Werkloosheid in duizenden ;
Parameters (R input):
par1 = 50 ; par2 = 50 ; par3 = Y ; par4 = Y ; par5 = Uitvoer in miljarden euro ; par6 = Invoer in miljarden euro ; par7 = Werkloosheid in duizenden ;
R code (references can be found in the software module):
x <- array(x,dim=c(length(x),1))
colnames(x) <- par5
y <- array(y,dim=c(length(y),1))
colnames(y) <- par6
z <- array(z,dim=c(length(z),1))
colnames(z) <- par7
d <- data.frame(cbind(z,y,x))
colnames(d) <- list(par7,par6,par5)
par1 <- as.numeric(par1)
par2 <- as.numeric(par2)
if (par1>500) par1 <- 500
if (par2>500) par2 <- 500
if (par1<10) par1 <- 10
if (par2<10) par2 <- 10
library(GenKern)
library(lattice)
panel.hist <- function(x, ...)
{
usr <- par('usr'); on.exit(par(usr))
par(usr = c(usr[1:2], 0, 1.5) )
h <- hist(x, plot = FALSE)
breaks <- h$breaks; nB <- length(breaks)
y <- h$counts; y <- y/max(y)
rect(breaks[-nB], 0, breaks[-1], y, col='black', ...)
}
bitmap(file='cloud1.png')
cloud(z~x*y, screen = list(x=-45, y=45, z=35),xlab=par5,ylab=par6,zlab=par7)
dev.off()
bitmap(file='cloud2.png')
cloud(z~x*y, screen = list(x=35, y=45, z=25),xlab=par5,ylab=par6,zlab=par7)
dev.off()
bitmap(file='cloud3.png')
cloud(z~x*y, screen = list(x=35, y=-25, z=90),xlab=par5,ylab=par6,zlab=par7)
dev.off()
bitmap(file='pairs.png')
pairs(d,diag.panel=panel.hist)
dev.off()
x <- as.vector(x)
y <- as.vector(y)
z <- as.vector(z)
bitmap(file='bidensity1.png')
op <- KernSur(x,y, xgridsize=par1, ygridsize=par2, correlation=cor(x,y), xbandwidth=dpik(x), ybandwidth=dpik(y))
image(op$xords, op$yords, op$zden, col=terrain.colors(100), axes=TRUE,main='Bivariate Kernel Density Plot (x,y)',xlab=par5,ylab=par6)
if (par3=='Y') contour(op$xords, op$yords, op$zden, add=TRUE)
if (par4=='Y') points(x,y)
(r<-lm(y ~ x))
abline(r)
box()
dev.off()
bitmap(file='bidensity2.png')
op <- KernSur(y,z, xgridsize=par1, ygridsize=par2, correlation=cor(y,z), xbandwidth=dpik(y), ybandwidth=dpik(z))
op
image(op$xords, op$yords, op$zden, col=terrain.colors(100), axes=TRUE,main='Bivariate Kernel Density Plot (y,z)',xlab=par6,ylab=par7)
if (par3=='Y') contour(op$xords, op$yords, op$zden, add=TRUE)
if (par4=='Y') points(y,z)
(r<-lm(z ~ y))
abline(r)
box()
dev.off()
bitmap(file='bidensity3.png')
op <- KernSur(x,z, xgridsize=par1, ygridsize=par2, correlation=cor(x,z), xbandwidth=dpik(x), ybandwidth=dpik(z))
op
image(op$xords, op$yords, op$zden, col=terrain.colors(100), axes=TRUE,main='Bivariate Kernel Density Plot (x,z)',xlab=par5,ylab=par7)
if (par3=='Y') contour(op$xords, op$yords, op$zden, add=TRUE)
if (par4=='Y') points(x,z)
(r<-lm(z ~ x))
abline(r)
box()
dev.off()