Free Statistics

of Irreproducible Research!

Author's title

Author*Unverified author*
R Software Modulerwasp_boxcoxlin.wasp
Title produced by softwareBox-Cox Linearity Plot
Date of computationSun, 09 Nov 2008 09:56:36 -0700
Cite this page as followsStatistical Computations at FreeStatistics.org, Office for Research Development and Education, URL https://freestatistics.org/blog/index.php?v=date/2008/Nov/09/t12262499658vv8x372tjltpac.htm/, Retrieved Sun, 19 May 2024 09:24:23 +0000
Statistical Computations at FreeStatistics.org, Office for Research Development and Education, URL https://freestatistics.org/blog/index.php?pk=22780, Retrieved Sun, 19 May 2024 09:24:23 +0000
QR Codes:

Original text written by user:
IsPrivate?No (this computation is public)
User-defined keywordsVan Dooren Leen
Estimated Impact151
Family? (F = Feedback message, R = changed R code, M = changed R Module, P = changed Parameters, D = changed Data)
F       [Box-Cox Linearity Plot] [Various EDA topic...] [2008-11-09 16:56:36] [d175f84d503eb4f2a43145d5e67795b5] [Current]
F   PD    [Box-Cox Linearity Plot] [Various EDA topic...] [2008-11-12 15:01:01] [9c2d53170eb755e9ae5fcf19d2174a32]
Feedback Forum
2008-11-16 15:41:29 [Steven Vercammen] [reply
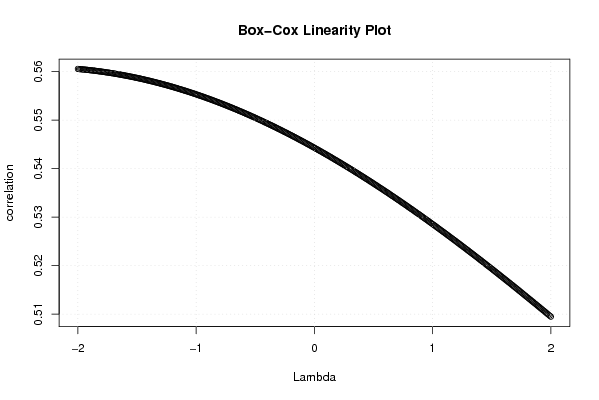
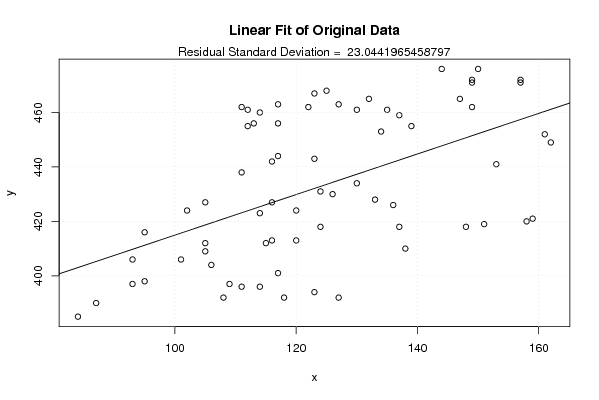
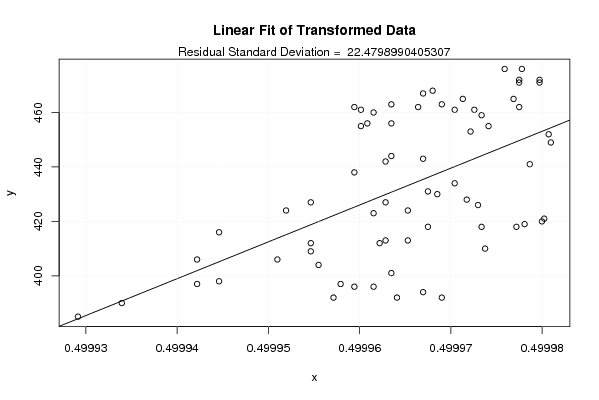
De studente mag dit veel uitgebreider bespreken. Enkel de box-cox linearity plot zelf wordt weergegeven maar ook de scatterplots zijn de moeite waarde om op te nemen in de oplossing. In het e-hanboek vinden we dat het doel van de Box-cox transformatie is om de X variabele te transformeren zodat de correlatie met de Y variabele maximaal wordt. “Transformations can often significantly improve a fit. The Box-Cox linearity plot provides a convenient way to find a suitable transformation without engaging in a lot of trial and error fitting.” De formule die wordt toegepast is T(X) = (X^lambda -1) / lambda. Waarbij X de variabele is die getransformeerd wordt en lambda de transformatieparameter. Als lambda echter 0 is dan wordt ipv deze formule de natuurlijke logaritme van data gebruikt. De box-coxlinearity plot geeft aan welke waarde van lambda nodig is opdat de transformatie een optimaal effect heeft. Men moet echter ook kijken naar het verschil in correlatie voor en na transformatie. Dit kunnen we nagaan door de scatterplots voor en na transformatie te vergelijken. In dit geval lijkt lambda -2 de beste tranformatie op te leveren de verbetering in correlatie is echter zeer beperkt.

2008-11-16 16:00:18 [074508d5a5a3592082de3e836d27af7d] [reply
De conclusie van de student is fout. De samenhang is helemaal niet verbeterd. Je kan de correlatie op de y-as aflezen. Deze schommelt tussen 0.51 en 0.56, dus dit is bijna niets. De transformatie heeft dus bijna geen effect. En op de X-as is het zeer duidelijk dat er nog geen maximum bereikt is.
2008-11-16 16:35:55 [006ad2c49b6a7c2ad6ab685cfc1dae56] [reply
De Box-Cox linearity plot is een transformatie die gebruikt wordt om de scatterplots van de gegevens lineairder te maken. De bedoeling is dat je uiteindelijk een curve te zien krijgt die ergens een maximum vertoont. Dit maximum komt overeen met de beste transformatie. In dit geval wordt er een maximum bereikt bij lambda=-2. Deze waarde voor lambda geeft dus de beste transformatie.

2008-11-19 10:56:26 [Toon Wouters] [reply
Het is moeilijk om deze berekening te interpreteren. 2 variabelen worden in verband met elkaar gebracht in de scatterplot. Doormiddel van de scatterplot te transformeren en lineair te maken verkrijgt men de box-cox lineairity plot. En dan te hopen dat de curve een maximum vertoont. Hier kunnen we concluderen dat voor lambda gelijk aan -2 de optimale correlatie is
2008-11-24 11:50:59 [Anouk Greeve] [reply
We gaan hier op zoek naar de beste transformatie van een niet zo lineaire rechte naar een lineaire rechte. De Box-Cox Linearity plot is een plot dat de correlatie tussen Y en de veranderlijke X weergeeft, voor gegeven waarden van de lambda. De waarde die het best beantwoordt aan de maximumcorrelatie (of minimum voor negatieve correlatie) in de plot is de optimale keuze voor de lambda. De correlatie hier is miniem. De transformatie heeft dus bijna geen effect.

Post a new message
Dataseries X:
127
123
118
114
108
111
151
159
158
148
138
137
136
133
126
120
114
116
153
162
161
149
139
135
130
127
122
117
112
113
149
157
157
147
137
132
125
123
117
114
111
112
144
150
149
134
123
116
117
111
105
102
95
93
124
130
124
115
106
105
105
101
95
93
84
87
116
120
117
109
Dataseries Y:
392
394
392
396
392
396
419
421
420
418
410
418
426
428
430
424
423
427
441
449
452
462
455
461
461
463
462
456
455
456
472
472
471
465
459
465
468
467
463
460
462
461
476
476
471
453
443
442
444
438
427
424
416
406
431
434
418
412
404
409
412
406
398
397
385
390
413
413
401
397


Summary of computational transaction
Raw Inputview raw input (R code)
Raw Outputview raw output of R engine
Computing time2 seconds
R Server'Sir Ronald Aylmer Fisher' @ 193.190.124.24

\begin{tabular}{lllllllll}
\hline
Summary of computational transaction \tabularnewline
Raw Input & view raw input (R code)  \tabularnewline
Raw Output & view raw output of R engine  \tabularnewline
Computing time & 2 seconds \tabularnewline
R Server & 'Sir Ronald Aylmer Fisher' @ 193.190.124.24 \tabularnewline
\hline
\end{tabular}
%Source: https://freestatistics.org/blog/index.php?pk=22780&T=0

[TABLE]
[ROW][C]Summary of computational transaction[/C][/ROW]
[ROW][C]Raw Input[/C][C]view raw input (R code) [/C][/ROW]
[ROW][C]Raw Output[/C][C]view raw output of R engine [/C][/ROW]
[ROW][C]Computing time[/C][C]2 seconds[/C][/ROW]
[ROW][C]R Server[/C][C]'Sir Ronald Aylmer Fisher' @ 193.190.124.24[/C][/ROW]
[/TABLE]
Source: https://freestatistics.org/blog/index.php?pk=22780&T=0

Globally Unique Identifier (entire table): ba.freestatistics.org/blog/index.php?pk=22780&T=0

As an alternative you can also use a QR Code:  

The GUIDs for individual cells are displayed in the table below:

Summary of computational transaction
Raw Inputview raw input (R code)
Raw Outputview raw output of R engine
Computing time2 seconds
R Server'Sir Ronald Aylmer Fisher' @ 193.190.124.24


Box-Cox Linearity Plot
# observations x70
maximum correlation0.560565531288052
optimal lambda(x)-2
Residual SD (orginial)23.0441965458797
Residual SD (transformed)22.4798990405307

\begin{tabular}{lllllllll}
\hline
Box-Cox Linearity Plot \tabularnewline
# observations x & 70 \tabularnewline
maximum correlation & 0.560565531288052 \tabularnewline
optimal lambda(x) & -2 \tabularnewline
Residual SD (orginial) & 23.0441965458797 \tabularnewline
Residual SD (transformed) & 22.4798990405307 \tabularnewline
\hline
\end{tabular}
%Source: https://freestatistics.org/blog/index.php?pk=22780&T=1

[TABLE]
[ROW][C]Box-Cox Linearity Plot[/C][/ROW]
[ROW][C]# observations x[/C][C]70[/C][/ROW]
[ROW][C]maximum correlation[/C][C]0.560565531288052[/C][/ROW]
[ROW][C]optimal lambda(x)[/C][C]-2[/C][/ROW]
[ROW][C]Residual SD (orginial)[/C][C]23.0441965458797[/C][/ROW]
[ROW][C]Residual SD (transformed)[/C][C]22.4798990405307[/C][/ROW]
[/TABLE]
Source: https://freestatistics.org/blog/index.php?pk=22780&T=1

Globally Unique Identifier (entire table): ba.freestatistics.org/blog/index.php?pk=22780&T=1

As an alternative you can also use a QR Code:  

The GUIDs for individual cells are displayed in the table below:

Box-Cox Linearity Plot
# observations x70
maximum correlation0.560565531288052
optimal lambda(x)-2
Residual SD (orginial)23.0441965458797
Residual SD (transformed)22.4798990405307


Parameters (Session):
par1 = 50 ; par2 = 50 ; par3 = 0 ; par4 = 0 ; par5 = 0 ; par6 = Y ; par7 = Y ;
Parameters (R input):
R code (references can be found in the software module):
n <- length(x)
c <- array(NA,dim=c(401))
l <- array(NA,dim=c(401))
mx <- 0
mxli <- -999
for (i in 1:401)
{
l[i] <- (i-201)/100
if (l[i] != 0)
{
x1 <- (x^l[i] - 1) / l[i]
} else {
x1 <- log(x)
}
c[i] <- cor(x1,y)
if (mx < abs(c[i]))
{
mx <- abs(c[i])
mxli <- l[i]
}
}
c
mx
mxli
if (mxli != 0)
{
x1 <- (x^mxli - 1) / mxli
} else {
x1 <- log(x)
}
r<-lm(y~x)
se <- sqrt(var(r$residuals))
r1 <- lm(y~x1)
se1 <- sqrt(var(r1$residuals))
bitmap(file='test1.png')
plot(l,c,main='Box-Cox Linearity Plot',xlab='Lambda',ylab='correlation')
grid()
dev.off()
bitmap(file='test2.png')
plot(x,y,main='Linear Fit of Original Data',xlab='x',ylab='y')
abline(r)
grid()
mtext(paste('Residual Standard Deviation = ',se))
dev.off()
bitmap(file='test3.png')
plot(x1,y,main='Linear Fit of Transformed Data',xlab='x',ylab='y')
abline(r1)
grid()
mtext(paste('Residual Standard Deviation = ',se1))
dev.off()
load(file='createtable')
a<-table.start()
a<-table.row.start(a)
a<-table.element(a,'Box-Cox Linearity Plot',2,TRUE)
a<-table.row.end(a)
a<-table.row.start(a)
a<-table.element(a,'# observations x',header=TRUE)
a<-table.element(a,n)
a<-table.row.end(a)
a<-table.row.start(a)
a<-table.element(a,'maximum correlation',header=TRUE)
a<-table.element(a,mx)
a<-table.row.end(a)
a<-table.row.start(a)
a<-table.element(a,'optimal lambda(x)',header=TRUE)
a<-table.element(a,mxli)
a<-table.row.end(a)
a<-table.row.start(a)
a<-table.element(a,'Residual SD (orginial)',header=TRUE)
a<-table.element(a,se)
a<-table.row.end(a)
a<-table.row.start(a)
a<-table.element(a,'Residual SD (transformed)',header=TRUE)
a<-table.element(a,se1)
a<-table.row.end(a)
a<-table.end(a)
table.save(a,file='mytable.tab')