Free Statistics

of Irreproducible Research!

Author's title

Author*Unverified author*
R Software Modulerwasp_bidensity.wasp
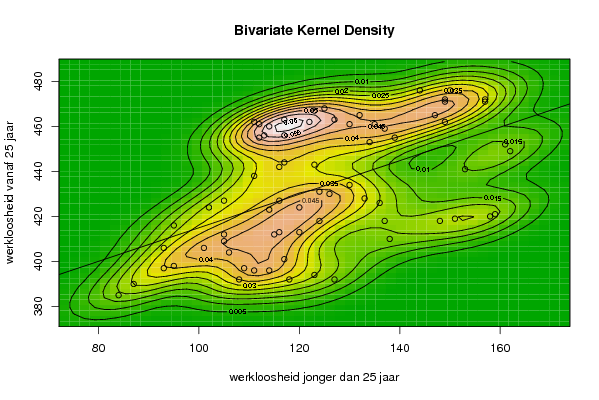
Title produced by softwareBivariate Kernel Density Estimation
Date of computationSun, 09 Nov 2008 08:54:02 -0700
Cite this page as followsStatistical Computations at FreeStatistics.org, Office for Research Development and Education, URL https://freestatistics.org/blog/index.php?v=date/2008/Nov/09/t1226246119gzblc4zdsy6nyzw.htm/, Retrieved Sun, 19 May 2024 09:25:55 +0000
Statistical Computations at FreeStatistics.org, Office for Research Development and Education, URL https://freestatistics.org/blog/index.php?pk=22765, Retrieved Sun, 19 May 2024 09:25:55 +0000
QR Codes:

Original text written by user:
IsPrivate?No (this computation is public)
User-defined keywordsVan Dooren Leen
Estimated Impact208
Family? (F = Feedback message, R = changed R code, M = changed R Module, P = changed Parameters, D = changed Data)
F       [Bivariate Kernel Density Estimation] [various EDA topic...] [2008-11-09 15:54:02] [d175f84d503eb4f2a43145d5e67795b5] [Current]
Feedback Forum
2008-11-16 14:19:23 [Steven Vercammen] [reply
Er wordt een goede conclusie getrokken, maar de betekenis van de Bivariate Kernel Density wordt niet volledig uitgelegd. De grafiek kan gebruikt worden om na te gaan of er sprake is van correlatie tussen de 2 variabelen. Het voordeel dat deze grafiek heeft ten opzichte van de gewone scatterplot is dat door de hoogtelijnen een soort van derde dimensie wordt weergegeven. Deze geeft de dichtheid van de observaties weer. Men kan dus zien waar de meeste observaties zich bevinden tov van de regressielijn. In dit geval lijkt er sprake te zijn van een positieve correlatie. We kunnen wel duidelijk 2 clusters waarnemen: eentje boven en eentje onder de regressierechte.
2008-11-16 15:46:47 [074508d5a5a3592082de3e836d27af7d] [reply
Er worden goede conclusies gegeven maar de voor-en nadelen van de verschillende methoden worden niet gegeven. Bij de Trivarate scatterplot willen we het verband tussen 3 variabelen gelijktijdig onderzoeken. De 3 kubussen zijn vertekend door de manier van projecteren, daarom kijken we beter naar de matrix. Hier zijn bepaalde dimensies ook vertekend omdat de 3de dimensie er niet bijstaat. Dus kunnen we beter naar de Bivariate Kernel density plot kijken. De hoogtelijnen stellen de dichtheid voor, en wanneer ze dicht op de lijn liggen is de correlatie hoog. Het voordeel dat deze grafiek heeft ten opzichte van de gewone scatterplot is dat door de hoogtelijnen een soort van derde dimensie wordt weergegeven.
2008-11-16 16:17:20 [006ad2c49b6a7c2ad6ab685cfc1dae56] [reply
De berekeningen zijn juist maar de uitleg die gegeven wordt is onvoldoende. Er wordt niets gezegd over de correlatie. De twee clusters van gegevens hebben een positieve correlatie omdat ze gegroepeerd zijn in een ellips die naar boven gericht is.
2008-11-19 10:24:52 [Toon Wouters] [reply
De lijn in de grafiek stelt de regressielijn voor. De hoogtelijnen stellen de concentratie van de puntenwolken voor. De waarschijnlijkheid is het grootst op de middelste hoogtelijnen. Uit deze grafiek kunnen we concluderen dat de gevormde figuren ellipsvormig zijn en dat ze van links onder naar rechts boven wijzen wat wil zeggen dat er een possitief verband is. Indien de figuren cirkelvormig waren, wees dit op minder verband
2008-11-24 11:34:09 [Anouk Greeve] [reply
Er had meer informatie mogen weergegeven worden. In de bivariate Kernel density plot worden er 3 dimensies gesuggereerd door de hoogtelijnen.
de hoogtelijnen hebben te maken met de dichtheid van de punten. wanneer deze hoog is, is de waarschijnlijkheid in het midden hoger dan die van de buitenrand

Post a new message
Dataseries X:
127
123
118
114
108
111
151
159
158
148
138
137
136
133
126
120
114
116
153
162
161
149
139
135
130
127
122
117
112
113
149
157
157
147
137
132
125
123
117
114
111
112
144
150
149
134
123
116
117
111
105
102
95
93
124
130
124
115
106
105
105
101
95
93
84
87
116
120
117
109
Dataseries Y:
392
394
392
396
392
396
419
421
420
418
410
418
426
428
430
424
423
427
441
449
452
462
455
461
461
463
462
456
455
456
472
472
471
465
459
465
468
467
463
460
462
461
476
476
471
453
443
442
444
438
427
424
416
406
431
434
418
412
404
409
412
406
398
397
385
390
413
413
401
397


Summary of computational transaction
Raw Inputview raw input (R code)
Raw Outputview raw output of R engine
Computing time3 seconds
R Server'Sir Ronald Aylmer Fisher' @ 193.190.124.24

\begin{tabular}{lllllllll}
\hline
Summary of computational transaction \tabularnewline
Raw Input & view raw input (R code)  \tabularnewline
Raw Output & view raw output of R engine  \tabularnewline
Computing time & 3 seconds \tabularnewline
R Server & 'Sir Ronald Aylmer Fisher' @ 193.190.124.24 \tabularnewline
\hline
\end{tabular}
%Source: https://freestatistics.org/blog/index.php?pk=22765&T=0

[TABLE]
[ROW][C]Summary of computational transaction[/C][/ROW]
[ROW][C]Raw Input[/C][C]view raw input (R code) [/C][/ROW]
[ROW][C]Raw Output[/C][C]view raw output of R engine [/C][/ROW]
[ROW][C]Computing time[/C][C]3 seconds[/C][/ROW]
[ROW][C]R Server[/C][C]'Sir Ronald Aylmer Fisher' @ 193.190.124.24[/C][/ROW]
[/TABLE]
Source: https://freestatistics.org/blog/index.php?pk=22765&T=0

Globally Unique Identifier (entire table): ba.freestatistics.org/blog/index.php?pk=22765&T=0

As an alternative you can also use a QR Code:  

The GUIDs for individual cells are displayed in the table below:

Summary of computational transaction
Raw Inputview raw input (R code)
Raw Outputview raw output of R engine
Computing time3 seconds
R Server'Sir Ronald Aylmer Fisher' @ 193.190.124.24


Bandwidth
x axis7.23193350453536
y axis8.4902323662409
Correlation
correlation used in KDE0.528557426433485
correlation(x,y)0.528557426433485

\begin{tabular}{lllllllll}
\hline
Bandwidth \tabularnewline
x axis & 7.23193350453536 \tabularnewline
y axis & 8.4902323662409 \tabularnewline
Correlation \tabularnewline
correlation used in KDE & 0.528557426433485 \tabularnewline
correlation(x,y) & 0.528557426433485 \tabularnewline
\hline
\end{tabular}
%Source: https://freestatistics.org/blog/index.php?pk=22765&T=1

[TABLE]
[ROW][C]Bandwidth[/C][/ROW]
[ROW][C]x axis[/C][C]7.23193350453536[/C][/ROW]
[ROW][C]y axis[/C][C]8.4902323662409[/C][/ROW]
[ROW][C]Correlation[/C][/ROW]
[ROW][C]correlation used in KDE[/C][C]0.528557426433485[/C][/ROW]
[ROW][C]correlation(x,y)[/C][C]0.528557426433485[/C][/ROW]
[/TABLE]
Source: https://freestatistics.org/blog/index.php?pk=22765&T=1

Globally Unique Identifier (entire table): ba.freestatistics.org/blog/index.php?pk=22765&T=1

As an alternative you can also use a QR Code:  

The GUIDs for individual cells are displayed in the table below:

Bandwidth
x axis7.23193350453536
y axis8.4902323662409
Correlation
correlation used in KDE0.528557426433485
correlation(x,y)0.528557426433485


Parameters (Session):
par1 = 50 ; par2 = 50 ; par3 = 0 ; par4 = 0 ; par5 = 0 ; par6 = Y ; par7 = Y ;
Parameters (R input):
par1 = 50 ; par2 = 50 ; par3 = 0 ; par4 = 0 ; par5 = 0 ; par6 = Y ; par7 = Y ;
R code (references can be found in the software module):
par1 <- as(par1,'numeric')
par2 <- as(par2,'numeric')
par3 <- as(par3,'numeric')
par4 <- as(par4,'numeric')
par5 <- as(par5,'numeric')
library('GenKern')
if (par3==0) par3 <- dpik(x)
if (par4==0) par4 <- dpik(y)
if (par5==0) par5 <- cor(x,y)
if (par1 > 500) par1 <- 500
if (par2 > 500) par2 <- 500
bitmap(file='bidensity.png')
op <- KernSur(x,y, xgridsize=par1, ygridsize=par2, correlation=par5, xbandwidth=par3, ybandwidth=par4)
image(op$xords, op$yords, op$zden, col=terrain.colors(100), axes=TRUE,main=main,xlab=xlab,ylab=ylab)
if (par6=='Y') contour(op$xords, op$yords, op$zden, add=TRUE)
if (par7=='Y') points(x,y)
(r<-lm(y ~ x))
abline(r)
box()
dev.off()
load(file='createtable')
a<-table.start()
a<-table.row.start(a)
a<-table.element(a,'Bandwidth',2,TRUE)
a<-table.row.end(a)
a<-table.row.start(a)
a<-table.element(a,'x axis',header=TRUE)
a<-table.element(a,par3)
a<-table.row.end(a)
a<-table.row.start(a)
a<-table.element(a,'y axis',header=TRUE)
a<-table.element(a,par4)
a<-table.row.end(a)
a<-table.row.start(a)
a<-table.element(a,'Correlation',2,TRUE)
a<-table.row.end(a)
a<-table.row.start(a)
a<-table.element(a,'correlation used in KDE',header=TRUE)
a<-table.element(a,par5)
a<-table.row.end(a)
a<-table.row.start(a)
a<-table.element(a,'correlation(x,y)',header=TRUE)
a<-table.element(a,cor(x,y))
a<-table.row.end(a)
a<-table.end(a)
table.save(a,file='mytable.tab')