Free Statistics
of Irreproducible Research!
Description of Statistical Computation | |||||||||||||||||||||||||||||||||||||||||||||
|---|---|---|---|---|---|---|---|---|---|---|---|---|---|---|---|---|---|---|---|---|---|---|---|---|---|---|---|---|---|---|---|---|---|---|---|---|---|---|---|---|---|---|---|---|---|
| Author's title | |||||||||||||||||||||||||||||||||||||||||||||
| Author | *Unverified author* | ||||||||||||||||||||||||||||||||||||||||||||
| R Software Module | rwasp_bidensity.wasp | ||||||||||||||||||||||||||||||||||||||||||||
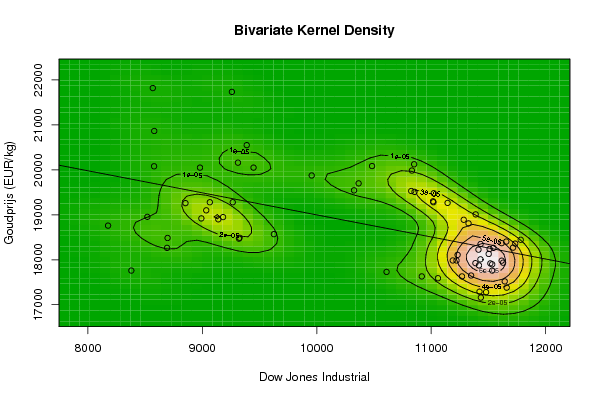
| Title produced by software | Bivariate Kernel Density Estimation | ||||||||||||||||||||||||||||||||||||||||||||
| Date of computation | Sun, 09 Nov 2008 06:17:45 -0700 | ||||||||||||||||||||||||||||||||||||||||||||
| Cite this page as follows | Statistical Computations at FreeStatistics.org, Office for Research Development and Education, URL https://freestatistics.org/blog/index.php?v=date/2008/Nov/09/t1226236764u6i30b2hlufev1k.htm/, Retrieved Sun, 19 May 2024 09:40:42 +0000 | ||||||||||||||||||||||||||||||||||||||||||||
| Statistical Computations at FreeStatistics.org, Office for Research Development and Education, URL https://freestatistics.org/blog/index.php?pk=22744, Retrieved Sun, 19 May 2024 09:40:42 +0000 | |||||||||||||||||||||||||||||||||||||||||||||
| QR Codes: | |||||||||||||||||||||||||||||||||||||||||||||
|
| |||||||||||||||||||||||||||||||||||||||||||||
| Original text written by user: | |||||||||||||||||||||||||||||||||||||||||||||
| IsPrivate? | No (this computation is public) | ||||||||||||||||||||||||||||||||||||||||||||
| User-defined keywords | Van Dooren Leen | ||||||||||||||||||||||||||||||||||||||||||||
| Estimated Impact | 197 | ||||||||||||||||||||||||||||||||||||||||||||
Tree of Dependent Computations | |||||||||||||||||||||||||||||||||||||||||||||
| Family? (F = Feedback message, R = changed R code, M = changed R Module, P = changed Parameters, D = changed Data) | |||||||||||||||||||||||||||||||||||||||||||||
| - [Bivariate Kernel Density Estimation] [Variuos EDA topic...] [2008-11-09 13:17:45] [d175f84d503eb4f2a43145d5e67795b5] [Current] - D [Bivariate Kernel Density Estimation] [various EDA topic...] [2008-11-12 17:59:56] [9ea94c8297ec7e569f27218c1d8ea30f] F D [Bivariate Kernel Density Estimation] [various EDA topic...] [2008-11-12 18:30:35] [9ea94c8297ec7e569f27218c1d8ea30f] F RMPD [Partial Correlation] [various EDA topic...] [2008-11-12 18:35:28] [9ea94c8297ec7e569f27218c1d8ea30f] F RMPD [Trivariate Scatterplots] [various EDA topic...] [2008-11-12 18:39:40] [9ea94c8297ec7e569f27218c1d8ea30f] F RMPD [Hierarchical Clustering] [various EDA topic...] [2008-11-12 18:44:29] [9ea94c8297ec7e569f27218c1d8ea30f] F RMPD [Box-Cox Linearity Plot] [various EDA topic...] [2008-11-12 18:47:38] [9ea94c8297ec7e569f27218c1d8ea30f] | |||||||||||||||||||||||||||||||||||||||||||||
| Feedback Forum | |||||||||||||||||||||||||||||||||||||||||||||
Post a new message | |||||||||||||||||||||||||||||||||||||||||||||
Dataset | |||||||||||||||||||||||||||||||||||||||||||||
| Dataseries X: | |||||||||||||||||||||||||||||||||||||||||||||
11326,32 11284,15 11615,77 11656,07 11431,43 11734,32 11782,35 11642,47 11532,96 11615,93 11659,9 11479,39 11348,55 11417,43 11430,21 11628,06 11386,25 11412,87 11502,51 11715,18 11543,55 11516,92 11532,88 11188,23 11220,96 11510,74 11230,73 11268,92 11433,71 11421,99 10917,51 11059,02 10609,66 11019,69 11388,44 11015,69 10854,17 10825,17 11022,06 11143,13 10365,45 10850,66 10831,07 10482,85 10325,38 9955,5 9447,11 9258,1 8579,19 8566,6 9387,61 9310,99 8577,91 8979,26 8852,22 9265,43 9033,66 8519,21 8691,25 8378,95 8175,77 9065,12 8990,96 9180,69 9325,01 9319,83 9625,28 9139,27 8695,79 | |||||||||||||||||||||||||||||||||||||||||||||
| Dataseries Y: | |||||||||||||||||||||||||||||||||||||||||||||
18810 18890 18370 18405 18350 18360 18445 17520 17760 17980 17380 17280 17650 17875 18010 17935 17925 18225 18130 18270 18265 17920 17900 17985 17985 18240 18110 17630 17160 17290 17630 17590 17730 19280 19010 19300 19510 19530 19480 19265 19700 20125 19985 20085 19545 19875 20050 21735 20865 21820 20550 20160 20080 20050 19260 19280 19100 18955 18265 17760 18760 19280 18920 18950 18490 18470 18570 18900 18485 | |||||||||||||||||||||||||||||||||||||||||||||
Tables (Output of Computation) | |||||||||||||||||||||||||||||||||||||||||||||
| |||||||||||||||||||||||||||||||||||||||||||||
Figures (Output of Computation) | |||||||||||||||||||||||||||||||||||||||||||||
Input Parameters & R Code | |||||||||||||||||||||||||||||||||||||||||||||
| Parameters (Session): | |||||||||||||||||||||||||||||||||||||||||||||
| par1 = 50 ; par2 = 50 ; par3 = 0 ; par4 = 0 ; par5 = 0 ; par6 = Y ; par7 = Y ; | |||||||||||||||||||||||||||||||||||||||||||||
| Parameters (R input): | |||||||||||||||||||||||||||||||||||||||||||||
| par1 = 50 ; par2 = 50 ; par3 = 0 ; par4 = 0 ; par5 = 0 ; par6 = Y ; par7 = Y ; | |||||||||||||||||||||||||||||||||||||||||||||
| R code (references can be found in the software module): | |||||||||||||||||||||||||||||||||||||||||||||
par1 <- as(par1,'numeric') | |||||||||||||||||||||||||||||||||||||||||||||