Free Statistics

of Irreproducible Research!

Author's title

Author*The author of this computation has been verified*
R Software Modulerwasp_boxcoxlin.wasp
Title produced by softwareBox-Cox Linearity Plot
Date of computationSat, 08 Nov 2008 09:19:46 -0700
Cite this page as followsStatistical Computations at FreeStatistics.org, Office for Research Development and Education, URL https://freestatistics.org/blog/index.php?v=date/2008/Nov/08/t1226161223dtqe676l46v2m7s.htm/, Retrieved Sun, 19 May 2024 12:03:03 +0000
Statistical Computations at FreeStatistics.org, Office for Research Development and Education, URL https://freestatistics.org/blog/index.php?pk=22626, Retrieved Sun, 19 May 2024 12:03:03 +0000
QR Codes:

Original text written by user:
IsPrivate?No (this computation is public)
User-defined keywords
Estimated Impact142
Family? (F = Feedback message, R = changed R code, M = changed R Module, P = changed Parameters, D = changed Data)
F       [Box-Cox Linearity Plot] [EDA Hyp. Testing Q3] [2008-11-08 16:19:46] [0da3c04827d8ef68db874351a2e09488] [Current]
Feedback Forum
2008-11-21 16:29:37 [Nick Wuyts] [reply
De Box-Cox linearity plot techniek laat ons toe de tijdreeksen goed en snel te transformeren, met als doelstelling te onderzoeken of er een lambda parameter bestaat zodanig je een lineair verband krijgt.
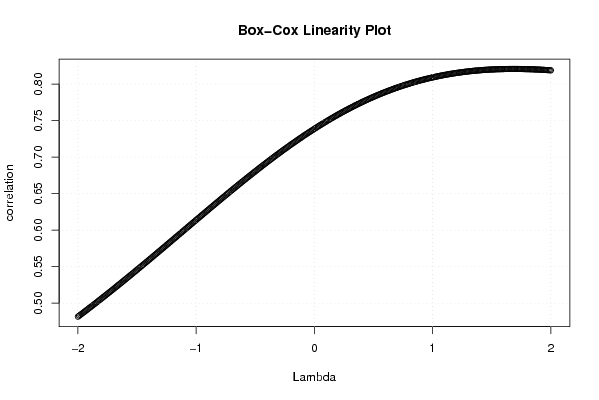
In de R-code wordt een nieuwe variabele aangemaakt (x1). Deze variabele is de oorspronkelijke variabele x verheven tot de macht lambda -1 en dit opnieuw gedeeld door lambda. Hierdoor worden de tijdreeksen getransformeerd. Je moet op zoek gaan naar de optimale lambda om de tijdreeksen te transformeren. De optimale lambda in dit geval is 1.68 (de rechte bereikt een maximum rond die waarde, zie grafiek 1).
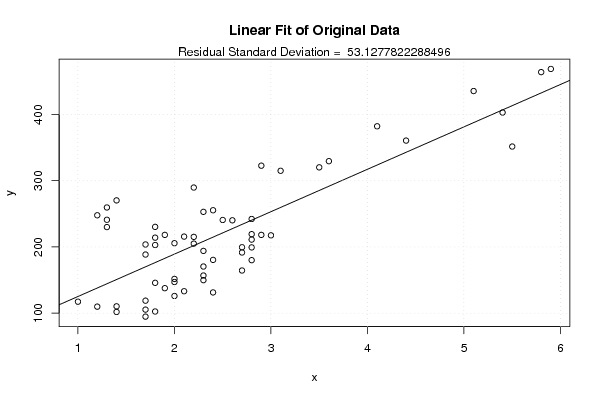
We zien hier dat we een sterke positieve correlatie hebben adhv de rechte in grafiek 2 (waarde 0.8207…). Dit zien we ook doordat de punten vrij dicht bij de rechte gelegen zijn.
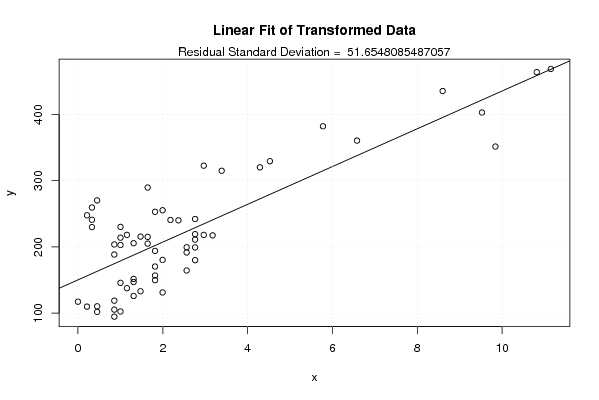
De 3e grafiek laat ons de getransformeerde data zien.

Stel dat het maximum niet zichtbaar is, dan moet je de R code aanpassen zodat het maximum wel zichtbaar wordt. Wanneer er geen maximum te zien is, kan je namelijk geen besluit trekken.

De Box Cox Plot geeft ons een antwoord op:
Is een transformatie aangewezen de reeks?
Wat is de beste waarde voor de transformatie parameter?
2008-11-24 19:17:25 [Bart Haemels] [reply
Hier kunnen we op de 1ste grafiek zien dat de correlatie het hoogst is bij
Lambda 1.68, waar de grafiek ene maximum bereikt.

Op je onderste 2 grafieken kan je inderdaad maar een kleine verschuiving zien. Dit is aan de hand van Lambda 1.68 waarde.

Verder legt de student het hierboven perfect uit.

Post a new message
Dataseries X:
1,7
1,4
1,8
1,7
1,4
1,2
1
1,7
2,4
2
2,1
2
1,8
2,7
2,3
1,9
2
2,3
2,8
2,4
2,3
2,7
2,7
2,9
3
2,2
2,3
2,8
2,8
2,8
2,2
2,6
2,8
2,5
2,4
2,3
1,9
1,7
2
2,1
1,7
1,8
1,8
1,8
1,3
1,3
1,3
1,2
1,4
2,2
2,9
3,1
3,5
3,6
4,4
4,1
5,1
5,8
5,9
5,4
5,5
Dataseries Y:
94,7
101,8
102,5
105,3
110,3
109,8
117,3
118,8
131,3
125,9
133,1
147
145,8
164,4
149,8
137,7
151,7
156,8
180
180,4
170,4
191,6
199,5
218,2
217,5
205
194
199,3
219,3
211,1
215,2
240,2
242,2
240,7
255,4
253
218,2
203,7
205,6
215,6
188,5
202,9
214
230,3
230
241
259,6
247,8
270,3
289,7
322,7
315
320,2
329,5
360,6
382,2
435,4
464
468,8
403
351,6


Summary of computational transaction
Raw Inputview raw input (R code)
Raw Outputview raw output of R engine
Computing time3 seconds
R Server'Herman Ole Andreas Wold' @ 193.190.124.10:1001

\begin{tabular}{lllllllll}
\hline
Summary of computational transaction \tabularnewline
Raw Input & view raw input (R code)  \tabularnewline
Raw Output & view raw output of R engine  \tabularnewline
Computing time & 3 seconds \tabularnewline
R Server & 'Herman Ole Andreas Wold' @ 193.190.124.10:1001 \tabularnewline
\hline
\end{tabular}
%Source: https://freestatistics.org/blog/index.php?pk=22626&T=0

[TABLE]
[ROW][C]Summary of computational transaction[/C][/ROW]
[ROW][C]Raw Input[/C][C]view raw input (R code) [/C][/ROW]
[ROW][C]Raw Output[/C][C]view raw output of R engine [/C][/ROW]
[ROW][C]Computing time[/C][C]3 seconds[/C][/ROW]
[ROW][C]R Server[/C][C]'Herman Ole Andreas Wold' @ 193.190.124.10:1001[/C][/ROW]
[/TABLE]
Source: https://freestatistics.org/blog/index.php?pk=22626&T=0

Globally Unique Identifier (entire table): ba.freestatistics.org/blog/index.php?pk=22626&T=0

As an alternative you can also use a QR Code:  

The GUIDs for individual cells are displayed in the table below:

Summary of computational transaction
Raw Inputview raw input (R code)
Raw Outputview raw output of R engine
Computing time3 seconds
R Server'Herman Ole Andreas Wold' @ 193.190.124.10:1001


Box-Cox Linearity Plot
# observations x61
maximum correlation0.820746731877216
optimal lambda(x)1.68
Residual SD (orginial)53.1277822288496
Residual SD (transformed)51.6548085487057

\begin{tabular}{lllllllll}
\hline
Box-Cox Linearity Plot \tabularnewline
# observations x & 61 \tabularnewline
maximum correlation & 0.820746731877216 \tabularnewline
optimal lambda(x) & 1.68 \tabularnewline
Residual SD (orginial) & 53.1277822288496 \tabularnewline
Residual SD (transformed) & 51.6548085487057 \tabularnewline
\hline
\end{tabular}
%Source: https://freestatistics.org/blog/index.php?pk=22626&T=1

[TABLE]
[ROW][C]Box-Cox Linearity Plot[/C][/ROW]
[ROW][C]# observations x[/C][C]61[/C][/ROW]
[ROW][C]maximum correlation[/C][C]0.820746731877216[/C][/ROW]
[ROW][C]optimal lambda(x)[/C][C]1.68[/C][/ROW]
[ROW][C]Residual SD (orginial)[/C][C]53.1277822288496[/C][/ROW]
[ROW][C]Residual SD (transformed)[/C][C]51.6548085487057[/C][/ROW]
[/TABLE]
Source: https://freestatistics.org/blog/index.php?pk=22626&T=1

Globally Unique Identifier (entire table): ba.freestatistics.org/blog/index.php?pk=22626&T=1

As an alternative you can also use a QR Code:  

The GUIDs for individual cells are displayed in the table below:

Box-Cox Linearity Plot
# observations x61
maximum correlation0.820746731877216
optimal lambda(x)1.68
Residual SD (orginial)53.1277822288496
Residual SD (transformed)51.6548085487057


Parameters (Session):
Parameters (R input):
R code (references can be found in the software module):
n <- length(x)
c <- array(NA,dim=c(401))
l <- array(NA,dim=c(401))
mx <- 0
mxli <- -999
for (i in 1:401)
{
l[i] <- (i-201)/100
if (l[i] != 0)
{
x1 <- (x^l[i] - 1) / l[i]
} else {
x1 <- log(x)
}
c[i] <- cor(x1,y)
if (mx < abs(c[i]))
{
mx <- abs(c[i])
mxli <- l[i]
}
}
c
mx
mxli
if (mxli != 0)
{
x1 <- (x^mxli - 1) / mxli
} else {
x1 <- log(x)
}
r<-lm(y~x)
se <- sqrt(var(r$residuals))
r1 <- lm(y~x1)
se1 <- sqrt(var(r1$residuals))
bitmap(file='test1.png')
plot(l,c,main='Box-Cox Linearity Plot',xlab='Lambda',ylab='correlation')
grid()
dev.off()
bitmap(file='test2.png')
plot(x,y,main='Linear Fit of Original Data',xlab='x',ylab='y')
abline(r)
grid()
mtext(paste('Residual Standard Deviation = ',se))
dev.off()
bitmap(file='test3.png')
plot(x1,y,main='Linear Fit of Transformed Data',xlab='x',ylab='y')
abline(r1)
grid()
mtext(paste('Residual Standard Deviation = ',se1))
dev.off()
load(file='createtable')
a<-table.start()
a<-table.row.start(a)
a<-table.element(a,'Box-Cox Linearity Plot',2,TRUE)
a<-table.row.end(a)
a<-table.row.start(a)
a<-table.element(a,'# observations x',header=TRUE)
a<-table.element(a,n)
a<-table.row.end(a)
a<-table.row.start(a)
a<-table.element(a,'maximum correlation',header=TRUE)
a<-table.element(a,mx)
a<-table.row.end(a)
a<-table.row.start(a)
a<-table.element(a,'optimal lambda(x)',header=TRUE)
a<-table.element(a,mxli)
a<-table.row.end(a)
a<-table.row.start(a)
a<-table.element(a,'Residual SD (orginial)',header=TRUE)
a<-table.element(a,se)
a<-table.row.end(a)
a<-table.row.start(a)
a<-table.element(a,'Residual SD (transformed)',header=TRUE)
a<-table.element(a,se1)
a<-table.row.end(a)
a<-table.end(a)
table.save(a,file='mytable.tab')