Free Statistics

of Irreproducible Research!

Author's title

Author*The author of this computation has been verified*
R Software Modulerwasp_hierarchicalclustering.wasp
Title produced by softwareHierarchical Clustering
Date of computationFri, 07 Nov 2008 07:50:40 -0700
Cite this page as followsStatistical Computations at FreeStatistics.org, Office for Research Development and Education, URL https://freestatistics.org/blog/index.php?v=date/2008/Nov/07/t12260696966ujwy16wh88444r.htm/, Retrieved Sun, 19 May 2024 07:12:38 +0000
Statistical Computations at FreeStatistics.org, Office for Research Development and Education, URL https://freestatistics.org/blog/index.php?pk=22520, Retrieved Sun, 19 May 2024 07:12:38 +0000
QR Codes:

Original text written by user:
IsPrivate?No (this computation is public)
User-defined keywords
Estimated Impact208
Family? (F = Feedback message, R = changed R code, M = changed R Module, P = changed Parameters, D = changed Data)
F       [Hierarchical Clustering] [Clustering voedin...] [2008-11-07 14:50:40] [a8228479d4547a92e2d3f176a5299609] [Current]
- RMPD    [Box-Cox Normality Plot] [Q4 box cox norm v...] [2008-11-11 16:50:27] [ed2ba3b6182103c15c0ab511ae4e6284]
- RMPD    [Maximum-likelihood Fitting - Normal Distribution] [maximum likelihoo...] [2008-11-11 16:55:35] [ed2ba3b6182103c15c0ab511ae4e6284]
Feedback Forum
2008-11-23 13:16:30 [Stéphanie Claes] [reply
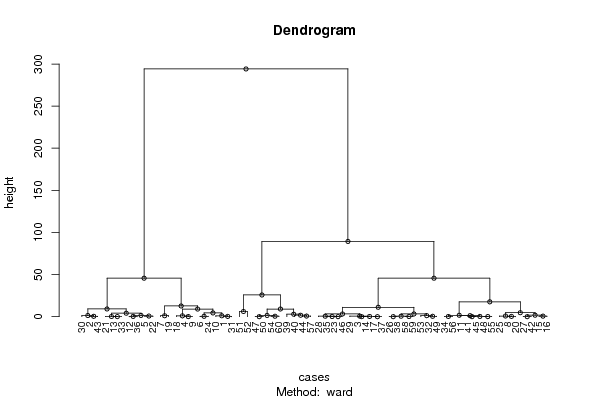
=> clustering van de observaties. We gaan na welke observaties als gelijkaardig kunnen gezien worden. Op de grafiek zien we een linkertak (te groeperen in 1 categorie) en een rechtertak (groeperen in een andere categorie.
De calculator is niet echt bruikbaar omdat het dient voor niet-tijdreeksen om een algemene trend of clusters te vinden.

Post a new message
Dataseries X:
113,5
121,2
130,4
115,2
117,9
110,7
107,6
124,3
115,1
112,5
127,9
117,4
119,3
130,4
126
125,4
130,5
115,9
108,7
124
119,4
118,6
131,3
111,1
124,8
132,3
126,7
131,7
130,9
122,1
113,2
133,6
119,2
129,4
131,4
117,1
130,5
132,3
140,8
137,5
128,6
126,7
120,8
139,3
128,6
131,3
136,3
128,8
133,2
136,3
151,1
145
134,4
135,7
128,7
129,2
138,6
132,7
132,5
135,2


Summary of computational transaction
Raw Inputview raw input (R code)
Raw Outputview raw output of R engine
Computing time2 seconds
R Server'Sir Ronald Aylmer Fisher' @ 193.190.124.24

\begin{tabular}{lllllllll}
\hline
Summary of computational transaction \tabularnewline
Raw Input & view raw input (R code)  \tabularnewline
Raw Output & view raw output of R engine  \tabularnewline
Computing time & 2 seconds \tabularnewline
R Server & 'Sir Ronald Aylmer Fisher' @ 193.190.124.24 \tabularnewline
\hline
\end{tabular}
%Source: https://freestatistics.org/blog/index.php?pk=22520&T=0

[TABLE]
[ROW][C]Summary of computational transaction[/C][/ROW]
[ROW][C]Raw Input[/C][C]view raw input (R code) [/C][/ROW]
[ROW][C]Raw Output[/C][C]view raw output of R engine [/C][/ROW]
[ROW][C]Computing time[/C][C]2 seconds[/C][/ROW]
[ROW][C]R Server[/C][C]'Sir Ronald Aylmer Fisher' @ 193.190.124.24[/C][/ROW]
[/TABLE]
Source: https://freestatistics.org/blog/index.php?pk=22520&T=0

Globally Unique Identifier (entire table): ba.freestatistics.org/blog/index.php?pk=22520&T=0

As an alternative you can also use a QR Code:  

The GUIDs for individual cells are displayed in the table below:

Summary of computational transaction
Raw Inputview raw input (R code)
Raw Outputview raw output of R engine
Computing time2 seconds
R Server'Sir Ronald Aylmer Fisher' @ 193.190.124.24


Summary of Dendrogram
LabelHeight
10
20
30
40
50
60
70
80.0999999999999943
90.100000000000009
100.100000000000023
110.133333333333326
120.166666666666676
130.199999999999989
140.199999999999989
150.200000000000017
160.25
170.299999999999997
180.299999999999997
190.300000000000011
200.399999999999991
210.400000000000006
220.400000000000006
230.499999999999972
240.5
250.516666666666637
260.599999999999994
270.680000000000007
280.699999999999989
290.700000000000017
300.766666666666666
310.966666666666673
321.03333333333334
331.10000000000001
341.16999999999998
351.20000000000002
361.33333333333332
371.45000000000005
381.5
391.65142857142855
401.70000000000000
411.70000000000000
422.90000000000001
433.18111111111114
443.18571428571427
454.09047619047619
464.42666666666668
474.69047619047621
486.1
499.02333333333333
509.07499999999998
519.1295238095238
5211.1281746031746
5312.67
5417.5857142857143
5525.735
5645.63
5745.6407142857144
5889.335
59294.128333333333

\begin{tabular}{lllllllll}
\hline
Summary of Dendrogram \tabularnewline
Label & Height \tabularnewline
1 & 0 \tabularnewline
2 & 0 \tabularnewline
3 & 0 \tabularnewline
4 & 0 \tabularnewline
5 & 0 \tabularnewline
6 & 0 \tabularnewline
7 & 0 \tabularnewline
8 & 0.0999999999999943 \tabularnewline
9 & 0.100000000000009 \tabularnewline
10 & 0.100000000000023 \tabularnewline
11 & 0.133333333333326 \tabularnewline
12 & 0.166666666666676 \tabularnewline
13 & 0.199999999999989 \tabularnewline
14 & 0.199999999999989 \tabularnewline
15 & 0.200000000000017 \tabularnewline
16 & 0.25 \tabularnewline
17 & 0.299999999999997 \tabularnewline
18 & 0.299999999999997 \tabularnewline
19 & 0.300000000000011 \tabularnewline
20 & 0.399999999999991 \tabularnewline
21 & 0.400000000000006 \tabularnewline
22 & 0.400000000000006 \tabularnewline
23 & 0.499999999999972 \tabularnewline
24 & 0.5 \tabularnewline
25 & 0.516666666666637 \tabularnewline
26 & 0.599999999999994 \tabularnewline
27 & 0.680000000000007 \tabularnewline
28 & 0.699999999999989 \tabularnewline
29 & 0.700000000000017 \tabularnewline
30 & 0.766666666666666 \tabularnewline
31 & 0.966666666666673 \tabularnewline
32 & 1.03333333333334 \tabularnewline
33 & 1.10000000000001 \tabularnewline
34 & 1.16999999999998 \tabularnewline
35 & 1.20000000000002 \tabularnewline
36 & 1.33333333333332 \tabularnewline
37 & 1.45000000000005 \tabularnewline
38 & 1.5 \tabularnewline
39 & 1.65142857142855 \tabularnewline
40 & 1.70000000000000 \tabularnewline
41 & 1.70000000000000 \tabularnewline
42 & 2.90000000000001 \tabularnewline
43 & 3.18111111111114 \tabularnewline
44 & 3.18571428571427 \tabularnewline
45 & 4.09047619047619 \tabularnewline
46 & 4.42666666666668 \tabularnewline
47 & 4.69047619047621 \tabularnewline
48 & 6.1 \tabularnewline
49 & 9.02333333333333 \tabularnewline
50 & 9.07499999999998 \tabularnewline
51 & 9.1295238095238 \tabularnewline
52 & 11.1281746031746 \tabularnewline
53 & 12.67 \tabularnewline
54 & 17.5857142857143 \tabularnewline
55 & 25.735 \tabularnewline
56 & 45.63 \tabularnewline
57 & 45.6407142857144 \tabularnewline
58 & 89.335 \tabularnewline
59 & 294.128333333333 \tabularnewline
\hline
\end{tabular}
%Source: https://freestatistics.org/blog/index.php?pk=22520&T=1

[TABLE]
[ROW][C]Summary of Dendrogram[/C][/ROW]
[ROW][C]Label[/C][C]Height[/C][/ROW]
[ROW][C]1[/C][C]0[/C][/ROW]
[ROW][C]2[/C][C]0[/C][/ROW]
[ROW][C]3[/C][C]0[/C][/ROW]
[ROW][C]4[/C][C]0[/C][/ROW]
[ROW][C]5[/C][C]0[/C][/ROW]
[ROW][C]6[/C][C]0[/C][/ROW]
[ROW][C]7[/C][C]0[/C][/ROW]
[ROW][C]8[/C][C]0.0999999999999943[/C][/ROW]
[ROW][C]9[/C][C]0.100000000000009[/C][/ROW]
[ROW][C]10[/C][C]0.100000000000023[/C][/ROW]
[ROW][C]11[/C][C]0.133333333333326[/C][/ROW]
[ROW][C]12[/C][C]0.166666666666676[/C][/ROW]
[ROW][C]13[/C][C]0.199999999999989[/C][/ROW]
[ROW][C]14[/C][C]0.199999999999989[/C][/ROW]
[ROW][C]15[/C][C]0.200000000000017[/C][/ROW]
[ROW][C]16[/C][C]0.25[/C][/ROW]
[ROW][C]17[/C][C]0.299999999999997[/C][/ROW]
[ROW][C]18[/C][C]0.299999999999997[/C][/ROW]
[ROW][C]19[/C][C]0.300000000000011[/C][/ROW]
[ROW][C]20[/C][C]0.399999999999991[/C][/ROW]
[ROW][C]21[/C][C]0.400000000000006[/C][/ROW]
[ROW][C]22[/C][C]0.400000000000006[/C][/ROW]
[ROW][C]23[/C][C]0.499999999999972[/C][/ROW]
[ROW][C]24[/C][C]0.5[/C][/ROW]
[ROW][C]25[/C][C]0.516666666666637[/C][/ROW]
[ROW][C]26[/C][C]0.599999999999994[/C][/ROW]
[ROW][C]27[/C][C]0.680000000000007[/C][/ROW]
[ROW][C]28[/C][C]0.699999999999989[/C][/ROW]
[ROW][C]29[/C][C]0.700000000000017[/C][/ROW]
[ROW][C]30[/C][C]0.766666666666666[/C][/ROW]
[ROW][C]31[/C][C]0.966666666666673[/C][/ROW]
[ROW][C]32[/C][C]1.03333333333334[/C][/ROW]
[ROW][C]33[/C][C]1.10000000000001[/C][/ROW]
[ROW][C]34[/C][C]1.16999999999998[/C][/ROW]
[ROW][C]35[/C][C]1.20000000000002[/C][/ROW]
[ROW][C]36[/C][C]1.33333333333332[/C][/ROW]
[ROW][C]37[/C][C]1.45000000000005[/C][/ROW]
[ROW][C]38[/C][C]1.5[/C][/ROW]
[ROW][C]39[/C][C]1.65142857142855[/C][/ROW]
[ROW][C]40[/C][C]1.70000000000000[/C][/ROW]
[ROW][C]41[/C][C]1.70000000000000[/C][/ROW]
[ROW][C]42[/C][C]2.90000000000001[/C][/ROW]
[ROW][C]43[/C][C]3.18111111111114[/C][/ROW]
[ROW][C]44[/C][C]3.18571428571427[/C][/ROW]
[ROW][C]45[/C][C]4.09047619047619[/C][/ROW]
[ROW][C]46[/C][C]4.42666666666668[/C][/ROW]
[ROW][C]47[/C][C]4.69047619047621[/C][/ROW]
[ROW][C]48[/C][C]6.1[/C][/ROW]
[ROW][C]49[/C][C]9.02333333333333[/C][/ROW]
[ROW][C]50[/C][C]9.07499999999998[/C][/ROW]
[ROW][C]51[/C][C]9.1295238095238[/C][/ROW]
[ROW][C]52[/C][C]11.1281746031746[/C][/ROW]
[ROW][C]53[/C][C]12.67[/C][/ROW]
[ROW][C]54[/C][C]17.5857142857143[/C][/ROW]
[ROW][C]55[/C][C]25.735[/C][/ROW]
[ROW][C]56[/C][C]45.63[/C][/ROW]
[ROW][C]57[/C][C]45.6407142857144[/C][/ROW]
[ROW][C]58[/C][C]89.335[/C][/ROW]
[ROW][C]59[/C][C]294.128333333333[/C][/ROW]
[/TABLE]
Source: https://freestatistics.org/blog/index.php?pk=22520&T=1

Globally Unique Identifier (entire table): ba.freestatistics.org/blog/index.php?pk=22520&T=1

As an alternative you can also use a QR Code:  

The GUIDs for individual cells are displayed in the table below:

Summary of Dendrogram
LabelHeight
10
20
30
40
50
60
70
80.0999999999999943
90.100000000000009
100.100000000000023
110.133333333333326
120.166666666666676
130.199999999999989
140.199999999999989
150.200000000000017
160.25
170.299999999999997
180.299999999999997
190.300000000000011
200.399999999999991
210.400000000000006
220.400000000000006
230.499999999999972
240.5
250.516666666666637
260.599999999999994
270.680000000000007
280.699999999999989
290.700000000000017
300.766666666666666
310.966666666666673
321.03333333333334
331.10000000000001
341.16999999999998
351.20000000000002
361.33333333333332
371.45000000000005
381.5
391.65142857142855
401.70000000000000
411.70000000000000
422.90000000000001
433.18111111111114
443.18571428571427
454.09047619047619
464.42666666666668
474.69047619047621
486.1
499.02333333333333
509.07499999999998
519.1295238095238
5211.1281746031746
5312.67
5417.5857142857143
5525.735
5645.63
5745.6407142857144
5889.335
59294.128333333333


Parameters (Session):
par1 = ward ; par2 = ALL ; par3 = FALSE ; par4 = FALSE ;
Parameters (R input):
par1 = ward ; par2 = ALL ; par3 = FALSE ; par4 = FALSE ;
R code (references can be found in the software module):
par3 <- as.logical(par3)
par4 <- as.logical(par4)
if (par3 == 'TRUE'){
dum = xlab
xlab = ylab
ylab = dum
}
x <- t(y)
hc <- hclust(dist(x),method=par1)
d <- as.dendrogram(hc)
str(d)
mysub <- paste('Method: ',par1)
bitmap(file='test1.png')
if (par4 == 'TRUE'){
plot(d,main=main,ylab=ylab,xlab=xlab,horiz=par3, nodePar=list(pch = c(1,NA), cex=0.8, lab.cex = 0.8),type='t',center=T, sub=mysub)
} else {
plot(d,main=main,ylab=ylab,xlab=xlab,horiz=par3, nodePar=list(pch = c(1,NA), cex=0.8, lab.cex = 0.8), sub=mysub)
}
dev.off()
if (par2 != 'ALL'){
if (par3 == 'TRUE'){
ylab = 'cluster'
} else {
xlab = 'cluster'
}
par2 <- as.numeric(par2)
memb <- cutree(hc, k = par2)
cent <- NULL
for(k in 1:par2){
cent <- rbind(cent, colMeans(x[memb == k, , drop = FALSE]))
}
hc1 <- hclust(dist(cent),method=par1, members = table(memb))
de <- as.dendrogram(hc1)
bitmap(file='test2.png')
if (par4 == 'TRUE'){
plot(de,main=main,ylab=ylab,xlab=xlab,horiz=par3, nodePar=list(pch = c(1,NA), cex=0.8, lab.cex = 0.8),type='t',center=T, sub=mysub)
} else {
plot(de,main=main,ylab=ylab,xlab=xlab,horiz=par3, nodePar=list(pch = c(1,NA), cex=0.8, lab.cex = 0.8), sub=mysub)
}
dev.off()
str(de)
}
load(file='createtable')
a<-table.start()
a<-table.row.start(a)
a<-table.element(a,'Summary of Dendrogram',2,TRUE)
a<-table.row.end(a)
a<-table.row.start(a)
a<-table.element(a,'Label',header=TRUE)
a<-table.element(a,'Height',header=TRUE)
a<-table.row.end(a)
num <- length(x[,1])-1
for (i in 1:num)
{
a<-table.row.start(a)
a<-table.element(a,hc$labels[i])
a<-table.element(a,hc$height[i])
a<-table.row.end(a)
}
a<-table.end(a)
table.save(a,file='mytable1.tab')
if (par2 != 'ALL'){
a<-table.start()
a<-table.row.start(a)
a<-table.element(a,'Summary of Cut Dendrogram',2,TRUE)
a<-table.row.end(a)
a<-table.row.start(a)
a<-table.element(a,'Label',header=TRUE)
a<-table.element(a,'Height',header=TRUE)
a<-table.row.end(a)
num <- par2-1
for (i in 1:num)
{
a<-table.row.start(a)
a<-table.element(a,i)
a<-table.element(a,hc1$height[i])
a<-table.row.end(a)
}
a<-table.end(a)
table.save(a,file='mytable2.tab')
}