Free Statistics

of Irreproducible Research!

Author's title

Author*Unverified author*
R Software Modulerwasp_notchedbox1.wasp
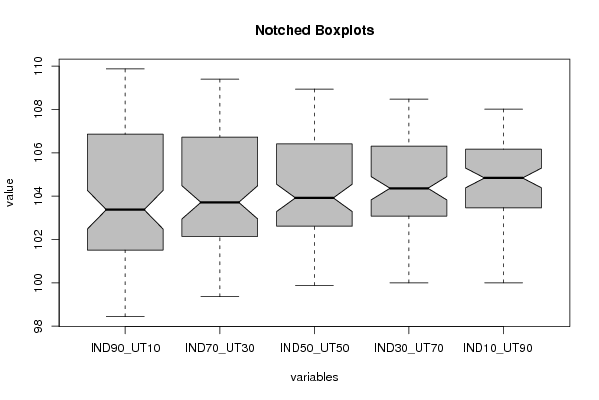
Title produced by softwareNotched Boxplots
Date of computationThu, 06 Nov 2008 08:45:07 -0700
Cite this page as followsStatistical Computations at FreeStatistics.org, Office for Research Development and Education, URL https://freestatistics.org/blog/index.php?v=date/2008/Nov/06/t12259864176dhqckihp914tsi.htm/, Retrieved Sun, 19 May 2024 05:35:11 +0000
Statistical Computations at FreeStatistics.org, Office for Research Development and Education, URL https://freestatistics.org/blog/index.php?pk=22284, Retrieved Sun, 19 May 2024 05:35:11 +0000
QR Codes:

Original text written by user:
IsPrivate?No (this computation is public)
User-defined keywords
Estimated Impact184
Family? (F = Feedback message, R = changed R code, M = changed R Module, P = changed Parameters, D = changed Data)
F       [Notched Boxplots] [Stefan Temmerman] [2008-11-06 15:45:07] [7866e091edc3e3e9f6a037e9d19fcaa2] [Current]
Feedback Forum
2008-11-09 13:22:05 [6066575aa30c0611e452e930b1dff53d] [reply
Hier ben ik het grotendeels met hem/haar eens. Het is inderdaad zo dat IND 10 de beste investering is. Hij/zij heeft wel vermeld dat de mediaan hoger ligt, maar heeft niet gesproken over de significantie. De mediaan van IND 10 ligt significant hoger dan de mediaan van IND 90. Verder heeft hij/zij 103,8 vermeld en gezegd dat dan IND 10 ook de beste investering is omdat de mediaan zelfs hoger ligt dan 104. Hier zou ik toch nog dieper op ingegaan zijn. Zo zou ik vermeld hebben dat alles wat boven de lijn van 103,8 zit, een goede investering is. Bovendien is IND 30 een randgeval. Met zekerheid zitten de inkepingen van IND 10 boven 103,8. Dus kunnen we met zekerheid zeggen dat IND 10 de beste investering is.
2008-11-11 11:05:36 [Jonas Scheltjens] [reply
Het is zeer juist wat de student aanhaald: er is kans op hogere winst, maar ook op groter verlies. Dat de laatste investering de beste is, is ook goed bewezen met het feit dat de mediaan significant hoger ligt. Wat de student wel had kunnen doen is de bijhorende tabel invoegen voor extra ondersteuning van wat wordt gezegd. Verder is ook nog correct dat de laatste investering de hoogste return on investments heeft. De student kon eventueel ook nog een lijn trekken voor verduidelijking over hoe de medianen en de betrouwbaarheidsintervallen gelegen zijn t.o.v. elkaar en hiermee de significantie opnieuw aantonen.
2008-11-11 16:10:20 [Stefan Temmerman] [reply
De vraag is juist geïnterpreteerd. De laatste belegging is de beste gezien de gegevens. Het getal 103,8, dat wijst op het geëiste rendement is genoemd. Wat ontbreekt is een interpretatie over de inkepingen: De notches van de eerste en de laatste overlappen niet, wat duidt op een significant verschil in mediaan.
2008-11-12 10:11:42 [Evelyn Gabriel] [reply
De laatste boxplot steekt er boven uit en is dus inderdaad de beste.

Post a new message
Dataseries X:
100,00	100,00	100,00	100,00	100,00
100,39	100,37	100,35	100,33	100,31
100,15	100,26	100,38	100,50	100,61
100,21	100,37	100,52	100,68	100,84
100,03	100,18	100,34	100,49	100,64
99,58	99,78	99,97	100,17	100,36
99,40	99,64	99,88	100,13	100,37
99,77	100,01	100,26	100,50	100,75
100,41	100,67	100,93	101,19	101,45
100,12	100,50	100,88	101,25	101,63
99,83	100,28	100,73	101,18	101,63
99,73	100,24	100,74	101,25	101,75
98,74	99,49	100,25	101,00	101,76
98,44	99,36	100,29	101,22	102,14
98,79	99,68	100,57	101,46	102,35
99,60	100,42	101,24	102,05	102,87
99,82	100,75	101,69	102,62	103,55
99,85	100,87	101,89	102,90	103,92
100,01	101,04	102,07	103,10	104,13
100,28	101,36	102,43	103,51	104,58
100,63	101,57	102,51	103,45	104,39
101,14	101,93	102,71	103,50	104,29
101,51	102,37	103,22	104,08	104,93
102,41	103,10	103,79	104,48	105,17
102,46	103,22	103,99	104,75	105,52
102,09	102,96	103,83	104,70	105,57
101,99	102,77	103,55	104,33	105,11
101,52	102,38	103,24	104,11	104,97
102,44	103,10	103,77	104,43	105,09
103,42	103,90	104,37	104,85	105,33
103,63	104,12	104,61	105,11	105,60
103,28	103,75	104,21	104,68	105,14
103,98	104,37	104,77	105,16	105,56
103,56	103,94	104,33	104,71	105,09
103,42	103,78	104,14	104,51	104,87
103,92	104,15	104,37	104,59	104,81
103,81	104,01	104,20	104,40	104,60
103,09	103,33	103,58	103,83	104,07
102,60	103,05	103,51	103,96	104,41
102,77	103,08	103,39	103,71	104,02
102,60	102,86	103,11	103,37	103,62
102,88	103,08	103,28	103,48	103,68
102,17	102,50	102,83	103,15	103,48
101,85	102,20	102,56	102,91	103,27
101,66	102,14	102,62	103,10	103,58
101,91	102,28	102,66	103,03	103,41
102,13	102,43	102,72	103,02	103,31
102,71	102,82	102,92	103,02	103,13
103,17	103,22	103,26	103,31	103,36
102,89	102,95	103,02	103,08	103,14
102,94	103,14	103,33	103,53	103,73
103,33	103,45	103,57	103,68	103,80
103,75	103,68	103,61	103,54	103,46
104,11	103,98	103,85	103,72	103,60
104,77	104,49	104,22	103,94	103,67
104,62	104,39	104,15	103,92	103,68
105,00	104,76	104,52	104,28	104,04
105,74	105,51	105,27	105,03	104,79
105,94	105,77	105,60	105,43	105,26
106,37	106,18	105,99	105,80	105,62
106,65	106,44	106,23	106,03	105,82
107,08	106,74	106,40	106,05	105,71
106,77	106,51	106,25	106,00	105,74
107,21	106,97	106,74	106,50	106,26
107,34	107,15	106,96	106,78	106,59
107,12	106,93	106,74	106,55	106,36
106,86	106,73	106,59	106,46	106,33
106,92	106,78	106,65	106,51	106,37
106,95	106,75	106,56	106,36	106,17
107,23	106,96	106,69	106,42	106,16
106,94	106,80	106,66	106,51	106,37
106,62	106,51	106,40	106,29	106,18
105,94	105,97	105,99	106,01	106,03
105,91	105,95	105,99	106,03	106,08
106,52	106,45	106,38	106,31	106,24
106,85	106,63	106,41	106,19	105,97
107,22	106,99	106,75	106,52	106,28
107,28	107,09	106,90	106,71	106,52
107,86	107,57	107,29	107,00	106,72
107,68	107,46	107,24	107,02	106,80
108,07	107,82	107,56	107,31	107,06
107,87	107,66	107,45	107,23	107,02
107,65	107,50	107,35	107,19	107,04
108,16	107,89	107,63	107,36	107,09
108,60	108,24	107,88	107,51	107,15
108,92	108,57	108,21	107,86	107,50
109,66	109,22	108,78	108,34	107,90
109,87	109,40	108,94	108,48	108,02
109,54	109,10	108,66	108,22	107,78
109,06	108,72	108,38	108,04	107,70


Summary of computational transaction
Raw Inputview raw input (R code)
Raw Outputview raw output of R engine
Computing time2 seconds
R Server'George Udny Yule' @ 72.249.76.132
R Framework error message
The field 'Names of X columns' contains a hard return which cannot be interpreted.
Please, resubmit your request without hard returns in the 'Names of X columns'.

\begin{tabular}{lllllllll}
\hline
Summary of computational transaction \tabularnewline
Raw Input & view raw input (R code)  \tabularnewline
Raw Output & view raw output of R engine  \tabularnewline
Computing time & 2 seconds \tabularnewline
R Server & 'George Udny Yule' @ 72.249.76.132 \tabularnewline
R Framework error message & 
The field 'Names of X columns' contains a hard return which cannot be interpreted.
Please, resubmit your request without hard returns in the 'Names of X columns'.
\tabularnewline \hline \end{tabular} %Source: https://freestatistics.org/blog/index.php?pk=22284&T=0

[TABLE]
[ROW][C]Summary of computational transaction[/C][/ROW]
[ROW][C]Raw Input[/C][C]view raw input (R code) [/C][/ROW]
[ROW][C]Raw Output[/C][C]view raw output of R engine [/C][/ROW]
[ROW][C]Computing time[/C][C]2 seconds[/C][/ROW]
[ROW][C]R Server[/C][C]'George Udny Yule' @ 72.249.76.132[/C][/ROW]
[ROW][C]R Framework error message[/C][C]
The field 'Names of X columns' contains a hard return which cannot be interpreted.
Please, resubmit your request without hard returns in the 'Names of X columns'.
[/C][/ROW] [/TABLE] Source: https://freestatistics.org/blog/index.php?pk=22284&T=0

Globally Unique Identifier (entire table): ba.freestatistics.org/blog/index.php?pk=22284&T=0

As an alternative you can also use a QR Code:  

The GUIDs for individual cells are displayed in the table below:

Summary of computational transaction
Raw Inputview raw input (R code)
Raw Outputview raw output of R engine
Computing time2 seconds
R Server'George Udny Yule' @ 72.249.76.132
R Framework error message
The field 'Names of X columns' contains a hard return which cannot be interpreted.
Please, resubmit your request without hard returns in the 'Names of X columns'.


Boxplot statistics
Variablelower whiskerlower hingemedianupper hingeupper whisker
IND90_UT1098.44101.51103.375106.86109.87
IND70_UT3099.36102.14103.715106.73109.4
IND50_UT5099.88102.62103.92106.41108.94
IND30_UT70100103.08104.365106.31108.48
IND10_UT90 100103.46104.84106.17108.02

\begin{tabular}{lllllllll}
\hline
Boxplot statistics \tabularnewline
Variable & lower whisker & lower hinge & median & upper hinge & upper whisker \tabularnewline
IND90_UT10 & 98.44 & 101.51 & 103.375 & 106.86 & 109.87 \tabularnewline
IND70_UT30 & 99.36 & 102.14 & 103.715 & 106.73 & 109.4 \tabularnewline
IND50_UT50 & 99.88 & 102.62 & 103.92 & 106.41 & 108.94 \tabularnewline
IND30_UT70 & 100 & 103.08 & 104.365 & 106.31 & 108.48 \tabularnewline
IND10_UT90
 & 100 & 103.46 & 104.84 & 106.17 & 108.02 \tabularnewline
\hline
\end{tabular}
%Source: https://freestatistics.org/blog/index.php?pk=22284&T=1

[TABLE]
[ROW][C]Boxplot statistics[/C][/ROW]
[ROW][C]Variable[/C][C]lower whisker[/C][C]lower hinge[/C][C]median[/C][C]upper hinge[/C][C]upper whisker[/C][/ROW]
[ROW][C]IND90_UT10[/C][C]98.44[/C][C]101.51[/C][C]103.375[/C][C]106.86[/C][C]109.87[/C][/ROW]
[ROW][C]IND70_UT30[/C][C]99.36[/C][C]102.14[/C][C]103.715[/C][C]106.73[/C][C]109.4[/C][/ROW]
[ROW][C]IND50_UT50[/C][C]99.88[/C][C]102.62[/C][C]103.92[/C][C]106.41[/C][C]108.94[/C][/ROW]
[ROW][C]IND30_UT70[/C][C]100[/C][C]103.08[/C][C]104.365[/C][C]106.31[/C][C]108.48[/C][/ROW]
[ROW][C]IND10_UT90
[/C][C]100[/C][C]103.46[/C][C]104.84[/C][C]106.17[/C][C]108.02[/C][/ROW]
[/TABLE]
Source: https://freestatistics.org/blog/index.php?pk=22284&T=1

Globally Unique Identifier (entire table): ba.freestatistics.org/blog/index.php?pk=22284&T=1

As an alternative you can also use a QR Code:  

The GUIDs for individual cells are displayed in the table below:

Boxplot statistics
Variablelower whiskerlower hingemedianupper hingeupper whisker
IND90_UT1098.44101.51103.375106.86109.87
IND70_UT3099.36102.14103.715106.73109.4
IND50_UT5099.88102.62103.92106.41108.94
IND30_UT70100103.08104.365106.31108.48
IND10_UT90 100103.46104.84106.17108.02


Boxplot Notches
Variablelower boundmedianupper bound
IND90_UT10102.483975564620103.375104.266024435380
IND70_UT30102.950550998431103.715104.479449001569
IND50_UT50103.288788297179103.92104.551211702821
IND30_UT70103.827054406303104.365104.902945593697
IND10_UT90 104.388658650490104.84105.291341349510

\begin{tabular}{lllllllll}
\hline
Boxplot Notches \tabularnewline
Variable & lower bound & median & upper bound \tabularnewline
IND90_UT10 & 102.483975564620 & 103.375 & 104.266024435380 \tabularnewline
IND70_UT30 & 102.950550998431 & 103.715 & 104.479449001569 \tabularnewline
IND50_UT50 & 103.288788297179 & 103.92 & 104.551211702821 \tabularnewline
IND30_UT70 & 103.827054406303 & 104.365 & 104.902945593697 \tabularnewline
IND10_UT90
 & 104.388658650490 & 104.84 & 105.291341349510 \tabularnewline
\hline
\end{tabular}
%Source: https://freestatistics.org/blog/index.php?pk=22284&T=2

[TABLE]
[ROW][C]Boxplot Notches[/C][/ROW]
[ROW][C]Variable[/C][C]lower bound[/C][C]median[/C][C]upper bound[/C][/ROW]
[ROW][C]IND90_UT10[/C][C]102.483975564620[/C][C]103.375[/C][C]104.266024435380[/C][/ROW]
[ROW][C]IND70_UT30[/C][C]102.950550998431[/C][C]103.715[/C][C]104.479449001569[/C][/ROW]
[ROW][C]IND50_UT50[/C][C]103.288788297179[/C][C]103.92[/C][C]104.551211702821[/C][/ROW]
[ROW][C]IND30_UT70[/C][C]103.827054406303[/C][C]104.365[/C][C]104.902945593697[/C][/ROW]
[ROW][C]IND10_UT90
[/C][C]104.388658650490[/C][C]104.84[/C][C]105.291341349510[/C][/ROW]
[/TABLE]
Source: https://freestatistics.org/blog/index.php?pk=22284&T=2

Globally Unique Identifier (entire table): ba.freestatistics.org/blog/index.php?pk=22284&T=2

As an alternative you can also use a QR Code:  

The GUIDs for individual cells are displayed in the table below:

Boxplot Notches
Variablelower boundmedianupper bound
IND90_UT10102.483975564620103.375104.266024435380
IND70_UT30102.950550998431103.715104.479449001569
IND50_UT50103.288788297179103.92104.551211702821
IND30_UT70103.827054406303104.365104.902945593697
IND10_UT90 104.388658650490104.84105.291341349510


Parameters (Session):
par1 = grey ;
Parameters (R input):
par1 = grey ;
R code (references can be found in the software module):
z <- as.data.frame(t(y))
bitmap(file='test1.png')
(r<-boxplot(z ,xlab=xlab,ylab=ylab,main=main,notch=TRUE,col=par1))
dev.off()
load(file='createtable')
a<-table.start()
a<-table.row.start(a)
a<-table.element(a,hyperlink('overview.htm','Boxplot statistics','Boxplot overview'),6,TRUE)
a<-table.row.end(a)
a<-table.row.start(a)
a<-table.element(a,'Variable',1,TRUE)
a<-table.element(a,hyperlink('lower_whisker.htm','lower whisker','definition of lower whisker'),1,TRUE)
a<-table.element(a,hyperlink('lower_hinge.htm','lower hinge','definition of lower hinge'),1,TRUE)
a<-table.element(a,hyperlink('central_tendency.htm','median','definitions about measures of central tendency'),1,TRUE)
a<-table.element(a,hyperlink('upper_hinge.htm','upper hinge','definition of upper hinge'),1,TRUE)
a<-table.element(a,hyperlink('upper_whisker.htm','upper whisker','definition of upper whisker'),1,TRUE)
a<-table.row.end(a)
for (i in 1:length(y[,1]))
{
a<-table.row.start(a)
a<-table.element(a,dimnames(t(x))[[2]][i],1,TRUE)
for (j in 1:5)
{
a<-table.element(a,r$stats[j,i])
}
a<-table.row.end(a)
}
a<-table.end(a)
table.save(a,file='mytable.tab')
a<-table.start()
a<-table.row.start(a)
a<-table.element(a,'Boxplot Notches',4,TRUE)
a<-table.row.end(a)
a<-table.row.start(a)
a<-table.element(a,'Variable',1,TRUE)
a<-table.element(a,'lower bound',1,TRUE)
a<-table.element(a,'median',1,TRUE)
a<-table.element(a,'upper bound',1,TRUE)
a<-table.row.end(a)
for (i in 1:length(y[,1]))
{
a<-table.row.start(a)
a<-table.element(a,dimnames(t(x))[[2]][i],1,TRUE)
a<-table.element(a,r$conf[1,i])
a<-table.element(a,r$stats[3,i])
a<-table.element(a,r$conf[2,i])
a<-table.row.end(a)
}
a<-table.end(a)
table.save(a,file='mytable1.tab')