Free Statistics

of Irreproducible Research!

Author's title

Author*Unverified author*
R Software Modulerwasp_notchedbox1.wasp
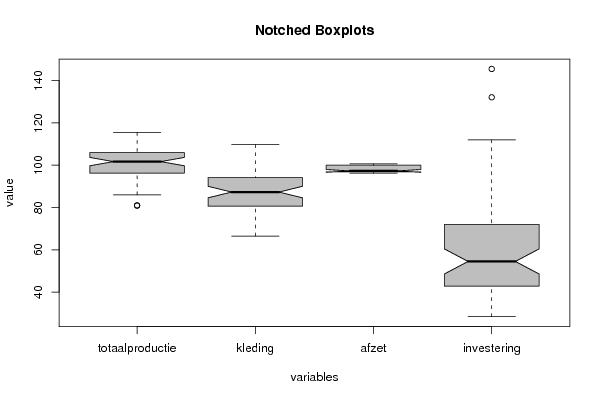
Title produced by softwareNotched Boxplots
Date of computationThu, 06 Nov 2008 07:15:40 -0700
Cite this page as followsStatistical Computations at FreeStatistics.org, Office for Research Development and Education, URL https://freestatistics.org/blog/index.php?v=date/2008/Nov/06/t1225981004fpvvc1hxo6jboyj.htm/, Retrieved Mon, 27 May 2024 01:47:02 +0000
Statistical Computations at FreeStatistics.org, Office for Research Development and Education, URL https://freestatistics.org/blog/index.php?pk=22197, Retrieved Mon, 27 May 2024 01:47:02 +0000
QR Codes:

Original text written by user:
IsPrivate?No (this computation is public)
User-defined keywords
Estimated Impact141
Family? (F = Feedback message, R = changed R code, M = changed R Module, P = changed Parameters, D = changed Data)
F     [Notched Boxplots] [workshop 3] [2007-10-26 13:31:48] [e9ffc5de6f8a7be62f22b142b5b6b1a8]
F R  D    [Notched Boxplots] [] [2008-11-06 14:15:40] [890f958132adb51f538eb267509d2e70] [Current]
F R         [Notched Boxplots] [] [2008-11-06 14:22:20] [8d2ae74f923b31b35e9e42977c3c4399]
Feedback Forum
2008-11-11 15:42:00 [Roel Geudens] [reply
Je kunt concluderen uit de mediaan dat de investeringen lager liggen, maar je moet uit de inkepingen die niet overlappen concluderen dat dit significant is.
2008-11-11 19:50:32 [Jessica Alves Pires] [reply
Roel heeft gelijk, je moet inderdaad kijken naar de inkepingen, dat ben je vergeten te zeggen. Je hebt de waarden van de medianen erbij gehaald om duidelijk te maken dat het gehaald was ten opzichte van het basisjaar maar je bent dus vergeten de upper en lower bound te vermelden. Uit de upper en lowerbound kan je zien dat de grenzen (en dus inkepingen) niet overlappen en de daling niet aan toeval te wijten is.
2008-11-11 19:53:27 [Jessica Alves Pires] [reply
Er is een typfoutje geslopen in mijn antwoord: Dat moet 'gedaald' zijn ipv 'gehaald' in de tweede regel.

Post a new message
Dataseries X:
110.40	109.20	99.90	72.50
96.40	88.60	99.80	59.40
101.90	94.30	99.80	85.70
106.20	98.30	100.30	88.20
81.00	86.40	99.90	62.80
94.70	80.60	99.90	87.00
101.00	104.10	100.00	79.20
109.40	108.20	100.10	112.00
102.30	93.40	100.10	79.20
90.70	71.90	100.20	132.10
96.20	94.10	100.30	40.10
96.10	94.90	100.60	69.00
106.00	96.40	100.00	59.40
103.10	91.10	100.10	73.80
102.00	84.40	100.20	57.40
104.70	86.40	100.00	81.10
86.00	88.00	100.10	46.60
92.10	75.10	100.10	41.40
106.90	109.70	100.10	71.20
112.60	103.00	100.50	67.90
101.70	82.10	100.50	72.00
92.00	68.00	100.50	145.50
97.40	96.40	96.30	39.70
97.00	94.30	96.30	51.90
105.40	90.00	96.80	73.70
102.70	88.00	96.80	70.90
98.10	76.10	96.90	60.80
104.50	82.50	96.80	61.00
87.40	81.40	96.80	54.50
89.90	66.50	96.80	39.10
109.80	97.20	96.80	66.60
111.70	94.10	97.00	58.50
98.60	80.70	97.00	59.80
96.90	70.50	97.00	80.90
95.10	87.80	96.80	37.30
97.00	89.50	96.90	44.60
112.70	99.60	97.20	48.70
102.90	84.20	97.30	54.00
97.40	75.10	97.30	49.50
111.40	92.00	97.20	61.60
87.40	80.80	97.30	35.00
96.80	73.10	97.30	35.70
114.10	99.80	97.30	51.30
110.30	90.00	97.30	49.00
103.90	83.10	97.30	41.50
101.60	72.40	97.30	72.50
94.60	78.80	98.10	42.10
95.90	87.30	96.80	44.10
104.70	91.00	96.80	45.10
102.80	80.10	96.80	50.30
98.10	73.60	96.80	40.90
113.90	86.40	96.80	47.20
80.90	74.50	96.80	36.90
95.70	71.20	96.80	40.90
113.20	92.40	96.80	38.30
105.90	81.50	96.80	46.30
108.80	85.30	96.80	28.40
102.30	69.90	96.80	78.40
99.00	84.20	96.90	36.80
100.70	90.70	97.10	50.70
115.50	100.30	97.10	42.80


Summary of computational transaction
Raw Inputview raw input (R code)
Raw Outputview raw output of R engine
Computing time2 seconds
R Server'Gwilym Jenkins' @ 72.249.127.135

\begin{tabular}{lllllllll}
\hline
Summary of computational transaction \tabularnewline
Raw Input & view raw input (R code)  \tabularnewline
Raw Output & view raw output of R engine  \tabularnewline
Computing time & 2 seconds \tabularnewline
R Server & 'Gwilym Jenkins' @ 72.249.127.135 \tabularnewline
\hline
\end{tabular}
%Source: https://freestatistics.org/blog/index.php?pk=22197&T=0

[TABLE]
[ROW][C]Summary of computational transaction[/C][/ROW]
[ROW][C]Raw Input[/C][C]view raw input (R code) [/C][/ROW]
[ROW][C]Raw Output[/C][C]view raw output of R engine [/C][/ROW]
[ROW][C]Computing time[/C][C]2 seconds[/C][/ROW]
[ROW][C]R Server[/C][C]'Gwilym Jenkins' @ 72.249.127.135[/C][/ROW]
[/TABLE]
Source: https://freestatistics.org/blog/index.php?pk=22197&T=0

Globally Unique Identifier (entire table): ba.freestatistics.org/blog/index.php?pk=22197&T=0

As an alternative you can also use a QR Code:  

The GUIDs for individual cells are displayed in the table below:

Summary of computational transaction
Raw Inputview raw input (R code)
Raw Outputview raw output of R engine
Computing time2 seconds
R Server'Gwilym Jenkins' @ 72.249.127.135


Boxplot statistics
Variablelower whiskerlower hingemedianupper hingeupper whisker
totaalproductie8696.2101.7106115.5
kleding66.580.687.394.1109.7
afzet96.396.897.3100100.6
investering28.442.854.572112

\begin{tabular}{lllllllll}
\hline
Boxplot statistics \tabularnewline
Variable & lower whisker & lower hinge & median & upper hinge & upper whisker \tabularnewline
totaalproductie & 86 & 96.2 & 101.7 & 106 & 115.5 \tabularnewline
kleding & 66.5 & 80.6 & 87.3 & 94.1 & 109.7 \tabularnewline
afzet & 96.3 & 96.8 & 97.3 & 100 & 100.6 \tabularnewline
investering & 28.4 & 42.8 & 54.5 & 72 & 112 \tabularnewline
\hline
\end{tabular}
%Source: https://freestatistics.org/blog/index.php?pk=22197&T=1

[TABLE]
[ROW][C]Boxplot statistics[/C][/ROW]
[ROW][C]Variable[/C][C]lower whisker[/C][C]lower hinge[/C][C]median[/C][C]upper hinge[/C][C]upper whisker[/C][/ROW]
[ROW][C]totaalproductie[/C][C]86[/C][C]96.2[/C][C]101.7[/C][C]106[/C][C]115.5[/C][/ROW]
[ROW][C]kleding[/C][C]66.5[/C][C]80.6[/C][C]87.3[/C][C]94.1[/C][C]109.7[/C][/ROW]
[ROW][C]afzet[/C][C]96.3[/C][C]96.8[/C][C]97.3[/C][C]100[/C][C]100.6[/C][/ROW]
[ROW][C]investering[/C][C]28.4[/C][C]42.8[/C][C]54.5[/C][C]72[/C][C]112[/C][/ROW]
[/TABLE]
Source: https://freestatistics.org/blog/index.php?pk=22197&T=1

Globally Unique Identifier (entire table): ba.freestatistics.org/blog/index.php?pk=22197&T=1

As an alternative you can also use a QR Code:  

The GUIDs for individual cells are displayed in the table below:

Boxplot statistics
Variablelower whiskerlower hingemedianupper hingeupper whisker
totaalproductie8696.2101.7106115.5
kleding66.580.687.394.1109.7
afzet96.396.897.3100100.6
investering28.442.854.572112


Boxplot Notches
Variablelower boundmedianupper bound
totaalproductie99.717476951119101.7103.682523048881
kleding84.568973351031387.390.0310266489687
afzet96.652645535059397.397.9473544649407
investering48.592890507415954.560.4071094925841

\begin{tabular}{lllllllll}
\hline
Boxplot Notches \tabularnewline
Variable & lower bound & median & upper bound \tabularnewline
totaalproductie & 99.717476951119 & 101.7 & 103.682523048881 \tabularnewline
kleding & 84.5689733510313 & 87.3 & 90.0310266489687 \tabularnewline
afzet & 96.6526455350593 & 97.3 & 97.9473544649407 \tabularnewline
investering & 48.5928905074159 & 54.5 & 60.4071094925841 \tabularnewline
\hline
\end{tabular}
%Source: https://freestatistics.org/blog/index.php?pk=22197&T=2

[TABLE]
[ROW][C]Boxplot Notches[/C][/ROW]
[ROW][C]Variable[/C][C]lower bound[/C][C]median[/C][C]upper bound[/C][/ROW]
[ROW][C]totaalproductie[/C][C]99.717476951119[/C][C]101.7[/C][C]103.682523048881[/C][/ROW]
[ROW][C]kleding[/C][C]84.5689733510313[/C][C]87.3[/C][C]90.0310266489687[/C][/ROW]
[ROW][C]afzet[/C][C]96.6526455350593[/C][C]97.3[/C][C]97.9473544649407[/C][/ROW]
[ROW][C]investering[/C][C]48.5928905074159[/C][C]54.5[/C][C]60.4071094925841[/C][/ROW]
[/TABLE]
Source: https://freestatistics.org/blog/index.php?pk=22197&T=2

Globally Unique Identifier (entire table): ba.freestatistics.org/blog/index.php?pk=22197&T=2

As an alternative you can also use a QR Code:  

The GUIDs for individual cells are displayed in the table below:

Boxplot Notches
Variablelower boundmedianupper bound
totaalproductie99.717476951119101.7103.682523048881
kleding84.568973351031387.390.0310266489687
afzet96.652645535059397.397.9473544649407
investering48.592890507415954.560.4071094925841


Parameters (Session):
par1 = grey ;
Parameters (R input):
par1 = grey ;
R code (references can be found in the software module):
z <- as.data.frame(t(y))
bitmap(file='test1.png')
(r<-boxplot(z ,xlab=xlab,ylab=ylab,main=main,notch=TRUE,col=par1))
dev.off()
load(file='createtable')
a<-table.start()
a<-table.row.start(a)
a<-table.element(a,hyperlink('overview.htm','Boxplot statistics','Boxplot overview'),6,TRUE)
a<-table.row.end(a)
a<-table.row.start(a)
a<-table.element(a,'Variable',1,TRUE)
a<-table.element(a,hyperlink('lower_whisker.htm','lower whisker','definition of lower whisker'),1,TRUE)
a<-table.element(a,hyperlink('lower_hinge.htm','lower hinge','definition of lower hinge'),1,TRUE)
a<-table.element(a,hyperlink('central_tendency.htm','median','definitions about measures of central tendency'),1,TRUE)
a<-table.element(a,hyperlink('upper_hinge.htm','upper hinge','definition of upper hinge'),1,TRUE)
a<-table.element(a,hyperlink('upper_whisker.htm','upper whisker','definition of upper whisker'),1,TRUE)
a<-table.row.end(a)
for (i in 1:length(y[,1]))
{
a<-table.row.start(a)
a<-table.element(a,dimnames(t(x))[[2]][i],1,TRUE)
for (j in 1:5)
{
a<-table.element(a,r$stats[j,i])
}
a<-table.row.end(a)
}
a<-table.end(a)
table.save(a,file='mytable.tab')
a<-table.start()
a<-table.row.start(a)
a<-table.element(a,'Boxplot Notches',4,TRUE)
a<-table.row.end(a)
a<-table.row.start(a)
a<-table.element(a,'Variable',1,TRUE)
a<-table.element(a,'lower bound',1,TRUE)
a<-table.element(a,'median',1,TRUE)
a<-table.element(a,'upper bound',1,TRUE)
a<-table.row.end(a)
for (i in 1:length(y[,1]))
{
a<-table.row.start(a)
a<-table.element(a,dimnames(t(x))[[2]][i],1,TRUE)
a<-table.element(a,r$conf[1,i])
a<-table.element(a,r$stats[3,i])
a<-table.element(a,r$conf[2,i])
a<-table.row.end(a)
}
a<-table.end(a)
table.save(a,file='mytable1.tab')