Free Statistics

of Irreproducible Research!

Author's title

Author*Unverified author*
R Software Modulerwasp_notchedbox1.wasp
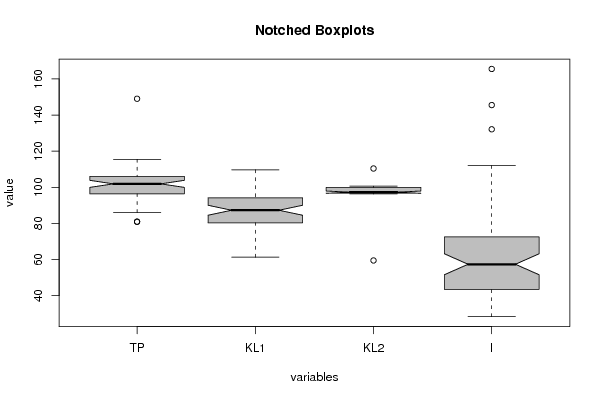
Title produced by softwareNotched Boxplots
Date of computationThu, 06 Nov 2008 06:39:49 -0700
Cite this page as followsStatistical Computations at FreeStatistics.org, Office for Research Development and Education, URL https://freestatistics.org/blog/index.php?v=date/2008/Nov/06/t1225978827j7qpo2jdaw99gvc.htm/, Retrieved Sun, 19 May 2024 05:37:36 +0000
Statistical Computations at FreeStatistics.org, Office for Research Development and Education, URL https://freestatistics.org/blog/index.php?pk=22153, Retrieved Sun, 19 May 2024 05:37:36 +0000
QR Codes:

Original text written by user:
IsPrivate?No (this computation is public)
User-defined keywords
Estimated Impact146
Family? (F = Feedback message, R = changed R code, M = changed R Module, P = changed Parameters, D = changed Data)
F       [Notched Boxplots] [EDA (part 1) Task...] [2008-11-06 13:39:49] [51254d789fff0741e6503951f574c682] [Current]
Feedback Forum
2008-11-11 09:36:09 [Lana Van Wesemael] [reply
Hier kan ik nog aan toevoegen dat we de mediaan van elke box plot moeten vergelijken met het basisjaar. Hieruit blijkt dan dat de investeringen het hardst gedaald zijn ten opzichte van het basisjaar.
2008-11-12 09:33:14 [Bert Moons] [reply
De conclusie is juist. De investeringen zijn (significant) gedaald. Het betrouwbaarheidsinterval is gedaald beneden het startpunt (100)en is significantlager dan de anderen.
De X-as is wel onduidelijk benoemd.
2008-11-12 10:09:18 [Stef Vermeiren] [reply
Je moet ze inderdaag vergelijken met een basisjaar dat gelijk is aan 100. De totaalproductie is nagenoeg onveranderd gebleven gedurende de periode. Hierbij moet men naar de mediaan kijken en niet naar de spreiding.
2008-11-12 10:15:21 [407693b66d7f2e0b350979005057872d] [reply
We zien dat de investeringen het meeste zijn achteruitgegaan omdat deze mediaan het laagtste ligt tov het basisjaar. De inkepingen van de Notched boxplots overlappen elkaar niet dus het is hier niet toevallig dat de mediaan van de investeringen het laagste ligt. De afzetprijs en de totaalproductie zijn ongeveer gelijk gebleven

Post a new message
Dataseries X:
110,40	109,20	99,90	72,50
96,40	88,60	99,80	59,40
101,90	94,30	99,80	85,70
106,20	98,30	100,30	88,20
81,00	86,40	99,90	62,80
94,70	80,60	99,90	87,00
101,00	104,10	100,00	79,20
109,40	108,20	100,10	112,00
102,30	93,40	100,10	79,20
90,70	71,90	100,20	132,10
96,20	94,10	100,30	40,10
96,10	94,90	100,60	69,00
106,00	96,40	100,00	59,40
103,10	91,10	100,10	73,80
102,00	84,40	100,20	57,40
104,70	86,40	100,00	81,10
86,00	88,00	100,10	46,60
92,10	75,10	100,10	41,40
106,90	109,70	100,10	71,20
112,60	103,00	100,50	67,90
101,70	82,10	100,50	72,00
92,00	68,00	100,50	145,50
97,40	96,40	96,30	39,70
97,00	94,30	96,30	51,90
105,40	90,00	96,80	73,70
102,70	88,00	96,80	70,90
98,10	76,10	96,90	60,80
104,50	82,50	96,80	61,00
87,40	81,40	96,80	54,50
89,90	66,50	96,80	39,10
109,80	97,20	96,80	66,60
111,70	94,10	97,00	58,50
98,60	80,70	97,00	59,80
96,90	70,50	97,00	80,90
95,10	87,80	96,80	37,30
97,00	89,50	96,90	44,60
112,70	99,60	97,20	48,70
102,90	84,20	97,30	54,00
97,40	75,10	97,30	49,50
111,40	92,00	97,20	61,60
87,40	80,80	97,30	35,00
96,80	73,10	97,30	35,70
114,10	99,80	97,30	51,30
110,30	90,00	97,30	49,00
103,90	83,10	97,30	41,50
101,60	72,40	97,30	72,50
94,60	78,80	98,10	42,10
95,90	87,30	96,80	44,10
104,70	91,00	96,80	45,10
102,80	80,10	96,80	50,30
98,10	73,60	96,80	40,90
113,90	86,40	96,80	47,20
80,90	74,50	96,80	36,90
95,70	71,20	96,80	40,90
113,20	92,40	96,80	38,30
105,90	81,50	96,80	46,30
108,80	85,30	96,80	28,40
102,30	69,90	96,80	78,40
99,00	84,20	96,90	36,80
100,70	90,70	97,10	50,70
115,50	100,30	97,10	42,80

149.0	101.6	59.5
165.5	103.8	61.3


Summary of computational transaction
Raw Inputview raw input (R code)
Raw Outputview raw output of R engine
Computing time1 seconds
R Server'Gwilym Jenkins' @ 72.249.127.135
R Framework error message
Warning: there are blank lines in the 'Data X' field.
Please, use NA for missing data - blank lines are simply
 deleted and are NOT treated as missing values.

\begin{tabular}{lllllllll}
\hline
Summary of computational transaction \tabularnewline
Raw Input & view raw input (R code)  \tabularnewline
Raw Output & view raw output of R engine  \tabularnewline
Computing time & 1 seconds \tabularnewline
R Server & 'Gwilym Jenkins' @ 72.249.127.135 \tabularnewline
R Framework error message & 
Warning: there are blank lines in the 'Data X' field.
Please, use NA for missing data - blank lines are simply
 deleted and are NOT treated as missing values.
\tabularnewline \hline \end{tabular} %Source: https://freestatistics.org/blog/index.php?pk=22153&T=0

[TABLE]
[ROW][C]Summary of computational transaction[/C][/ROW]
[ROW][C]Raw Input[/C][C]view raw input (R code) [/C][/ROW]
[ROW][C]Raw Output[/C][C]view raw output of R engine [/C][/ROW]
[ROW][C]Computing time[/C][C]1 seconds[/C][/ROW]
[ROW][C]R Server[/C][C]'Gwilym Jenkins' @ 72.249.127.135[/C][/ROW]
[ROW][C]R Framework error message[/C][C]
Warning: there are blank lines in the 'Data X' field.
Please, use NA for missing data - blank lines are simply
 deleted and are NOT treated as missing values.
[/C][/ROW] [/TABLE] Source: https://freestatistics.org/blog/index.php?pk=22153&T=0

Globally Unique Identifier (entire table): ba.freestatistics.org/blog/index.php?pk=22153&T=0

As an alternative you can also use a QR Code:  

The GUIDs for individual cells are displayed in the table below:

Summary of computational transaction
Raw Inputview raw input (R code)
Raw Outputview raw output of R engine
Computing time1 seconds
R Server'Gwilym Jenkins' @ 72.249.127.135
R Framework error message
Warning: there are blank lines in the 'Data X' field.
Please, use NA for missing data - blank lines are simply
 deleted and are NOT treated as missing values.


Boxplot statistics
Variablelower whiskerlower hingemedianupper hingeupper whisker
TP8696.3101.9106.1115.5
KL161.380.3587.394.2109.7
KL296.396.897.3100100.6
I28.443.4557.472.5112

\begin{tabular}{lllllllll}
\hline
Boxplot statistics \tabularnewline
Variable & lower whisker & lower hinge & median & upper hinge & upper whisker \tabularnewline
TP & 86 & 96.3 & 101.9 & 106.1 & 115.5 \tabularnewline
KL1 & 61.3 & 80.35 & 87.3 & 94.2 & 109.7 \tabularnewline
KL2 & 96.3 & 96.8 & 97.3 & 100 & 100.6 \tabularnewline
I & 28.4 & 43.45 & 57.4 & 72.5 & 112 \tabularnewline
\hline
\end{tabular}
%Source: https://freestatistics.org/blog/index.php?pk=22153&T=1

[TABLE]
[ROW][C]Boxplot statistics[/C][/ROW]
[ROW][C]Variable[/C][C]lower whisker[/C][C]lower hinge[/C][C]median[/C][C]upper hinge[/C][C]upper whisker[/C][/ROW]
[ROW][C]TP[/C][C]86[/C][C]96.3[/C][C]101.9[/C][C]106.1[/C][C]115.5[/C][/ROW]
[ROW][C]KL1[/C][C]61.3[/C][C]80.35[/C][C]87.3[/C][C]94.2[/C][C]109.7[/C][/ROW]
[ROW][C]KL2[/C][C]96.3[/C][C]96.8[/C][C]97.3[/C][C]100[/C][C]100.6[/C][/ROW]
[ROW][C]I[/C][C]28.4[/C][C]43.45[/C][C]57.4[/C][C]72.5[/C][C]112[/C][/ROW]
[/TABLE]
Source: https://freestatistics.org/blog/index.php?pk=22153&T=1

Globally Unique Identifier (entire table): ba.freestatistics.org/blog/index.php?pk=22153&T=1

As an alternative you can also use a QR Code:  

The GUIDs for individual cells are displayed in the table below:

Boxplot statistics
Variablelower whiskerlower hingemedianupper hingeupper whisker
TP8696.3101.9106.1115.5
KL161.380.3587.394.2109.7
KL296.396.897.3100100.6
I28.443.4557.472.5112


Boxplot Notches
Variablelower boundmedianupper bound
TP99.9491993666417101.9103.850800633358
KL184.54300114571387.390.056998854287
KL296.663003874821897.397.9369961251782
I51.617269551116557.463.1827304488835

\begin{tabular}{lllllllll}
\hline
Boxplot Notches \tabularnewline
Variable & lower bound & median & upper bound \tabularnewline
TP & 99.9491993666417 & 101.9 & 103.850800633358 \tabularnewline
KL1 & 84.543001145713 & 87.3 & 90.056998854287 \tabularnewline
KL2 & 96.6630038748218 & 97.3 & 97.9369961251782 \tabularnewline
I & 51.6172695511165 & 57.4 & 63.1827304488835 \tabularnewline
\hline
\end{tabular}
%Source: https://freestatistics.org/blog/index.php?pk=22153&T=2

[TABLE]
[ROW][C]Boxplot Notches[/C][/ROW]
[ROW][C]Variable[/C][C]lower bound[/C][C]median[/C][C]upper bound[/C][/ROW]
[ROW][C]TP[/C][C]99.9491993666417[/C][C]101.9[/C][C]103.850800633358[/C][/ROW]
[ROW][C]KL1[/C][C]84.543001145713[/C][C]87.3[/C][C]90.056998854287[/C][/ROW]
[ROW][C]KL2[/C][C]96.6630038748218[/C][C]97.3[/C][C]97.9369961251782[/C][/ROW]
[ROW][C]I[/C][C]51.6172695511165[/C][C]57.4[/C][C]63.1827304488835[/C][/ROW]
[/TABLE]
Source: https://freestatistics.org/blog/index.php?pk=22153&T=2

Globally Unique Identifier (entire table): ba.freestatistics.org/blog/index.php?pk=22153&T=2

As an alternative you can also use a QR Code:  

The GUIDs for individual cells are displayed in the table below:

Boxplot Notches
Variablelower boundmedianupper bound
TP99.9491993666417101.9103.850800633358
KL184.54300114571387.390.056998854287
KL296.663003874821897.397.9369961251782
I51.617269551116557.463.1827304488835


Parameters (Session):
par1 = grey ;
Parameters (R input):
par1 = grey ;
R code (references can be found in the software module):
z <- as.data.frame(t(y))
bitmap(file='test1.png')
(r<-boxplot(z ,xlab=xlab,ylab=ylab,main=main,notch=TRUE,col=par1))
dev.off()
load(file='createtable')
a<-table.start()
a<-table.row.start(a)
a<-table.element(a,hyperlink('overview.htm','Boxplot statistics','Boxplot overview'),6,TRUE)
a<-table.row.end(a)
a<-table.row.start(a)
a<-table.element(a,'Variable',1,TRUE)
a<-table.element(a,hyperlink('lower_whisker.htm','lower whisker','definition of lower whisker'),1,TRUE)
a<-table.element(a,hyperlink('lower_hinge.htm','lower hinge','definition of lower hinge'),1,TRUE)
a<-table.element(a,hyperlink('central_tendency.htm','median','definitions about measures of central tendency'),1,TRUE)
a<-table.element(a,hyperlink('upper_hinge.htm','upper hinge','definition of upper hinge'),1,TRUE)
a<-table.element(a,hyperlink('upper_whisker.htm','upper whisker','definition of upper whisker'),1,TRUE)
a<-table.row.end(a)
for (i in 1:length(y[,1]))
{
a<-table.row.start(a)
a<-table.element(a,dimnames(t(x))[[2]][i],1,TRUE)
for (j in 1:5)
{
a<-table.element(a,r$stats[j,i])
}
a<-table.row.end(a)
}
a<-table.end(a)
table.save(a,file='mytable.tab')
a<-table.start()
a<-table.row.start(a)
a<-table.element(a,'Boxplot Notches',4,TRUE)
a<-table.row.end(a)
a<-table.row.start(a)
a<-table.element(a,'Variable',1,TRUE)
a<-table.element(a,'lower bound',1,TRUE)
a<-table.element(a,'median',1,TRUE)
a<-table.element(a,'upper bound',1,TRUE)
a<-table.row.end(a)
for (i in 1:length(y[,1]))
{
a<-table.row.start(a)
a<-table.element(a,dimnames(t(x))[[2]][i],1,TRUE)
a<-table.element(a,r$conf[1,i])
a<-table.element(a,r$stats[3,i])
a<-table.element(a,r$conf[2,i])
a<-table.row.end(a)
}
a<-table.end(a)
table.save(a,file='mytable1.tab')