Free Statistics

of Irreproducible Research!

Author's title

Author*The author of this computation has been verified*
R Software Modulerwasp_meanplot.wasp
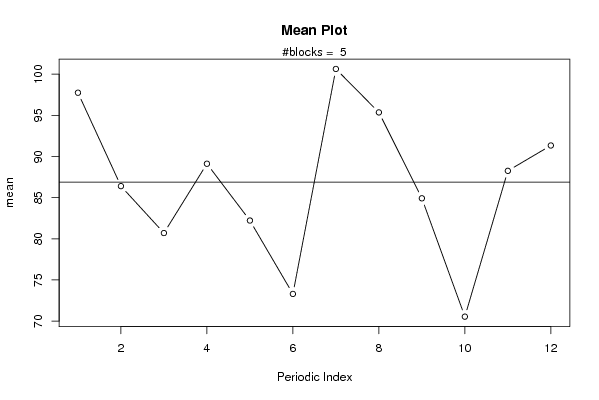
Title produced by softwareMean Plot
Date of computationThu, 06 Nov 2008 06:15:49 -0700
Cite this page as followsStatistical Computations at FreeStatistics.org, Office for Research Development and Education, URL https://freestatistics.org/blog/index.php?v=date/2008/Nov/06/t1225977407ebqh5ded5ohc4mb.htm/, Retrieved Sun, 19 May 2024 05:15:48 +0000
Statistical Computations at FreeStatistics.org, Office for Research Development and Education, URL https://freestatistics.org/blog/index.php?pk=22121, Retrieved Sun, 19 May 2024 05:15:48 +0000
QR Codes:

Original text written by user:
IsPrivate?No (this computation is public)
User-defined keywords
Estimated Impact144
Family? (F = Feedback message, R = changed R code, M = changed R Module, P = changed Parameters, D = changed Data)
F       [Mean Plot] [tinneke_debock.pa...] [2008-11-06 13:15:49] [20137734a2343a7bbbd59daaec7ad301] [Current]
Feedback Forum
2008-11-09 15:39:14 [Vincent Vanden Poel] [reply
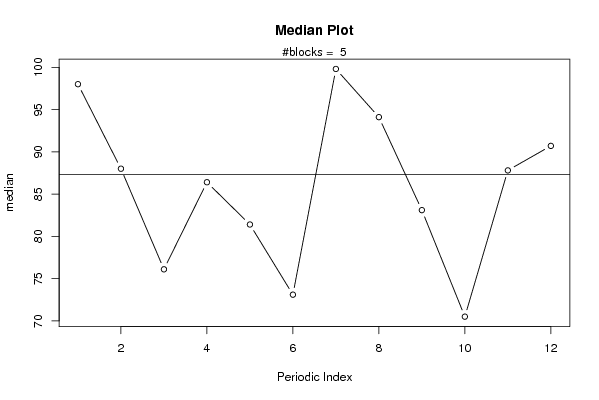
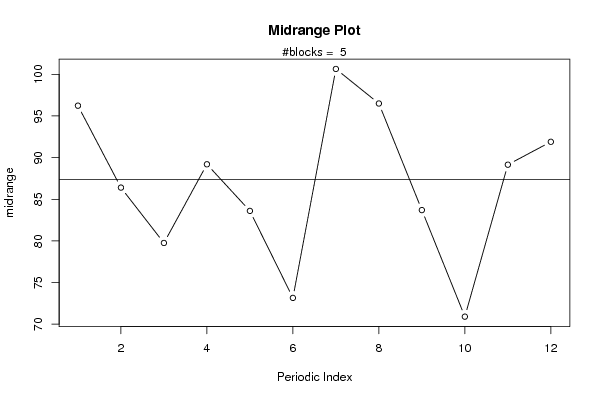
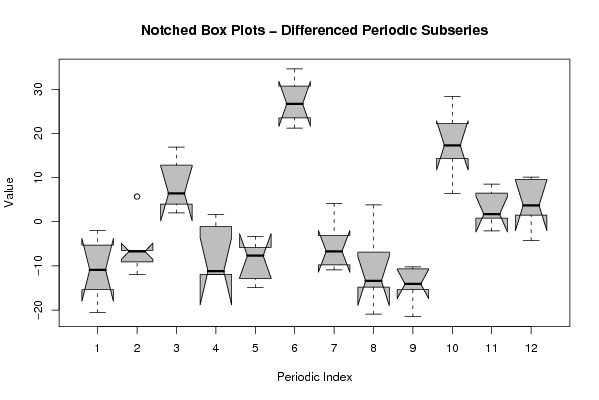
Q2: Je interpretatie is opnieuw juist en je hebt ook de fout van de oorspronkelijke student correct verbeterd door het belang te leggen op de notched box plots. Ook je uitleg en interpretatie van de periodieke box plots is correct. Beide grafieken zijn correct gereproduceerd.
Je had er misschien nog wel op kunnen wijzen dat er ook een significante daling plaatsvindt na maand 9.

Q3: De grafiek is opnieuw correct gereproduceerd en ook de interpretatie is goed.
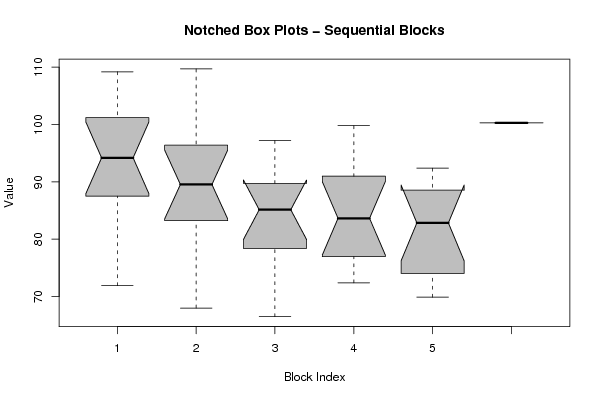
Waar je wel nog had kunnen naar verwijzen is het verschil tussen de individuele vergelijkingen en de algemene vergelijking. Het is namelijk zo dat de daling gedurende de opeenvolgende jaren inderdaad niet significant is omdat de notches elkaar overlappen. Als je echter enkel kijkt naar de eerste en de vijfde periode kan je zien dat de daling wel in hoge mate significant te noemen is.
2008-11-12 08:57:34 [59b077ee7af2fd465d73e858f5668fba] [reply
Ook hier kan ik weinig of niets aan toevoegen. Het enige wat de student niet vermeld heeft is dat het basisjaar gelijk gesteld wordt aan 100 en dat de mediaan van de investeringen hier ver onder gelegen is, wat de daling van de mediaan nogmaals bevestigt.
  2008-11-12 08:59:43 [Charis Berrevoets] [reply
Sorry, dit heb ik verkeerd geplaatst en was mijn bedenking bij task 2.
2008-11-12 11:18:08 [Robert Van Cauwelaert] [reply
Je hebt wederom een correcte voorstelling van de boxplots gegeven en de oorspronkelijke fouten verbetert.

Post a new message
Dataseries X:
109,20
88,60
94,30
98,30
86,40
80,60
104,10
108,20
93,40
71,90
94,10
94,90
96,40
91,10
84,40
86,40
88,00
75,10
109,70
103,00
82,10
68,00
96,40
94,30
90,00
88,00
76,10
82,50
81,40
66,50
97,20
94,10
80,70
70,50
87,80
89,50
99,60
84,20
75,10
92,00
80,80
73,10
99,80
90,00
83,10
72,40
78,80
87,30
91,00
80,10
73,60
86,40
74,50
71,20
92,40
81,50
85,30
69,90
84,20
90,70
100,30


Summary of computational transaction
Raw Inputview raw input (R code)
Raw Outputview raw output of R engine
Computing time2 seconds
R Server'George Udny Yule' @ 72.249.76.132

\begin{tabular}{lllllllll}
\hline
Summary of computational transaction \tabularnewline
Raw Input & view raw input (R code)  \tabularnewline
Raw Output & view raw output of R engine  \tabularnewline
Computing time & 2 seconds \tabularnewline
R Server & 'George Udny Yule' @ 72.249.76.132 \tabularnewline
\hline
\end{tabular}
%Source: https://freestatistics.org/blog/index.php?pk=22121&T=0

[TABLE]
[ROW][C]Summary of computational transaction[/C][/ROW]
[ROW][C]Raw Input[/C][C]view raw input (R code) [/C][/ROW]
[ROW][C]Raw Output[/C][C]view raw output of R engine [/C][/ROW]
[ROW][C]Computing time[/C][C]2 seconds[/C][/ROW]
[ROW][C]R Server[/C][C]'George Udny Yule' @ 72.249.76.132[/C][/ROW]
[/TABLE]
Source: https://freestatistics.org/blog/index.php?pk=22121&T=0

Globally Unique Identifier (entire table): ba.freestatistics.org/blog/index.php?pk=22121&T=0

As an alternative you can also use a QR Code:  

The GUIDs for individual cells are displayed in the table below:

Summary of computational transaction
Raw Inputview raw input (R code)
Raw Outputview raw output of R engine
Computing time2 seconds
R Server'George Udny Yule' @ 72.249.76.132


Parameters (Session):
par1 = 12 ;
Parameters (R input):
par1 = 12 ;
R code (references can be found in the software module):
par1 <- as.numeric(par1)
(n <- length(x))
(np <- floor(n / par1))
arr <- array(NA,dim=c(par1,np+1))
darr <- array(NA,dim=c(par1,np+1))
ari <- array(0,dim=par1)
dx <- diff(x)
j <- 0
for (i in 1:n)
{
j = j + 1
ari[j] = ari[j] + 1
arr[j,ari[j]] <- x[i]
darr[j,ari[j]] <- dx[i]
if (j == par1) j = 0
}
ari
arr
darr
arr.mean <- array(NA,dim=par1)
arr.median <- array(NA,dim=par1)
arr.midrange <- array(NA,dim=par1)
for (j in 1:par1)
{
arr.mean[j] <- mean(arr[j,],na.rm=TRUE)
arr.median[j] <- median(arr[j,],na.rm=TRUE)
arr.midrange[j] <- (quantile(arr[j,],0.75,na.rm=TRUE) + quantile(arr[j,],0.25,na.rm=TRUE)) / 2
}
overall.mean <- mean(x)
overall.median <- median(x)
overall.midrange <- (quantile(x,0.75) + quantile(x,0.25)) / 2
bitmap(file='plot1.png')
plot(arr.mean,type='b',ylab='mean',main='Mean Plot',xlab='Periodic Index')
mtext(paste('#blocks = ',np))
abline(overall.mean,0)
dev.off()
bitmap(file='plot2.png')
plot(arr.median,type='b',ylab='median',main='Median Plot',xlab='Periodic Index')
mtext(paste('#blocks = ',np))
abline(overall.median,0)
dev.off()
bitmap(file='plot3.png')
plot(arr.midrange,type='b',ylab='midrange',main='Midrange Plot',xlab='Periodic Index')
mtext(paste('#blocks = ',np))
abline(overall.midrange,0)
dev.off()
bitmap(file='plot4.png')
z <- data.frame(t(arr))
names(z) <- c(1:par1)
(boxplot(z,notch=TRUE,col='grey',xlab='Periodic Index',ylab='Value',main='Notched Box Plots - Periodic Subseries'))
dev.off()
bitmap(file='plot4b.png')
z <- data.frame(t(darr))
names(z) <- c(1:par1)
(boxplot(z,notch=TRUE,col='grey',xlab='Periodic Index',ylab='Value',main='Notched Box Plots - Differenced Periodic Subseries'))
dev.off()
bitmap(file='plot5.png')
z <- data.frame(arr)
names(z) <- c(1:np)
(boxplot(z,notch=TRUE,col='grey',xlab='Block Index',ylab='Value',main='Notched Box Plots - Sequential Blocks'))
dev.off()
bitmap(file='plot6.png')
z <- data.frame(cbind(arr.mean,arr.median,arr.midrange))
names(z) <- list('mean','median','midrange')
(boxplot(z,notch=TRUE,col='grey',ylab='Overall Central Tendency',main='Notched Box Plots'))
dev.off()