Free Statistics

of Irreproducible Research!

Author's title

Author*Unverified author*
R Software Modulerwasp_pairs.wasp
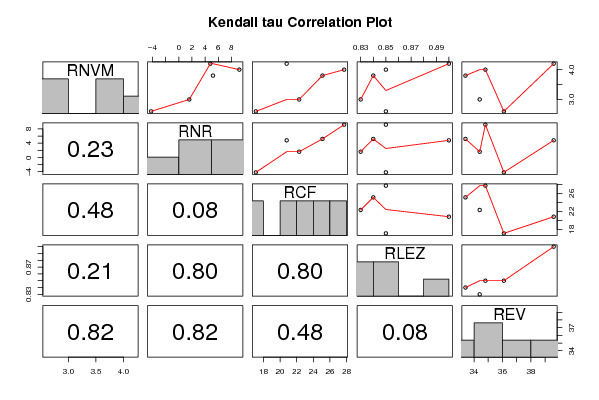
Title produced by softwareKendall tau Correlation Matrix
Date of computationThu, 06 Nov 2008 04:31:00 -0700
Cite this page as followsStatistical Computations at FreeStatistics.org, Office for Research Development and Education, URL https://freestatistics.org/blog/index.php?v=date/2008/Nov/06/t12259711759vnocyc1gumst5s.htm/, Retrieved Sun, 19 May 2024 05:51:24 +0000
Statistical Computations at FreeStatistics.org, Office for Research Development and Education, URL https://freestatistics.org/blog/index.php?pk=22021, Retrieved Sun, 19 May 2024 05:51:24 +0000
QR Codes:

Original text written by user:
IsPrivate?No (this computation is public)
User-defined keywords
Estimated Impact143
Family? (F = Feedback message, R = changed R code, M = changed R Module, P = changed Parameters, D = changed Data)
F       [Kendall tau Correlation Matrix] [sarah opdracht 2 Q1] [2008-11-06 11:31:00] [e8ace8b3d80d7fc51f1760fb13a6fe6b] [Current]
Feedback Forum
2008-11-11 14:44:24 [Hundra Smet] [reply
de student heeft hier een foute matrix gemaakt door slechts een deel van de dataserie op te nemen.
zo is bvb. de cashflow de beste voorspeller voor rendement omdat de correlatie het hoogst is tussen beide.
de p waarde (geeft toevalligheid weer van correlatie) is daar 0,01, wat niet toe te schrijven is aan het toeval, want 0,01<0,05. => er bestaat maar 1% kans dat het vertoonde patroon te wijten is aan het toeval en dus is deze schatter erg betrouwbaar.
op de scatterplot zien we ook een bijna perfect lineair verband. hun correlatie is dan ook 0,87

de student geeft in zijn oplossing een 0,08 als vb. en zegt dat de correlatie dus niet aan het toeval toegeschreven kan worden. dit is echter niet juist. want 0,08>0,05.
wat de student zegt over de hoge correlatie tss RCF en RNR klopt wel, maar er wordt een fout getal gebruikt, door de foute matrix.
2008-11-11 20:48:06 [Peter Van Doninck] [reply
De student heeft duidelijk gebruik gemaakt van een verkeerde matrix! Er wordt niet gesproken over een transformatie die doorgevoerd wordt. De cashflow is de beste voorspeller van het rendement. Toch is er in deze matrix een p-waarde die 0,08 bedraagt, wat te groot is! Hierdoor spreken we van toeval! De student heeft echter wel de juiste conclusie getrokken, nl dat de cashflow de beste voorspeller is van het rendement, maar dit door de verkeerde matrix!
2008-11-12 10:17:23 [Marie-Lien Loos] [reply
Ik denk dat je cijfers fout zijn, maar dit heeft geen invloed op je conclusie. RNR en RCF hebben hier een bijna lineair verband en de p-waarde is ook het kleinst. Deze p-waarde wil zeggen: voor hoever de correlatie gebasseerd is op toeval.

Post a new message
Dataseries X:
4,2	4.8	20.8	0.9	39.6
2,6	-4,2	17.1	0.85	36.1
3	1.6	22.3	0.83	34.4
3.8	5.2	25.1	0,84	33.4
4	9.2	27.7	0.85	34,8


Summary of computational transaction
Raw Inputview raw input (R code)
Raw Outputview raw output of R engine
Computing time1 seconds
R Server'George Udny Yule' @ 72.249.76.132

\begin{tabular}{lllllllll}
\hline
Summary of computational transaction \tabularnewline
Raw Input & view raw input (R code)  \tabularnewline
Raw Output & view raw output of R engine  \tabularnewline
Computing time & 1 seconds \tabularnewline
R Server & 'George Udny Yule' @ 72.249.76.132 \tabularnewline
\hline
\end{tabular}
%Source: https://freestatistics.org/blog/index.php?pk=22021&T=0

[TABLE]
[ROW][C]Summary of computational transaction[/C][/ROW]
[ROW][C]Raw Input[/C][C]view raw input (R code) [/C][/ROW]
[ROW][C]Raw Output[/C][C]view raw output of R engine [/C][/ROW]
[ROW][C]Computing time[/C][C]1 seconds[/C][/ROW]
[ROW][C]R Server[/C][C]'George Udny Yule' @ 72.249.76.132[/C][/ROW]
[/TABLE]
Source: https://freestatistics.org/blog/index.php?pk=22021&T=0

Globally Unique Identifier (entire table): ba.freestatistics.org/blog/index.php?pk=22021&T=0

As an alternative you can also use a QR Code:  

The GUIDs for individual cells are displayed in the table below:

Summary of computational transaction
Raw Inputview raw input (R code)
Raw Outputview raw output of R engine
Computing time1 seconds
R Server'George Udny Yule' @ 72.249.76.132


Kendall tau rank correlations for all pairs of data series
pairtaup-value
tau( RNVM , RNR )0.60.233333333333333
tau( RNVM , RCF )0.40.483333333333333
tau( RNVM , RLEZ )0.527046276694730.206507295485425
tau( RNVM , REV )0.20.816666666666667
tau( RNR , RCF )0.80.0833333333333333
tau( RNR , RLEZ )0.1054092553389460.800542107423126
tau( RNR , REV )-0.20.816666666666667
tau( RCF , RLEZ )-0.1054092553389460.800542107423126
tau( RCF , REV )-0.40.483333333333333
tau( RLEZ , REV )0.7378647873726220.0769741729812667

\begin{tabular}{lllllllll}
\hline
Kendall tau rank correlations for all pairs of data series \tabularnewline
pair & tau & p-value \tabularnewline
tau( RNVM , RNR ) & 0.6 & 0.233333333333333 \tabularnewline
tau( RNVM , RCF ) & 0.4 & 0.483333333333333 \tabularnewline
tau( RNVM , RLEZ ) & 0.52704627669473 & 0.206507295485425 \tabularnewline
tau( RNVM , REV ) & 0.2 & 0.816666666666667 \tabularnewline
tau( RNR , RCF ) & 0.8 & 0.0833333333333333 \tabularnewline
tau( RNR , RLEZ ) & 0.105409255338946 & 0.800542107423126 \tabularnewline
tau( RNR , REV ) & -0.2 & 0.816666666666667 \tabularnewline
tau( RCF , RLEZ ) & -0.105409255338946 & 0.800542107423126 \tabularnewline
tau( RCF , REV ) & -0.4 & 0.483333333333333 \tabularnewline
tau( RLEZ , REV ) & 0.737864787372622 & 0.0769741729812667 \tabularnewline
\hline
\end{tabular}
%Source: https://freestatistics.org/blog/index.php?pk=22021&T=1

[TABLE]
[ROW][C]Kendall tau rank correlations for all pairs of data series[/C][/ROW]
[ROW][C]pair[/C][C]tau[/C][C]p-value[/C][/ROW]
[ROW][C]tau( RNVM , RNR )[/C][C]0.6[/C][C]0.233333333333333[/C][/ROW]
[ROW][C]tau( RNVM , RCF )[/C][C]0.4[/C][C]0.483333333333333[/C][/ROW]
[ROW][C]tau( RNVM , RLEZ )[/C][C]0.52704627669473[/C][C]0.206507295485425[/C][/ROW]
[ROW][C]tau( RNVM , REV )[/C][C]0.2[/C][C]0.816666666666667[/C][/ROW]
[ROW][C]tau( RNR , RCF )[/C][C]0.8[/C][C]0.0833333333333333[/C][/ROW]
[ROW][C]tau( RNR , RLEZ )[/C][C]0.105409255338946[/C][C]0.800542107423126[/C][/ROW]
[ROW][C]tau( RNR , REV )[/C][C]-0.2[/C][C]0.816666666666667[/C][/ROW]
[ROW][C]tau( RCF , RLEZ )[/C][C]-0.105409255338946[/C][C]0.800542107423126[/C][/ROW]
[ROW][C]tau( RCF , REV )[/C][C]-0.4[/C][C]0.483333333333333[/C][/ROW]
[ROW][C]tau( RLEZ , REV )[/C][C]0.737864787372622[/C][C]0.0769741729812667[/C][/ROW]
[/TABLE]
Source: https://freestatistics.org/blog/index.php?pk=22021&T=1

Globally Unique Identifier (entire table): ba.freestatistics.org/blog/index.php?pk=22021&T=1

As an alternative you can also use a QR Code:  

The GUIDs for individual cells are displayed in the table below:

Kendall tau rank correlations for all pairs of data series
pairtaup-value
tau( RNVM , RNR )0.60.233333333333333
tau( RNVM , RCF )0.40.483333333333333
tau( RNVM , RLEZ )0.527046276694730.206507295485425
tau( RNVM , REV )0.20.816666666666667
tau( RNR , RCF )0.80.0833333333333333
tau( RNR , RLEZ )0.1054092553389460.800542107423126
tau( RNR , REV )-0.20.816666666666667
tau( RCF , RLEZ )-0.1054092553389460.800542107423126
tau( RCF , REV )-0.40.483333333333333
tau( RLEZ , REV )0.7378647873726220.0769741729812667


Parameters (Session):
Parameters (R input):
R code (references can be found in the software module):
panel.tau <- function(x, y, digits=2, prefix='', cex.cor)
{
usr <- par('usr'); on.exit(par(usr))
par(usr = c(0, 1, 0, 1))
rr <- cor.test(x, y, method='kendall')
r <- round(rr$p.value,2)
txt <- format(c(r, 0.123456789), digits=digits)[1]
txt <- paste(prefix, txt, sep='')
if(missing(cex.cor)) cex <- 0.5/strwidth(txt)
text(0.5, 0.5, txt, cex = cex)
}
panel.hist <- function(x, ...)
{
usr <- par('usr'); on.exit(par(usr))
par(usr = c(usr[1:2], 0, 1.5) )
h <- hist(x, plot = FALSE)
breaks <- h$breaks; nB <- length(breaks)
y <- h$counts; y <- y/max(y)
rect(breaks[-nB], 0, breaks[-1], y, col='grey', ...)
}
bitmap(file='test1.png')
pairs(t(y),diag.panel=panel.hist, upper.panel=panel.smooth, lower.panel=panel.tau, main=main)
dev.off()
load(file='createtable')
a<-table.start()
a<-table.row.start(a)
a<-table.element(a,'Kendall tau rank correlations for all pairs of data series',3,TRUE)
a<-table.row.end(a)
a<-table.row.start(a)
a<-table.element(a,'pair',1,TRUE)
a<-table.element(a,'tau',1,TRUE)
a<-table.element(a,'p-value',1,TRUE)
a<-table.row.end(a)
n <- length(y[,1])
n
cor.test(y[1,],y[2,],method='kendall')
for (i in 1:(n-1))
{
for (j in (i+1):n)
{
a<-table.row.start(a)
dum <- paste('tau(',dimnames(t(x))[[2]][i])
dum <- paste(dum,',')
dum <- paste(dum,dimnames(t(x))[[2]][j])
dum <- paste(dum,')')
a<-table.element(a,dum,header=TRUE)
r <- cor.test(y[i,],y[j,],method='kendall')
a<-table.element(a,r$estimate)
a<-table.element(a,r$p.value)
a<-table.row.end(a)
}
}
a<-table.end(a)
table.save(a,file='mytable.tab')