Free Statistics

of Irreproducible Research!

Author's title

Author*The author of this computation has been verified*
R Software Modulerwasp_meanplot.wasp
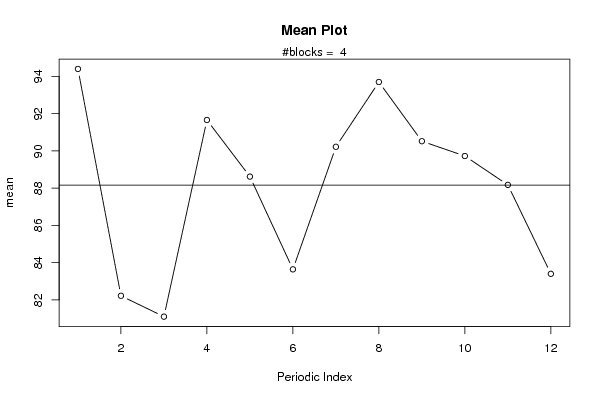
Title produced by softwareMean Plot
Date of computationWed, 05 Nov 2008 11:17:47 -0700
Cite this page as followsStatistical Computations at FreeStatistics.org, Office for Research Development and Education, URL https://freestatistics.org/blog/index.php?v=date/2008/Nov/05/t1225909799yib1eqvksxgv0qw.htm/, Retrieved Sun, 19 May 2024 09:40:13 +0000
Statistical Computations at FreeStatistics.org, Office for Research Development and Education, URL https://freestatistics.org/blog/index.php?pk=21874, Retrieved Sun, 19 May 2024 09:40:13 +0000
QR Codes:

Original text written by user:
IsPrivate?No (this computation is public)
User-defined keywords
Estimated Impact180
Family? (F = Feedback message, R = changed R code, M = changed R Module, P = changed Parameters, D = changed Data)
F       [Mean Plot] [k_vanderheggen Wo...] [2008-11-05 18:17:47] [547f3960ab1cda94661cd6e0871d2c7b] [Current]
- R       [Mean Plot] [Correctie task 4] [2008-11-09 16:23:06] [b1bd16d1f47bfe13feacf1c27a0abba5]
Feedback Forum
2008-11-10 10:33:22 [Jasmine Hendrikx] [reply
Evaluatie task 4:

De student heeft de foute R code gebruikt. In de berekening heeft de student enkel het eerste deel, namelijk x <- x[x>quantile(x,0.05) gebruikt. Je moet dus ook nog het andere ontbrekende deel in de R-code zetten. Hieronder staat de URL waarin ik de berekening terug opnieuw heb gemaakt:
http://www.freestatistics.org/blog/index.php?v=date/2008/Nov/09/t12262478839cv3xiubvh0k72t.htm
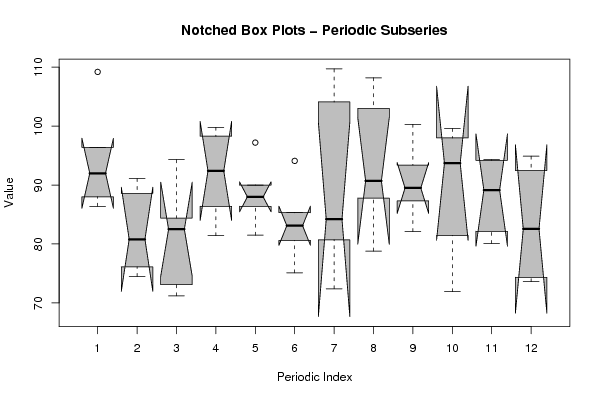
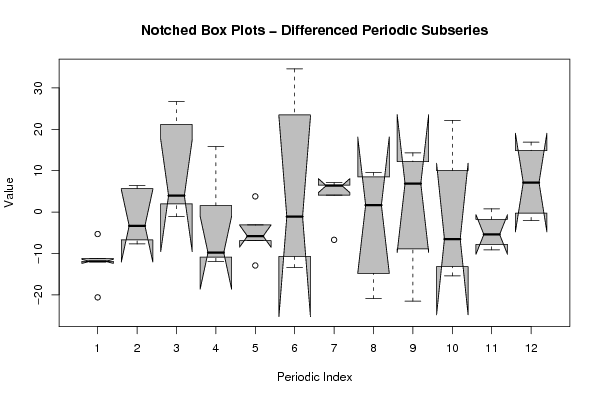
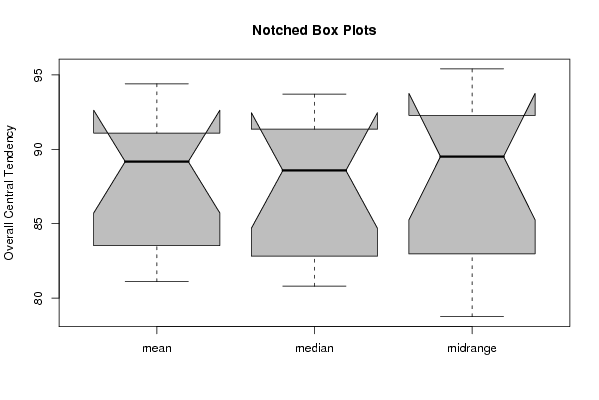
Je ziet dus duidelijke verschillen wanneer je Q2 oplost met alle gegevens of met de gegevens waarvan de hoogste en laagste 5% zijn weggelaten. Zo zie je dat bij de ‘notched boxplots -periodic subseries’ de inkepingen elkaar meer overlappen. Je zou daaruit kunnen concluderen dat de maanden dus niet significant van elkaar verschillen en dat seizoenaliteit niet zo’n grote rol speelt wanneer je werkt met gegevens waarvan de hoogste en laagste 5% zijn uitgesloten.
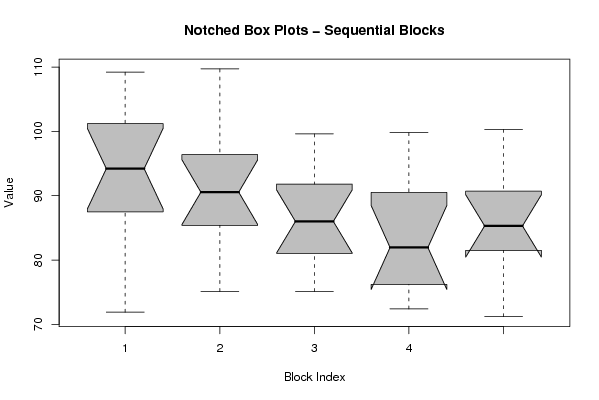
Als je dan Q3 vergelijkt, zie je dat de mediaan van de kledingproductie over de jaren heen niet meer altijd daalt, maar in jaar 3 en jaar 5 zelfs lichtjes stijgt. Het is duidelijk dat de inkepingen van de notched boxplots elkaar overlappen en dus kunnen we bijgevolg spreken van niet-significante stijgingen of dalingen in de mediaan. Deze stijgingen of dalingen van de mediaan van de kledingsector is dus hoogstwaarschijnlijk te wijten aan toeval (dit konden we ook opmerken wanneer we werkten met alle gegevens (task 1)).
Het wegwerken van de hoogste en laagste 5% heeft ook tot gevolg dat de 'staarten' worden afgeknipt, waardoor de spreiding dus verkleint.
2008-11-12 00:20:24 [Jessica Alves Pires] [reply
Ik ben het volledig eens met Jasmine, ik heb niets om toe te voegen.
2008-11-12 09:31:30 [Jolien Van Landeghem] [reply
Het weglaten van de 5% grootste en kleinste gegevens geeft een ander meanplot en notched boxplot. Bij de meanplot zie je heel duidelijk dat er aftoppingen zijn, bij de notched boxplot overlappen de inkepingen meer, zoals jasmine zei. Maar als je deze waarden weglaat, gaan er gegevens ontbreken. Deze waarden zullen opschuiven. Je kan de gegevens van deze plots dus niet echt gaan interpreteren.

Post a new message
Dataseries X:
109.20
88.60
94.30
98.30
86.40
80.60
104.10
108.20
93.40
71.90
94.10
94.90
96.40
91.10
84.40
86.40
88.00
75.10
109.70
103.00
82.10
68.00
96.40
94.30
90.00
88.00
76.10
82.50
81.40
66.50
97.20
94.10
80.70
70.50
87.80
89.50
99.60
84.20
75.10
92.00
80.80
73.10
99.80
90.00
83.10
72.40
78.80
87.30
91.00
80.10
73.60
86.40
74.50
71.20
92.40
81.50
85.30
69.90
84.20
90.70
100.30


Summary of computational transaction
Raw Inputview raw input (R code)
Raw Outputview raw output of R engine
Computing time2 seconds
R Server'George Udny Yule' @ 72.249.76.132

\begin{tabular}{lllllllll}
\hline
Summary of computational transaction \tabularnewline
Raw Input & view raw input (R code)  \tabularnewline
Raw Output & view raw output of R engine  \tabularnewline
Computing time & 2 seconds \tabularnewline
R Server & 'George Udny Yule' @ 72.249.76.132 \tabularnewline
\hline
\end{tabular}
%Source: https://freestatistics.org/blog/index.php?pk=21874&T=0

[TABLE]
[ROW][C]Summary of computational transaction[/C][/ROW]
[ROW][C]Raw Input[/C][C]view raw input (R code) [/C][/ROW]
[ROW][C]Raw Output[/C][C]view raw output of R engine [/C][/ROW]
[ROW][C]Computing time[/C][C]2 seconds[/C][/ROW]
[ROW][C]R Server[/C][C]'George Udny Yule' @ 72.249.76.132[/C][/ROW]
[/TABLE]
Source: https://freestatistics.org/blog/index.php?pk=21874&T=0

Globally Unique Identifier (entire table): ba.freestatistics.org/blog/index.php?pk=21874&T=0

As an alternative you can also use a QR Code:  

The GUIDs for individual cells are displayed in the table below:

Summary of computational transaction
Raw Inputview raw input (R code)
Raw Outputview raw output of R engine
Computing time2 seconds
R Server'George Udny Yule' @ 72.249.76.132


Parameters (Session):
par1 = 12 ;
Parameters (R input):
par1 = 12 ;
R code (references can be found in the software module):
x <- x[x>quantile(x,0.05)] 
par1 <- as.numeric(par1)
(n <- length(x))
(np <- floor(n / par1))
arr <- array(NA,dim=c(par1,np+1))
darr <- array(NA,dim=c(par1,np+1))
ari <- array(0,dim=par1)
dx <- diff(x)
j <- 0
for (i in 1:n)
{
j = j + 1
ari[j] = ari[j] + 1
arr[j,ari[j]] <- x[i]
darr[j,ari[j]] <- dx[i]
if (j == par1) j = 0
}
ari
arr
darr
arr.mean <- array(NA,dim=par1)
arr.median <- array(NA,dim=par1)
arr.midrange <- array(NA,dim=par1)
for (j in 1:par1)
{
arr.mean[j] <- mean(arr[j,],na.rm=TRUE)
arr.median[j] <- median(arr[j,],na.rm=TRUE)
arr.midrange[j] <- (quantile(arr[j,],0.75,na.rm=TRUE) + quantile(arr[j,],0.25,na.rm=TRUE)) / 2
}
overall.mean <- mean(x)
overall.median <- median(x)
overall.midrange <- (quantile(x,0.75) + quantile(x,0.25)) / 2
bitmap(file='plot1.png')
plot(arr.mean,type='b',ylab='mean',main='Mean Plot',xlab='Periodic Index')
mtext(paste('#blocks = ',np))
abline(overall.mean,0)
dev.off()
bitmap(file='plot2.png')
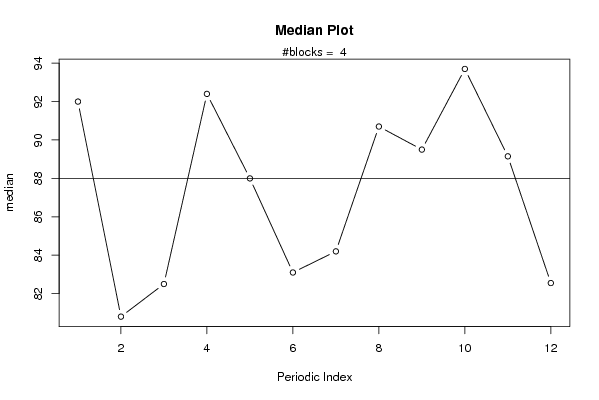
plot(arr.median,type='b',ylab='median',main='Median Plot',xlab='Periodic Index')
mtext(paste('#blocks = ',np))
abline(overall.median,0)
dev.off()
bitmap(file='plot3.png')
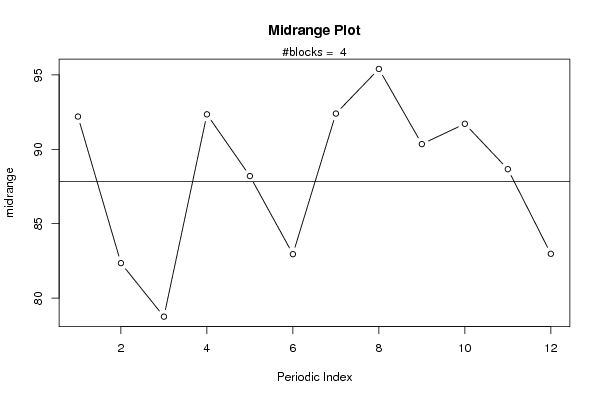
plot(arr.midrange,type='b',ylab='midrange',main='Midrange Plot',xlab='Periodic Index')
mtext(paste('#blocks = ',np))
abline(overall.midrange,0)
dev.off()
bitmap(file='plot4.png')
z <- data.frame(t(arr))
names(z) <- c(1:par1)
(boxplot(z,notch=TRUE,col='grey',xlab='Periodic Index',ylab='Value',main='Notched Box Plots - Periodic Subseries'))
dev.off()
bitmap(file='plot4b.png')
z <- data.frame(t(darr))
names(z) <- c(1:par1)
(boxplot(z,notch=TRUE,col='grey',xlab='Periodic Index',ylab='Value',main='Notched Box Plots - Differenced Periodic Subseries'))
dev.off()
bitmap(file='plot5.png')
z <- data.frame(arr)
names(z) <- c(1:np)
(boxplot(z,notch=TRUE,col='grey',xlab='Block Index',ylab='Value',main='Notched Box Plots - Sequential Blocks'))
dev.off()
bitmap(file='plot6.png')
z <- data.frame(cbind(arr.mean,arr.median,arr.midrange))
names(z) <- list('mean','median','midrange')
(boxplot(z,notch=TRUE,col='grey',ylab='Overall Central Tendency',main='Notched Box Plots'))
dev.off()