Free Statistics

of Irreproducible Research!

Author's title

Author*Unverified author*
R Software Modulerwasp_pairs.wasp
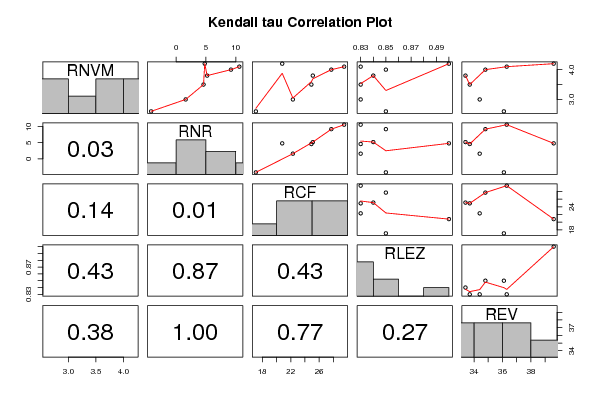
Title produced by softwareKendall tau Correlation Matrix
Date of computationWed, 05 Nov 2008 08:15:34 -0700
Cite this page as followsStatistical Computations at FreeStatistics.org, Office for Research Development and Education, URL https://freestatistics.org/blog/index.php?v=date/2008/Nov/05/t12258982050l19brnuwemj78l.htm/, Retrieved Sun, 19 May 2024 08:46:31 +0000
Statistical Computations at FreeStatistics.org, Office for Research Development and Education, URL https://freestatistics.org/blog/index.php?pk=21805, Retrieved Sun, 19 May 2024 08:46:31 +0000
QR Codes:

Original text written by user:
IsPrivate?No (this computation is public)
User-defined keywordsnathalieh_daneels@hotmail.com
Estimated Impact161
Family? (F = Feedback message, R = changed R code, M = changed R Module, P = changed Parameters, D = changed Data)
F     [Mean Plot] [workshop 3] [2007-10-26 12:14:28] [e9ffc5de6f8a7be62f22b142b5b6b1a8]
F RM D    [Kendall tau Correlation Matrix] [Opdracht 2: Q1] [2008-11-05 15:15:34] [1351baa662f198be3bff32f9007a9a6d] [Current]
Feedback Forum
2008-11-09 13:28:07 [Nathalie Daneels] [reply
Evaluatie opdracht 2: Task 1:
Ik zou dit nog bij in de conclusie vermelden:
Als we naar de spreadsheet met gegevens kijken, kunnen we vaststellen dat de tijd op de horizontale as staat en de variabelen op de verticale as. Het is zo dat de tijd altijd op de verticale as moet staan, daarom moet de tabel dus getransponeerd worden. Deze tabel moet ook bij in het werk worden opgenomen. We hebben voor het oplossen van deze opdracht gebruik gemaakt van de Kendall Tau Rang Correlation: deze grafiek geeft een overzicht van alle correlaties van de variabelen in 1 keer: Op de hoofddiagonaal staat een histogram van elke variabele ; rechts boven de hoofddiagonaal zijn de scatterplots gegeven (per 2 variabelen) en links onder de hoofddiagonaal staat de probabiliteit van de variabelen (en niet de correlatiecoëfficient) of met andere woorden de waarschijnlijkheid dat het verband aan het toeval kan worden toegeschreven (hoe hoger het getal, hoe meer waarschijnlijk dat het verband aan het toeval kan worden toegeschreven). Deze grafiek is ook een heel goede maatstaf: het ondervindt veel minder invloed van outliers en is veel robuster.
De student heeft de juiste conclusie gemaakt betreffende welke variabele de beste boekhoudkundige predictor is voor RNR. De betrouwbaarheid bij deze variabele(de cashflow) is kleiner dan 0,05: dus het is zeer onwaarschijnlijk dat het verband aan het toeval kan worden toegeschreven. (Hoe hoger deze probabiliteit, hoe slechter de correlatie). De student heeft voor de rest ook goed uitlegd waarom deze variabele precies de beste boekhoudkundige predictor is.

2008-11-09 16:12:38 [Gert-Jan Geudens] [reply
Het antwoord dat de studente heeft gegeven is redelijk volledig. Al zou ik graag nog even willen opmerken dat zij niets besproken heeft betreffende de correlatie waarde van 0.83. Deze waarde wijst op een positief verband en des te dichter deze waarde bij 1 ligt, des te groter het positief verband. De kans dat dit verband aan het toeval is te wijten, is slechts 1% en dus -zoals zij zelf reeds heeft beschreven- zeer onwaarschijnlijk.

Post a new message
Dataseries X:
4.2	4.8	20.8	0.9	39.6
2.6	-4.2	17.1	0.85	36.1
3	1.6	22.3	0.83	34.4
3.8	5.2	25.1	0.84	33.4
4	9.2	27.7	0.85	34.8
3.5	4.6	24.9	0.83	33.7
4.1	10.6	29.5	0.83	36.3


Summary of computational transaction
Raw Inputview raw input (R code)
Raw Outputview raw output of R engine
Computing time1 seconds
R Server'Gwilym Jenkins' @ 72.249.127.135
R Framework error message
The field 'Names of X columns' contains a hard return which cannot be interpreted.
Please, resubmit your request without hard returns in the 'Names of X columns'.

\begin{tabular}{lllllllll}
\hline
Summary of computational transaction \tabularnewline
Raw Input & view raw input (R code)  \tabularnewline
Raw Output & view raw output of R engine  \tabularnewline
Computing time & 1 seconds \tabularnewline
R Server & 'Gwilym Jenkins' @ 72.249.127.135 \tabularnewline
R Framework error message & 
The field 'Names of X columns' contains a hard return which cannot be interpreted.
Please, resubmit your request without hard returns in the 'Names of X columns'.
\tabularnewline \hline \end{tabular} %Source: https://freestatistics.org/blog/index.php?pk=21805&T=0

[TABLE]
[ROW][C]Summary of computational transaction[/C][/ROW]
[ROW][C]Raw Input[/C][C]view raw input (R code) [/C][/ROW]
[ROW][C]Raw Output[/C][C]view raw output of R engine [/C][/ROW]
[ROW][C]Computing time[/C][C]1 seconds[/C][/ROW]
[ROW][C]R Server[/C][C]'Gwilym Jenkins' @ 72.249.127.135[/C][/ROW]
[ROW][C]R Framework error message[/C][C]
The field 'Names of X columns' contains a hard return which cannot be interpreted.
Please, resubmit your request without hard returns in the 'Names of X columns'.
[/C][/ROW] [/TABLE] Source: https://freestatistics.org/blog/index.php?pk=21805&T=0

Globally Unique Identifier (entire table): ba.freestatistics.org/blog/index.php?pk=21805&T=0

As an alternative you can also use a QR Code:  

The GUIDs for individual cells are displayed in the table below:

Summary of computational transaction
Raw Inputview raw input (R code)
Raw Outputview raw output of R engine
Computing time1 seconds
R Server'Gwilym Jenkins' @ 72.249.127.135
R Framework error message
The field 'Names of X columns' contains a hard return which cannot be interpreted.
Please, resubmit your request without hard returns in the 'Names of X columns'.


Kendall tau rank correlations for all pairs of data series
pairtaup-value
tau( RNVM , RNR )0.7142857142857140.0301587301587301
tau( RNVM , RCF )0.5238095238095240.136111111111111
tau( RNVM , RLEZ )0.2646280620124820.427262856745706
tau( RNVM , REV )0.3333333333333330.381349206349206
tau( RNR , RCF )0.809523809523810.0107142857142857
tau( RNR , RLEZ )-0.05292561240249630.873844698517373
tau( RNR , REV )0.04761904761904761
tau( RCF , RLEZ )-0.2646280620124820.427262856745706
tau( RCF , REV )-0.1428571428571430.772619047619048
tau( RLEZ , REV )0.3704792868174740.266379923342483

\begin{tabular}{lllllllll}
\hline
Kendall tau rank correlations for all pairs of data series \tabularnewline
pair & tau & p-value \tabularnewline
tau( RNVM , RNR ) & 0.714285714285714 & 0.0301587301587301 \tabularnewline
tau( RNVM , RCF ) & 0.523809523809524 & 0.136111111111111 \tabularnewline
tau( RNVM , RLEZ ) & 0.264628062012482 & 0.427262856745706 \tabularnewline
tau( RNVM , REV
 ) & 0.333333333333333 & 0.381349206349206 \tabularnewline
tau( RNR , RCF ) & 0.80952380952381 & 0.0107142857142857 \tabularnewline
tau( RNR , RLEZ ) & -0.0529256124024963 & 0.873844698517373 \tabularnewline
tau( RNR , REV
 ) & 0.0476190476190476 & 1 \tabularnewline
tau( RCF , RLEZ ) & -0.264628062012482 & 0.427262856745706 \tabularnewline
tau( RCF , REV
 ) & -0.142857142857143 & 0.772619047619048 \tabularnewline
tau( RLEZ , REV
 ) & 0.370479286817474 & 0.266379923342483 \tabularnewline
\hline
\end{tabular}
%Source: https://freestatistics.org/blog/index.php?pk=21805&T=1

[TABLE]
[ROW][C]Kendall tau rank correlations for all pairs of data series[/C][/ROW]
[ROW][C]pair[/C][C]tau[/C][C]p-value[/C][/ROW]
[ROW][C]tau( RNVM , RNR )[/C][C]0.714285714285714[/C][C]0.0301587301587301[/C][/ROW]
[ROW][C]tau( RNVM , RCF )[/C][C]0.523809523809524[/C][C]0.136111111111111[/C][/ROW]
[ROW][C]tau( RNVM , RLEZ )[/C][C]0.264628062012482[/C][C]0.427262856745706[/C][/ROW]
[ROW][C]tau( RNVM , REV
 )[/C][C]0.333333333333333[/C][C]0.381349206349206[/C][/ROW]
[ROW][C]tau( RNR , RCF )[/C][C]0.80952380952381[/C][C]0.0107142857142857[/C][/ROW]
[ROW][C]tau( RNR , RLEZ )[/C][C]-0.0529256124024963[/C][C]0.873844698517373[/C][/ROW]
[ROW][C]tau( RNR , REV
 )[/C][C]0.0476190476190476[/C][C]1[/C][/ROW]
[ROW][C]tau( RCF , RLEZ )[/C][C]-0.264628062012482[/C][C]0.427262856745706[/C][/ROW]
[ROW][C]tau( RCF , REV
 )[/C][C]-0.142857142857143[/C][C]0.772619047619048[/C][/ROW]
[ROW][C]tau( RLEZ , REV
 )[/C][C]0.370479286817474[/C][C]0.266379923342483[/C][/ROW]
[/TABLE]
Source: https://freestatistics.org/blog/index.php?pk=21805&T=1

Globally Unique Identifier (entire table): ba.freestatistics.org/blog/index.php?pk=21805&T=1

As an alternative you can also use a QR Code:  

The GUIDs for individual cells are displayed in the table below:

Kendall tau rank correlations for all pairs of data series
pairtaup-value
tau( RNVM , RNR )0.7142857142857140.0301587301587301
tau( RNVM , RCF )0.5238095238095240.136111111111111
tau( RNVM , RLEZ )0.2646280620124820.427262856745706
tau( RNVM , REV )0.3333333333333330.381349206349206
tau( RNR , RCF )0.809523809523810.0107142857142857
tau( RNR , RLEZ )-0.05292561240249630.873844698517373
tau( RNR , REV )0.04761904761904761
tau( RCF , RLEZ )-0.2646280620124820.427262856745706
tau( RCF , REV )-0.1428571428571430.772619047619048
tau( RLEZ , REV )0.3704792868174740.266379923342483


Parameters (Session):
par1 = 12 ;
Parameters (R input):
R code (references can be found in the software module):
panel.tau <- function(x, y, digits=2, prefix='', cex.cor)
{
usr <- par('usr'); on.exit(par(usr))
par(usr = c(0, 1, 0, 1))
rr <- cor.test(x, y, method='kendall')
r <- round(rr$p.value,2)
txt <- format(c(r, 0.123456789), digits=digits)[1]
txt <- paste(prefix, txt, sep='')
if(missing(cex.cor)) cex <- 0.5/strwidth(txt)
text(0.5, 0.5, txt, cex = cex)
}
panel.hist <- function(x, ...)
{
usr <- par('usr'); on.exit(par(usr))
par(usr = c(usr[1:2], 0, 1.5) )
h <- hist(x, plot = FALSE)
breaks <- h$breaks; nB <- length(breaks)
y <- h$counts; y <- y/max(y)
rect(breaks[-nB], 0, breaks[-1], y, col='grey', ...)
}
bitmap(file='test1.png')
pairs(t(y),diag.panel=panel.hist, upper.panel=panel.smooth, lower.panel=panel.tau, main=main)
dev.off()
load(file='createtable')
a<-table.start()
a<-table.row.start(a)
a<-table.element(a,'Kendall tau rank correlations for all pairs of data series',3,TRUE)
a<-table.row.end(a)
a<-table.row.start(a)
a<-table.element(a,'pair',1,TRUE)
a<-table.element(a,'tau',1,TRUE)
a<-table.element(a,'p-value',1,TRUE)
a<-table.row.end(a)
n <- length(y[,1])
n
cor.test(y[1,],y[2,],method='kendall')
for (i in 1:(n-1))
{
for (j in (i+1):n)
{
a<-table.row.start(a)
dum <- paste('tau(',dimnames(t(x))[[2]][i])
dum <- paste(dum,',')
dum <- paste(dum,dimnames(t(x))[[2]][j])
dum <- paste(dum,')')
a<-table.element(a,dum,header=TRUE)
r <- cor.test(y[i,],y[j,],method='kendall')
a<-table.element(a,r$estimate)
a<-table.element(a,r$p.value)
a<-table.row.end(a)
}
}
a<-table.end(a)
table.save(a,file='mytable.tab')