Free Statistics

of Irreproducible Research!

Author's title

Author*Unverified author*
R Software Modulerwasp_notchedbox1.wasp
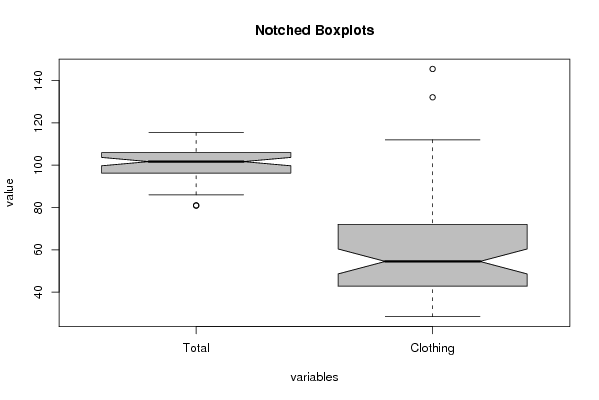
Title produced by softwareNotched Boxplots
Date of computationWed, 05 Nov 2008 04:59:12 -0700
Cite this page as followsStatistical Computations at FreeStatistics.org, Office for Research Development and Education, URL https://freestatistics.org/blog/index.php?v=date/2008/Nov/05/t1225887295bgmmda2se5ev3j3.htm/, Retrieved Sun, 19 May 2024 10:21:48 +0000
Statistical Computations at FreeStatistics.org, Office for Research Development and Education, URL https://freestatistics.org/blog/index.php?pk=21731, Retrieved Sun, 19 May 2024 10:21:48 +0000
QR Codes:

Original text written by user:
IsPrivate?No (this computation is public)
User-defined keywords
Estimated Impact151
Family? (F = Feedback message, R = changed R code, M = changed R Module, P = changed Parameters, D = changed Data)
F       [Notched Boxplots] [] [2008-11-05 11:59:12] [d41d8cd98f00b204e9800998ecf8427e] [Current]
Feedback Forum
2008-11-12 00:07:53 [Anna Hayan] [reply
Task 1:
Q1: de grafiek is juist gemaakt, de interpretatie klopt niet helemaal.
De spreiding is niet relevant hier.Om vast te stellen dat de mediaan significant kleiner,wat wil zeggen dat het verschil tussen de medianen niet te wijten valt aan het toeval. We kijken hiervoor naar de inkepingen of de notches. Deze overlappen elkaar niet waardoor er een duidelijk verschil is.
Ook kan men vaststellen dat aan de hand van het basisgetal 100, gelijkgesteld aan basisjaar 2000, voor de totale productie er een vooruitgang is geboekt en voor de kledingproductie een duidelijke achteruitgang
Q2, Q3, Q4 => niet gemaakt
Task 2:
De berekening en de grafieken kloppen niet. Het zou er zo moeten uitzien
http://www.freestatistics.org/blog/index.php?v=date/2008/Nov/05/t1225908033qhj873328sv8x14.htm
Wat de interpetatie betreft , is die als volgt.

De investeringen zijn het meeste achteruit gegaan tov het basisjaar 2000. dit kan je zien aan de mediaan die significant lager ligt dan de andere die zich ergens rond de waarde 100 situeren of toch in de buurt.
Task 3:

Er werd wél moeite gedaan , maar de grafiek en de berekingen kloppen weeral niet. Zie de link: http://www.freestatistics.org/blog/index.php?v=date/2008/Nov/06/t1225983423hqtqqi5u2m4muvp.htm

Conclusie:

Je transformeert de variabele z naar log(z) in je R code. Je krijgt dan een nieuwe boxplot waar je duidelijk op kan zien dat de outliers verdwenen zijn dus de transformatie zorgt hier voor een verbetering van het resultaat.

Task 4:
De interpretatie is onzinvol. De grafiek klopt wél.
De bijkomende uitleg ziet er als volgt uit:
Als je de eerste en de laatste 5 procent observaties weglaat en dus gaat trimmen dan zie je duidelijk dat we een totaal ander resultaat krijgen. De medianen komen dichter bij elkaar te liggen en dat maakt dat de seizoenaliteit veel minder extreem is in dit voorbeeld maar bijna alle inkepingen overlappen elkaar ook dus dit kan wel op toeval berusten.
Task 5: niet gemaakt
2008-11-12 00:09:02 [Anna Hayan] [reply
De bovenstaande comment geldt dus voor Marie Noyens

Post a new message
Dataseries X:
110.40	72.50
96.40	59.40
101.90	85.70
106.20	88.20
81.00	62.80
94.70	87.00
101.00	79.20
109.40	112.00
102.30	79.20
90.70	132.10
96.20	40.10
96.10	69.00
106.00	59.40
103.10	73.80
102.00	57.40
104.70	81.10
86.00	46.60
92.10	41.40
106.90	71.20
112.60	67.90
101.70	72.00
92.00	145.50
97.40	39.70
97.00	51.90
105.40	73.70
102.70	70.90
98.10	60.80
104.50	61.00
87.40	54.50
89.90	39.10
109.80	66.60
111.70	58.50
98.60	59.80
96.90	80.90
95.10	37.30
97.00	44.60
112.70	48.70
102.90	54.00
97.40	49.50
111.40	61.60
87.40	35.00
96.80	35.70
114.10	51.30
110.30	49.00
103.90	41.50
101.60	72.50
94.60	42.10
95.90	44.10
104.70	45.10
102.80	50.30
98.10	40.90
113.90	47.20
80.90	36.90
95.70	40.90
113.20	38.30
105.90	46.30
108.80	28.40
102.30	78.40
99.00	36.80
100.70	50.70
115.50	42.80


Summary of computational transaction
Raw Inputview raw input (R code)
Raw Outputview raw output of R engine
Computing time1 seconds
R Server'Gwilym Jenkins' @ 72.249.127.135

\begin{tabular}{lllllllll}
\hline
Summary of computational transaction \tabularnewline
Raw Input & view raw input (R code)  \tabularnewline
Raw Output & view raw output of R engine  \tabularnewline
Computing time & 1 seconds \tabularnewline
R Server & 'Gwilym Jenkins' @ 72.249.127.135 \tabularnewline
\hline
\end{tabular}
%Source: https://freestatistics.org/blog/index.php?pk=21731&T=0

[TABLE]
[ROW][C]Summary of computational transaction[/C][/ROW]
[ROW][C]Raw Input[/C][C]view raw input (R code) [/C][/ROW]
[ROW][C]Raw Output[/C][C]view raw output of R engine [/C][/ROW]
[ROW][C]Computing time[/C][C]1 seconds[/C][/ROW]
[ROW][C]R Server[/C][C]'Gwilym Jenkins' @ 72.249.127.135[/C][/ROW]
[/TABLE]
Source: https://freestatistics.org/blog/index.php?pk=21731&T=0

Globally Unique Identifier (entire table): ba.freestatistics.org/blog/index.php?pk=21731&T=0

As an alternative you can also use a QR Code:  

The GUIDs for individual cells are displayed in the table below:

Summary of computational transaction
Raw Inputview raw input (R code)
Raw Outputview raw output of R engine
Computing time1 seconds
R Server'Gwilym Jenkins' @ 72.249.127.135


Boxplot statistics
Variablelower whiskerlower hingemedianupper hingeupper whisker
Total8696.2101.7106115.5
Clothing28.442.854.572112

\begin{tabular}{lllllllll}
\hline
Boxplot statistics \tabularnewline
Variable & lower whisker & lower hinge & median & upper hinge & upper whisker \tabularnewline
Total & 86 & 96.2 & 101.7 & 106 & 115.5 \tabularnewline
Clothing & 28.4 & 42.8 & 54.5 & 72 & 112 \tabularnewline
\hline
\end{tabular}
%Source: https://freestatistics.org/blog/index.php?pk=21731&T=1

[TABLE]
[ROW][C]Boxplot statistics[/C][/ROW]
[ROW][C]Variable[/C][C]lower whisker[/C][C]lower hinge[/C][C]median[/C][C]upper hinge[/C][C]upper whisker[/C][/ROW]
[ROW][C]Total[/C][C]86[/C][C]96.2[/C][C]101.7[/C][C]106[/C][C]115.5[/C][/ROW]
[ROW][C]Clothing[/C][C]28.4[/C][C]42.8[/C][C]54.5[/C][C]72[/C][C]112[/C][/ROW]
[/TABLE]
Source: https://freestatistics.org/blog/index.php?pk=21731&T=1

Globally Unique Identifier (entire table): ba.freestatistics.org/blog/index.php?pk=21731&T=1

As an alternative you can also use a QR Code:  

The GUIDs for individual cells are displayed in the table below:

Boxplot statistics
Variablelower whiskerlower hingemedianupper hingeupper whisker
Total8696.2101.7106115.5
Clothing28.442.854.572112


Boxplot Notches
Variablelower boundmedianupper bound
Total99.717476951119101.7103.682523048881
Clothing48.592890507415954.560.4071094925841

\begin{tabular}{lllllllll}
\hline
Boxplot Notches \tabularnewline
Variable & lower bound & median & upper bound \tabularnewline
Total & 99.717476951119 & 101.7 & 103.682523048881 \tabularnewline
Clothing & 48.5928905074159 & 54.5 & 60.4071094925841 \tabularnewline
\hline
\end{tabular}
%Source: https://freestatistics.org/blog/index.php?pk=21731&T=2

[TABLE]
[ROW][C]Boxplot Notches[/C][/ROW]
[ROW][C]Variable[/C][C]lower bound[/C][C]median[/C][C]upper bound[/C][/ROW]
[ROW][C]Total[/C][C]99.717476951119[/C][C]101.7[/C][C]103.682523048881[/C][/ROW]
[ROW][C]Clothing[/C][C]48.5928905074159[/C][C]54.5[/C][C]60.4071094925841[/C][/ROW]
[/TABLE]
Source: https://freestatistics.org/blog/index.php?pk=21731&T=2

Globally Unique Identifier (entire table): ba.freestatistics.org/blog/index.php?pk=21731&T=2

As an alternative you can also use a QR Code:  

The GUIDs for individual cells are displayed in the table below:

Boxplot Notches
Variablelower boundmedianupper bound
Total99.717476951119101.7103.682523048881
Clothing48.592890507415954.560.4071094925841


Parameters (Session):
par1 = grey ;
Parameters (R input):
par1 = grey ;
R code (references can be found in the software module):
z <- as.data.frame(t(y))
bitmap(file='test1.png')
(r<-boxplot(z ,xlab=xlab,ylab=ylab,main=main,notch=TRUE,col=par1))
dev.off()
load(file='createtable')
a<-table.start()
a<-table.row.start(a)
a<-table.element(a,hyperlink('overview.htm','Boxplot statistics','Boxplot overview'),6,TRUE)
a<-table.row.end(a)
a<-table.row.start(a)
a<-table.element(a,'Variable',1,TRUE)
a<-table.element(a,hyperlink('lower_whisker.htm','lower whisker','definition of lower whisker'),1,TRUE)
a<-table.element(a,hyperlink('lower_hinge.htm','lower hinge','definition of lower hinge'),1,TRUE)
a<-table.element(a,hyperlink('central_tendency.htm','median','definitions about measures of central tendency'),1,TRUE)
a<-table.element(a,hyperlink('upper_hinge.htm','upper hinge','definition of upper hinge'),1,TRUE)
a<-table.element(a,hyperlink('upper_whisker.htm','upper whisker','definition of upper whisker'),1,TRUE)
a<-table.row.end(a)
for (i in 1:length(y[,1]))
{
a<-table.row.start(a)
a<-table.element(a,dimnames(t(x))[[2]][i],1,TRUE)
for (j in 1:5)
{
a<-table.element(a,r$stats[j,i])
}
a<-table.row.end(a)
}
a<-table.end(a)
table.save(a,file='mytable.tab')
a<-table.start()
a<-table.row.start(a)
a<-table.element(a,'Boxplot Notches',4,TRUE)
a<-table.row.end(a)
a<-table.row.start(a)
a<-table.element(a,'Variable',1,TRUE)
a<-table.element(a,'lower bound',1,TRUE)
a<-table.element(a,'median',1,TRUE)
a<-table.element(a,'upper bound',1,TRUE)
a<-table.row.end(a)
for (i in 1:length(y[,1]))
{
a<-table.row.start(a)
a<-table.element(a,dimnames(t(x))[[2]][i],1,TRUE)
a<-table.element(a,r$conf[1,i])
a<-table.element(a,r$stats[3,i])
a<-table.element(a,r$conf[2,i])
a<-table.row.end(a)
}
a<-table.end(a)
table.save(a,file='mytable1.tab')