Free Statistics

of Irreproducible Research!

Author's title

Author*Unverified author*
R Software Modulerwasp_pairs.wasp
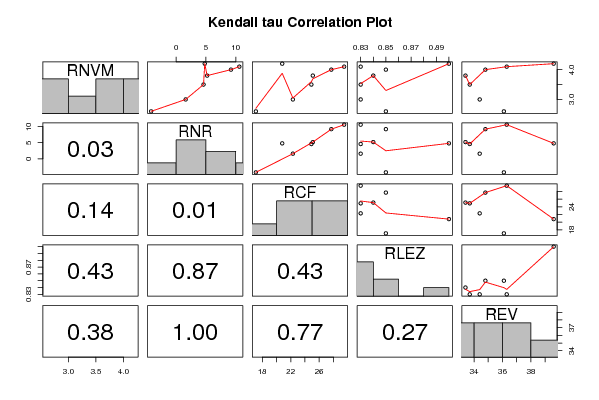
Title produced by softwareKendall tau Correlation Matrix
Date of computationWed, 05 Nov 2008 04:48:46 -0700
Cite this page as followsStatistical Computations at FreeStatistics.org, Office for Research Development and Education, URL https://freestatistics.org/blog/index.php?v=date/2008/Nov/05/t1225885810wsa7x0k7jrmiwy9.htm/, Retrieved Sun, 19 May 2024 12:35:56 +0000
Statistical Computations at FreeStatistics.org, Office for Research Development and Education, URL https://freestatistics.org/blog/index.php?pk=21702, Retrieved Sun, 19 May 2024 12:35:56 +0000
QR Codes:

Original text written by user:
IsPrivate?No (this computation is public)
User-defined keywords
Estimated Impact191
Family? (F = Feedback message, R = changed R code, M = changed R Module, P = changed Parameters, D = changed Data)
F     [Notched Boxplots] [workshop 3] [2007-10-26 13:31:48] [e9ffc5de6f8a7be62f22b142b5b6b1a8]
F RM D    [Kendall tau Correlation Matrix] [Toon Wouters] [2008-11-05 11:48:46] [129e79f7c2a947d1265718b3aa5cb7d5] [Current]
F R P       [Kendall tau Correlation Matrix] [Sören Van Donink] [2008-11-06 21:21:56] [a9600e6e89f40d71700b48f1f32cc480]
Feedback Forum
2008-11-12 10:17:58 [Ken Wright] [reply
correcte grafiek, maar conclusie is gedeeltelijk fout. De cijfers (p-value) in de matrix stellen de propabiliteit (stelt de toevaligheid voor: waarde betrouwbaar, geen toeval)voor en niet de correlatie. En de beste schatter is hier de cashflow RCF. De tau is de correlatie.
2008-11-12 10:41:45 [Stef Vermeiren] [reply
De kendall tau matrix geeft alle verbanden binnen een periode. Deze methode is veel robuuster en is minder onderhevig aan outliers.

De oplossing is wel niet gans correct omdat de p-value de probabiliteit weergeeft en niet de correlatiecoëfficiënt. Deze p-value moet onder de 0.05 liggen.
2008-11-12 11:01:11 [Jolien Van Landeghem] [reply
Dit is gedeeltelijk incorrect. De tau coëfficiënt geeft je correlatie weer. Deze ligt tussen -1 en 1. In dit geval is er significante correlatie (leunt naar 1). De p-waarde echter geeft de kans weer dat de gebeurtenis aan het toeval is toe te schrijven en bedraagt 1 % . Er werd gebruik gemaakt van deze matrix omdat deze niet gevoelig is voor outliers. De rcf heeft de laagste p-waarde en is kleiner dan 0.05 en is de beste predictor voor de rnr

Post a new message
Dataseries X:
4.2	4.8	20.8	0.9	39.6
2.6	-4.2	17.1	0.85	36.1
3	1.6	22.3	0.83	34.4
3.8	5.2	25.1	0.84	33.4
4	9.2	27.7	0.85	34.8
3.5	4.6	24.9	0.83	33.7
4.1	10.6	29.5	0.83	36.3


Summary of computational transaction
Raw Inputview raw input (R code)
Raw Outputview raw output of R engine
Computing time1 seconds
R Server'Gwilym Jenkins' @ 72.249.127.135
R Framework error message
The field 'Names of X columns' contains a hard return which cannot be interpreted.
Please, resubmit your request without hard returns in the 'Names of X columns'.

\begin{tabular}{lllllllll}
\hline
Summary of computational transaction \tabularnewline
Raw Input & view raw input (R code)  \tabularnewline
Raw Output & view raw output of R engine  \tabularnewline
Computing time & 1 seconds \tabularnewline
R Server & 'Gwilym Jenkins' @ 72.249.127.135 \tabularnewline
R Framework error message & 
The field 'Names of X columns' contains a hard return which cannot be interpreted.
Please, resubmit your request without hard returns in the 'Names of X columns'.
\tabularnewline \hline \end{tabular} %Source: https://freestatistics.org/blog/index.php?pk=21702&T=0

[TABLE]
[ROW][C]Summary of computational transaction[/C][/ROW]
[ROW][C]Raw Input[/C][C]view raw input (R code) [/C][/ROW]
[ROW][C]Raw Output[/C][C]view raw output of R engine [/C][/ROW]
[ROW][C]Computing time[/C][C]1 seconds[/C][/ROW]
[ROW][C]R Server[/C][C]'Gwilym Jenkins' @ 72.249.127.135[/C][/ROW]
[ROW][C]R Framework error message[/C][C]
The field 'Names of X columns' contains a hard return which cannot be interpreted.
Please, resubmit your request without hard returns in the 'Names of X columns'.
[/C][/ROW] [/TABLE] Source: https://freestatistics.org/blog/index.php?pk=21702&T=0

Globally Unique Identifier (entire table): ba.freestatistics.org/blog/index.php?pk=21702&T=0

As an alternative you can also use a QR Code:  

The GUIDs for individual cells are displayed in the table below:

Summary of computational transaction
Raw Inputview raw input (R code)
Raw Outputview raw output of R engine
Computing time1 seconds
R Server'Gwilym Jenkins' @ 72.249.127.135
R Framework error message
The field 'Names of X columns' contains a hard return which cannot be interpreted.
Please, resubmit your request without hard returns in the 'Names of X columns'.


Kendall tau rank correlations for all pairs of data series
pairtaup-value
tau( RNVM , RNR )0.7142857142857140.0301587301587301
tau( RNVM , RCF )0.5238095238095240.136111111111111
tau( RNVM , RLEZ )0.2646280620124820.427262856745706
tau( RNVM , REV )0.3333333333333330.381349206349206
tau( RNR , RCF )0.809523809523810.0107142857142857
tau( RNR , RLEZ )-0.05292561240249630.873844698517373
tau( RNR , REV )0.04761904761904761
tau( RCF , RLEZ )-0.2646280620124820.427262856745706
tau( RCF , REV )-0.1428571428571430.772619047619048
tau( RLEZ , REV )0.3704792868174740.266379923342483

\begin{tabular}{lllllllll}
\hline
Kendall tau rank correlations for all pairs of data series \tabularnewline
pair & tau & p-value \tabularnewline
tau( RNVM , RNR ) & 0.714285714285714 & 0.0301587301587301 \tabularnewline
tau( RNVM , RCF ) & 0.523809523809524 & 0.136111111111111 \tabularnewline
tau( RNVM , RLEZ ) & 0.264628062012482 & 0.427262856745706 \tabularnewline
tau( RNVM , REV
 ) & 0.333333333333333 & 0.381349206349206 \tabularnewline
tau( RNR , RCF ) & 0.80952380952381 & 0.0107142857142857 \tabularnewline
tau( RNR , RLEZ ) & -0.0529256124024963 & 0.873844698517373 \tabularnewline
tau( RNR , REV
 ) & 0.0476190476190476 & 1 \tabularnewline
tau( RCF , RLEZ ) & -0.264628062012482 & 0.427262856745706 \tabularnewline
tau( RCF , REV
 ) & -0.142857142857143 & 0.772619047619048 \tabularnewline
tau( RLEZ , REV
 ) & 0.370479286817474 & 0.266379923342483 \tabularnewline
\hline
\end{tabular}
%Source: https://freestatistics.org/blog/index.php?pk=21702&T=1

[TABLE]
[ROW][C]Kendall tau rank correlations for all pairs of data series[/C][/ROW]
[ROW][C]pair[/C][C]tau[/C][C]p-value[/C][/ROW]
[ROW][C]tau( RNVM , RNR )[/C][C]0.714285714285714[/C][C]0.0301587301587301[/C][/ROW]
[ROW][C]tau( RNVM , RCF )[/C][C]0.523809523809524[/C][C]0.136111111111111[/C][/ROW]
[ROW][C]tau( RNVM , RLEZ )[/C][C]0.264628062012482[/C][C]0.427262856745706[/C][/ROW]
[ROW][C]tau( RNVM , REV
 )[/C][C]0.333333333333333[/C][C]0.381349206349206[/C][/ROW]
[ROW][C]tau( RNR , RCF )[/C][C]0.80952380952381[/C][C]0.0107142857142857[/C][/ROW]
[ROW][C]tau( RNR , RLEZ )[/C][C]-0.0529256124024963[/C][C]0.873844698517373[/C][/ROW]
[ROW][C]tau( RNR , REV
 )[/C][C]0.0476190476190476[/C][C]1[/C][/ROW]
[ROW][C]tau( RCF , RLEZ )[/C][C]-0.264628062012482[/C][C]0.427262856745706[/C][/ROW]
[ROW][C]tau( RCF , REV
 )[/C][C]-0.142857142857143[/C][C]0.772619047619048[/C][/ROW]
[ROW][C]tau( RLEZ , REV
 )[/C][C]0.370479286817474[/C][C]0.266379923342483[/C][/ROW]
[/TABLE]
Source: https://freestatistics.org/blog/index.php?pk=21702&T=1

Globally Unique Identifier (entire table): ba.freestatistics.org/blog/index.php?pk=21702&T=1

As an alternative you can also use a QR Code:  

The GUIDs for individual cells are displayed in the table below:

Kendall tau rank correlations for all pairs of data series
pairtaup-value
tau( RNVM , RNR )0.7142857142857140.0301587301587301
tau( RNVM , RCF )0.5238095238095240.136111111111111
tau( RNVM , RLEZ )0.2646280620124820.427262856745706
tau( RNVM , REV )0.3333333333333330.381349206349206
tau( RNR , RCF )0.809523809523810.0107142857142857
tau( RNR , RLEZ )-0.05292561240249630.873844698517373
tau( RNR , REV )0.04761904761904761
tau( RCF , RLEZ )-0.2646280620124820.427262856745706
tau( RCF , REV )-0.1428571428571430.772619047619048
tau( RLEZ , REV )0.3704792868174740.266379923342483


Parameters (Session):
par1 = grey ;
Parameters (R input):
R code (references can be found in the software module):
panel.tau <- function(x, y, digits=2, prefix='', cex.cor)
{
usr <- par('usr'); on.exit(par(usr))
par(usr = c(0, 1, 0, 1))
rr <- cor.test(x, y, method='kendall')
r <- round(rr$p.value,2)
txt <- format(c(r, 0.123456789), digits=digits)[1]
txt <- paste(prefix, txt, sep='')
if(missing(cex.cor)) cex <- 0.5/strwidth(txt)
text(0.5, 0.5, txt, cex = cex)
}
panel.hist <- function(x, ...)
{
usr <- par('usr'); on.exit(par(usr))
par(usr = c(usr[1:2], 0, 1.5) )
h <- hist(x, plot = FALSE)
breaks <- h$breaks; nB <- length(breaks)
y <- h$counts; y <- y/max(y)
rect(breaks[-nB], 0, breaks[-1], y, col='grey', ...)
}
bitmap(file='test1.png')
pairs(t(y),diag.panel=panel.hist, upper.panel=panel.smooth, lower.panel=panel.tau, main=main)
dev.off()
load(file='createtable')
a<-table.start()
a<-table.row.start(a)
a<-table.element(a,'Kendall tau rank correlations for all pairs of data series',3,TRUE)
a<-table.row.end(a)
a<-table.row.start(a)
a<-table.element(a,'pair',1,TRUE)
a<-table.element(a,'tau',1,TRUE)
a<-table.element(a,'p-value',1,TRUE)
a<-table.row.end(a)
n <- length(y[,1])
n
cor.test(y[1,],y[2,],method='kendall')
for (i in 1:(n-1))
{
for (j in (i+1):n)
{
a<-table.row.start(a)
dum <- paste('tau(',dimnames(t(x))[[2]][i])
dum <- paste(dum,',')
dum <- paste(dum,dimnames(t(x))[[2]][j])
dum <- paste(dum,')')
a<-table.element(a,dum,header=TRUE)
r <- cor.test(y[i,],y[j,],method='kendall')
a<-table.element(a,r$estimate)
a<-table.element(a,r$p.value)
a<-table.row.end(a)
}
}
a<-table.end(a)
table.save(a,file='mytable.tab')