Free Statistics

of Irreproducible Research!

Author's title

Author*Unverified author*
R Software Modulerwasp_bootstrapplot.wasp
Title produced by softwareBlocked Bootstrap Plot - Central Tendency
Date of computationWed, 05 Nov 2008 03:32:01 -0700
Cite this page as followsStatistical Computations at FreeStatistics.org, Office for Research Development and Education, URL https://freestatistics.org/blog/index.php?v=date/2008/Nov/05/t12258812272ffvz53mg4kbzw4.htm/, Retrieved Sun, 19 May 2024 10:48:03 +0000
Statistical Computations at FreeStatistics.org, Office for Research Development and Education, URL https://freestatistics.org/blog/index.php?pk=21670, Retrieved Sun, 19 May 2024 10:48:03 +0000
QR Codes:

Original text written by user:
IsPrivate?No (this computation is public)
User-defined keywordsjenske_cole@hotmail.com
Estimated Impact208
Family? (F = Feedback message, R = changed R code, M = changed R Module, P = changed Parameters, D = changed Data)
F     [Blocked Bootstrap Plot - Central Tendency] [workshop 3] [2007-10-26 12:36:24] [e9ffc5de6f8a7be62f22b142b5b6b1a8]
F    D    [Blocked Bootstrap Plot - Central Tendency] [opdracht1 q4] [2008-11-05 10:32:01] [d41d8cd98f00b204e9800998ecf8427e] [Current]
-    D      [Blocked Bootstrap Plot - Central Tendency] [paper bootstrap] [2008-12-13 11:49:55] [975daa21de49eaf4d491226310243f5a]
Feedback Forum
2008-11-09 16:03:18 [Steven Vercammen] [reply
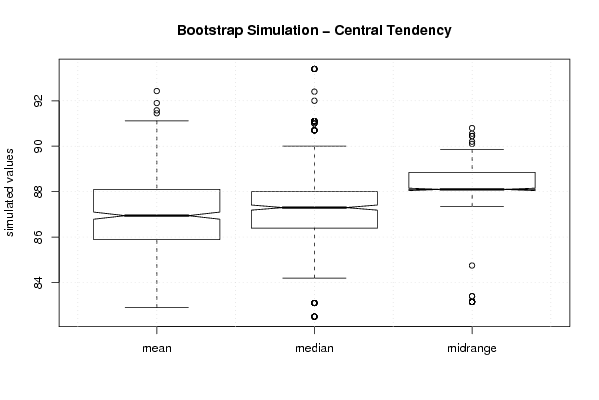
Q4: Het gemiddelde is inderdaad de beste maatstaf, maar de verklaring hiervoor klopt niet helemaal. Het is namelijk zo dat: hoe kleiner de spreiding hoe nauwkeuriger de maatstaf. Outliers vergroten het risico op een fout. De studente wisselde deze verklaringen om. Het gemiddelde heeft een grotere spreiding dan de mid-range maar heeft veel minder outliers en wordt daarom het meest gebruikt.
2008-11-10 09:51:12 [Annelies Lauwen] [reply
Theorie: To generate a bootstrap uncertainty estimate for a given statistic from a set of data, a subsample of a size less than or equal to the size of the data set is generated from the data, and the statistic is calculated. This subsample is generated with replacement so that any data point can be sampled multiple times or not sampled at all. This process is repeated for many subsamples, typically between 500 and 1000. The computed values for the statistic form an estimate of the sampling distribution of the statistic.
eventuele uitleg:
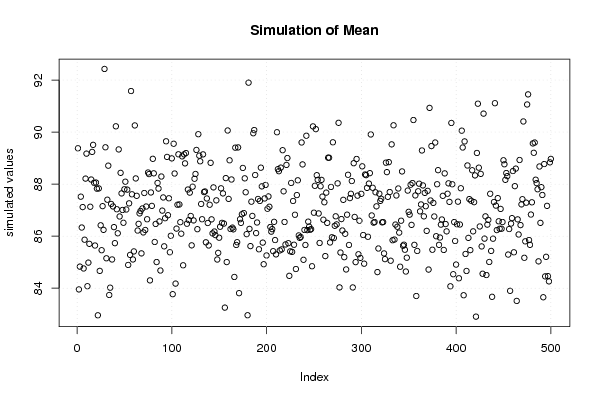
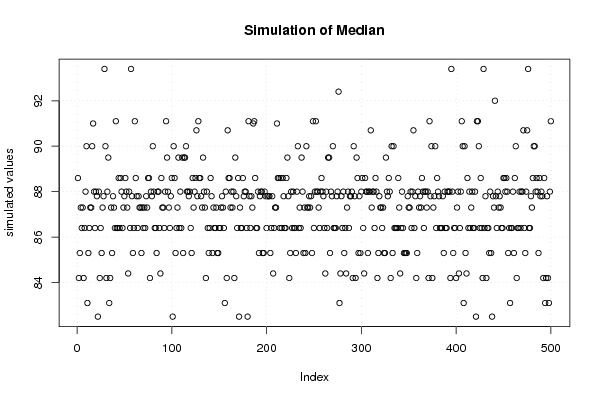
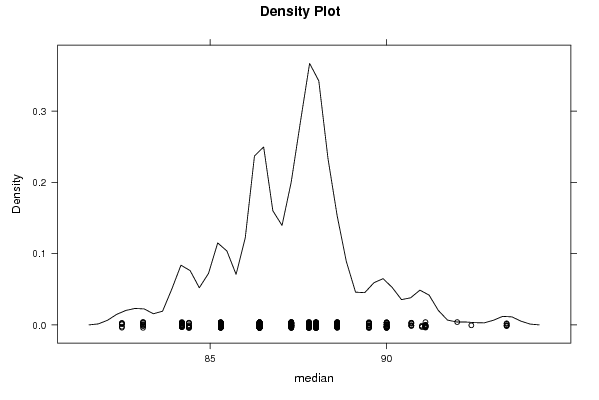
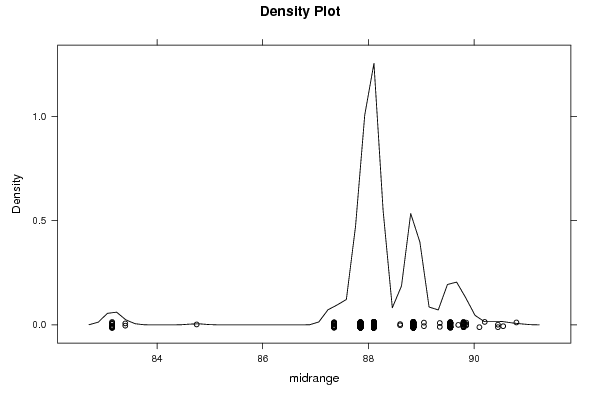
Het gemiddelde is random verdeeld, d.w.z. dat deze leidt tot de normaalverdeling(zie density plot). De mediaan en de midrange vertonen beiden een patroon wat niet leidt tot de normaalverdeling. Bij de bootstrap simulation zijn de box plots niet tot stand gekomen door de dataset, maar dit zijn de verschillende gemiddeldes(gemiddelde, mediaan en midrange) die uitgezet zijn.
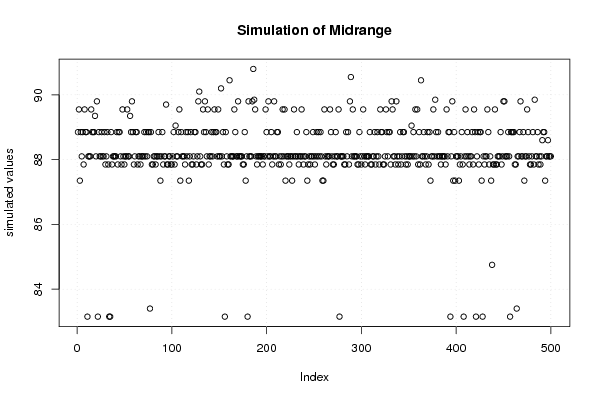
conclusie:de midrange is de beste schatter voor de benadering i.v.m. de geschatte waarde voor de kledingproductie. Dit kunnen we besluitend doordat de midrange de kleinste spreiding vertoont en ons dus de grootste zekerheid geeft. Het nadeel van de midrange is dat het aantal outliers, en het effect van externe observaties, groter is. In sommige gevallen zullen we dus een afweging moeten maken, wanneer blijkt dat de outliers een te groot effect zullen hebben.
2008-11-10 11:04:31 [Jenske Cole] [reply
We zouden ook kunnen gaan kijken naar de klokcurve of simulation of ... en kijken of je een bepaald patroon ziet. Bij de bootstrap zou ik redeneren als de outlier een fatale fout kan teweeg brengen, dan zou ik opteren voor het gemiddelde als beste maatstaf, ook al is de spreiding hierbij groter.

Post a new message
Dataseries X:
109.20
88.60
94.30
98.30
86.40
80.60
104.10
108.20
93.40
71.90
94.10
94.90
96.40
91.10
84.40
86.40
88.00
75.10
109.70
103.00
82.10
68.00
96.40
94.30
90.00
88.00
76.10
82.50
81.40
66.50
97.20
94.10
80.70
70.50
87.80
89.50
99.60
84.20
75.10
92.00
80.80
73.10
99.80
90.00
83.10
72.40
78.80
87.30
91.00
80.10
73.60
86.40
74.50
71.20
92.40
81.50
85.30
69.90
84.20
90.70
100.30


Summary of computational transaction
Raw Inputview raw input (R code)
Raw Outputview raw output of R engine
Computing time5 seconds
R Server'Gwilym Jenkins' @ 72.249.127.135

\begin{tabular}{lllllllll}
\hline
Summary of computational transaction \tabularnewline
Raw Input & view raw input (R code)  \tabularnewline
Raw Output & view raw output of R engine  \tabularnewline
Computing time & 5 seconds \tabularnewline
R Server & 'Gwilym Jenkins' @ 72.249.127.135 \tabularnewline
\hline
\end{tabular}
%Source: https://freestatistics.org/blog/index.php?pk=21670&T=0

[TABLE]
[ROW][C]Summary of computational transaction[/C][/ROW]
[ROW][C]Raw Input[/C][C]view raw input (R code) [/C][/ROW]
[ROW][C]Raw Output[/C][C]view raw output of R engine [/C][/ROW]
[ROW][C]Computing time[/C][C]5 seconds[/C][/ROW]
[ROW][C]R Server[/C][C]'Gwilym Jenkins' @ 72.249.127.135[/C][/ROW]
[/TABLE]
Source: https://freestatistics.org/blog/index.php?pk=21670&T=0

Globally Unique Identifier (entire table): ba.freestatistics.org/blog/index.php?pk=21670&T=0

As an alternative you can also use a QR Code:  

The GUIDs for individual cells are displayed in the table below:

Summary of computational transaction
Raw Inputview raw input (R code)
Raw Outputview raw output of R engine
Computing time5 seconds
R Server'Gwilym Jenkins' @ 72.249.127.135


Estimation Results of Blocked Bootstrap
statisticQ1EstimateQ3S.D.IQR
mean85.895081967213186.893442622950888.11.642938628224652.20491803278688
median86.487.3881.87092235566361.59999999999999
midrange88.188.188.851.078090812315550.75

\begin{tabular}{lllllllll}
\hline
Estimation Results of Blocked Bootstrap \tabularnewline
statistic & Q1 & Estimate & Q3 & S.D. & IQR \tabularnewline
mean & 85.8950819672131 & 86.8934426229508 & 88.1 & 1.64293862822465 & 2.20491803278688 \tabularnewline
median & 86.4 & 87.3 & 88 & 1.8709223556636 & 1.59999999999999 \tabularnewline
midrange & 88.1 & 88.1 & 88.85 & 1.07809081231555 & 0.75 \tabularnewline
\hline
\end{tabular}
%Source: https://freestatistics.org/blog/index.php?pk=21670&T=1

[TABLE]
[ROW][C]Estimation Results of Blocked Bootstrap[/C][/ROW]
[ROW][C]statistic[/C][C]Q1[/C][C]Estimate[/C][C]Q3[/C][C]S.D.[/C][C]IQR[/C][/ROW]
[ROW][C]mean[/C][C]85.8950819672131[/C][C]86.8934426229508[/C][C]88.1[/C][C]1.64293862822465[/C][C]2.20491803278688[/C][/ROW]
[ROW][C]median[/C][C]86.4[/C][C]87.3[/C][C]88[/C][C]1.8709223556636[/C][C]1.59999999999999[/C][/ROW]
[ROW][C]midrange[/C][C]88.1[/C][C]88.1[/C][C]88.85[/C][C]1.07809081231555[/C][C]0.75[/C][/ROW]
[/TABLE]
Source: https://freestatistics.org/blog/index.php?pk=21670&T=1

Globally Unique Identifier (entire table): ba.freestatistics.org/blog/index.php?pk=21670&T=1

As an alternative you can also use a QR Code:  

The GUIDs for individual cells are displayed in the table below:

Estimation Results of Blocked Bootstrap
statisticQ1EstimateQ3S.D.IQR
mean85.895081967213186.893442622950888.11.642938628224652.20491803278688
median86.487.3881.87092235566361.59999999999999
midrange88.188.188.851.078090812315550.75


Parameters (Session):
par1 = 500 ; par2 = 12 ;
Parameters (R input):
par1 = 500 ; par2 = 12 ;
R code (references can be found in the software module):
par1 <- as.numeric(par1)
par2 <- as.numeric(par2)
if (par1 < 10) par1 = 10
if (par1 > 5000) par1 = 5000
if (par2 < 3) par2 = 3
if (par2 > length(x)) par2 = length(x)
library(lattice)
library(boot)
boot.stat <- function(s)
{
s.mean <- mean(s)
s.median <- median(s)
s.midrange <- (max(s) + min(s)) / 2
c(s.mean, s.median, s.midrange)
}
(r <- tsboot(x, boot.stat, R=par1, l=12, sim='fixed'))
bitmap(file='plot1.png')
plot(r$t[,1],type='p',ylab='simulated values',main='Simulation of Mean')
grid()
dev.off()
bitmap(file='plot2.png')
plot(r$t[,2],type='p',ylab='simulated values',main='Simulation of Median')
grid()
dev.off()
bitmap(file='plot3.png')
plot(r$t[,3],type='p',ylab='simulated values',main='Simulation of Midrange')
grid()
dev.off()
bitmap(file='plot4.png')
densityplot(~r$t[,1],col='black',main='Density Plot',xlab='mean')
dev.off()
bitmap(file='plot5.png')
densityplot(~r$t[,2],col='black',main='Density Plot',xlab='median')
dev.off()
bitmap(file='plot6.png')
densityplot(~r$t[,3],col='black',main='Density Plot',xlab='midrange')
dev.off()
z <- data.frame(cbind(r$t[,1],r$t[,2],r$t[,3]))
colnames(z) <- list('mean','median','midrange')
bitmap(file='plot7.png')
boxplot(z,notch=TRUE,ylab='simulated values',main='Bootstrap Simulation - Central Tendency')
grid()
dev.off()
load(file='createtable')
a<-table.start()
a<-table.row.start(a)
a<-table.element(a,'Estimation Results of Blocked Bootstrap',6,TRUE)
a<-table.row.end(a)
a<-table.row.start(a)
a<-table.element(a,'statistic',header=TRUE)
a<-table.element(a,'Q1',header=TRUE)
a<-table.element(a,'Estimate',header=TRUE)
a<-table.element(a,'Q3',header=TRUE)
a<-table.element(a,'S.D.',header=TRUE)
a<-table.element(a,'IQR',header=TRUE)
a<-table.row.end(a)
a<-table.row.start(a)
a<-table.element(a,'mean',header=TRUE)
q1 <- quantile(r$t[,1],0.25)[[1]]
q3 <- quantile(r$t[,1],0.75)[[1]]
a<-table.element(a,q1)
a<-table.element(a,r$t0[1])
a<-table.element(a,q3)
a<-table.element(a,sqrt(var(r$t[,1])))
a<-table.element(a,q3-q1)
a<-table.row.end(a)
a<-table.row.start(a)
a<-table.element(a,'median',header=TRUE)
q1 <- quantile(r$t[,2],0.25)[[1]]
q3 <- quantile(r$t[,2],0.75)[[1]]
a<-table.element(a,q1)
a<-table.element(a,r$t0[2])
a<-table.element(a,q3)
a<-table.element(a,sqrt(var(r$t[,2])))
a<-table.element(a,q3-q1)
a<-table.row.end(a)
a<-table.row.start(a)
a<-table.element(a,'midrange',header=TRUE)
q1 <- quantile(r$t[,3],0.25)[[1]]
q3 <- quantile(r$t[,3],0.75)[[1]]
a<-table.element(a,q1)
a<-table.element(a,r$t0[3])
a<-table.element(a,q3)
a<-table.element(a,sqrt(var(r$t[,3])))
a<-table.element(a,q3-q1)
a<-table.row.end(a)
a<-table.end(a)
table.save(a,file='mytable.tab')