Free Statistics
of Irreproducible Research!
Description of Statistical Computation | |||||||||||||||||||||||||||||||||||||||||||||||||||||||||||||||||||||||||||||||||||||||||||||||||||||||||||||||||||||||||||||||||||||||||||||
|---|---|---|---|---|---|---|---|---|---|---|---|---|---|---|---|---|---|---|---|---|---|---|---|---|---|---|---|---|---|---|---|---|---|---|---|---|---|---|---|---|---|---|---|---|---|---|---|---|---|---|---|---|---|---|---|---|---|---|---|---|---|---|---|---|---|---|---|---|---|---|---|---|---|---|---|---|---|---|---|---|---|---|---|---|---|---|---|---|---|---|---|---|---|---|---|---|---|---|---|---|---|---|---|---|---|---|---|---|---|---|---|---|---|---|---|---|---|---|---|---|---|---|---|---|---|---|---|---|---|---|---|---|---|---|---|---|---|---|---|---|---|
| Author's title | |||||||||||||||||||||||||||||||||||||||||||||||||||||||||||||||||||||||||||||||||||||||||||||||||||||||||||||||||||||||||||||||||||||||||||||
| Author | *The author of this computation has been verified* | ||||||||||||||||||||||||||||||||||||||||||||||||||||||||||||||||||||||||||||||||||||||||||||||||||||||||||||||||||||||||||||||||||||||||||||
| R Software Module | rwasp_notchedbox1.wasp | ||||||||||||||||||||||||||||||||||||||||||||||||||||||||||||||||||||||||||||||||||||||||||||||||||||||||||||||||||||||||||||||||||||||||||||
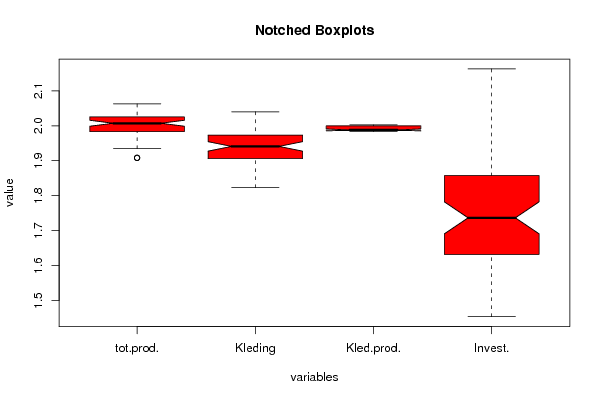
| Title produced by software | Notched Boxplots | ||||||||||||||||||||||||||||||||||||||||||||||||||||||||||||||||||||||||||||||||||||||||||||||||||||||||||||||||||||||||||||||||||||||||||||
| Date of computation | Tue, 04 Nov 2008 06:08:35 -0700 | ||||||||||||||||||||||||||||||||||||||||||||||||||||||||||||||||||||||||||||||||||||||||||||||||||||||||||||||||||||||||||||||||||||||||||||
| Cite this page as follows | Statistical Computations at FreeStatistics.org, Office for Research Development and Education, URL https://freestatistics.org/blog/index.php?v=date/2008/Nov/04/t1225804313wf38rj8e1514806.htm/, Retrieved Sun, 19 May 2024 05:56:30 +0000 | ||||||||||||||||||||||||||||||||||||||||||||||||||||||||||||||||||||||||||||||||||||||||||||||||||||||||||||||||||||||||||||||||||||||||||||
| Statistical Computations at FreeStatistics.org, Office for Research Development and Education, URL https://freestatistics.org/blog/index.php?pk=21530, Retrieved Sun, 19 May 2024 05:56:30 +0000 | |||||||||||||||||||||||||||||||||||||||||||||||||||||||||||||||||||||||||||||||||||||||||||||||||||||||||||||||||||||||||||||||||||||||||||||
| QR Codes: | |||||||||||||||||||||||||||||||||||||||||||||||||||||||||||||||||||||||||||||||||||||||||||||||||||||||||||||||||||||||||||||||||||||||||||||
|
| |||||||||||||||||||||||||||||||||||||||||||||||||||||||||||||||||||||||||||||||||||||||||||||||||||||||||||||||||||||||||||||||||||||||||||||
| Original text written by user: | |||||||||||||||||||||||||||||||||||||||||||||||||||||||||||||||||||||||||||||||||||||||||||||||||||||||||||||||||||||||||||||||||||||||||||||
| IsPrivate? | No (this computation is public) | ||||||||||||||||||||||||||||||||||||||||||||||||||||||||||||||||||||||||||||||||||||||||||||||||||||||||||||||||||||||||||||||||||||||||||||
| User-defined keywords | |||||||||||||||||||||||||||||||||||||||||||||||||||||||||||||||||||||||||||||||||||||||||||||||||||||||||||||||||||||||||||||||||||||||||||||
| Estimated Impact | 154 | ||||||||||||||||||||||||||||||||||||||||||||||||||||||||||||||||||||||||||||||||||||||||||||||||||||||||||||||||||||||||||||||||||||||||||||
Tree of Dependent Computations | |||||||||||||||||||||||||||||||||||||||||||||||||||||||||||||||||||||||||||||||||||||||||||||||||||||||||||||||||||||||||||||||||||||||||||||
| Family? (F = Feedback message, R = changed R code, M = changed R Module, P = changed Parameters, D = changed Data) | |||||||||||||||||||||||||||||||||||||||||||||||||||||||||||||||||||||||||||||||||||||||||||||||||||||||||||||||||||||||||||||||||||||||||||||
| - [Notched Boxplots] [task 2 : notched ...] [2008-11-04 13:08:35] [09074fbe368d26382bb94e5bb318a104] [Current] - D [Notched Boxplots] [Task 2:notched bo...] [2008-11-04 13:26:39] [a4602103a5e123497aa555277d0e627b] | |||||||||||||||||||||||||||||||||||||||||||||||||||||||||||||||||||||||||||||||||||||||||||||||||||||||||||||||||||||||||||||||||||||||||||||
| Feedback Forum | |||||||||||||||||||||||||||||||||||||||||||||||||||||||||||||||||||||||||||||||||||||||||||||||||||||||||||||||||||||||||||||||||||||||||||||
Post a new message | |||||||||||||||||||||||||||||||||||||||||||||||||||||||||||||||||||||||||||||||||||||||||||||||||||||||||||||||||||||||||||||||||||||||||||||
Dataset | |||||||||||||||||||||||||||||||||||||||||||||||||||||||||||||||||||||||||||||||||||||||||||||||||||||||||||||||||||||||||||||||||||||||||||||
| Dataseries X: | |||||||||||||||||||||||||||||||||||||||||||||||||||||||||||||||||||||||||||||||||||||||||||||||||||||||||||||||||||||||||||||||||||||||||||||
2.042969073 2.038222638 1.999565488 1.860338007 1.984077034 1.947433722 1.999130541 1.773786445 2.008174184 1.974511693 1.999130541 1.932980822 2.026124517 1.992553518 2.001300933 1.945468585 1.908485019 1.936513742 1.999565488 1.797959644 1.976349979 1.906335042 1.999565488 1.939519253 2.004321374 2.01745073 2 1.898725182 2.039017322 2.034227261 2.000434077 2.049218023 2.009875634 1.970346876 2.000434077 1.898725182 1.957607287 1.85672889 2.000867722 2.120902818 1.983175072 1.973589623 2.001300933 1.603144373 1.982723388 1.977266212 2.002597981 1.838849091 2.025305865 1.984077034 2 1.773786445 2.013258665 1.959518377 2.000434077 1.868056362 2.008600172 1.926342447 2.000867722 1.758911892 2.019946682 1.936513742 2 1.909020854 1.934498451 1.944482672 2.000434077 1.668385917 1.96425963 1.875639937 2.000434077 1.617000341 2.028977705 2.040206628 2.000434077 1.852479994 2.051538391 2.012837225 2.002166062 1.831869774 2.007320953 1.914343157 2.002166062 1.857332496 1.963787827 1.832508913 2.002166062 2.162862993 1.988558957 1.984077034 1.983626287 1.598790507 1.986771734 1.974511693 1.983626287 1.715167358 2.022840611 1.954242509 1.985875357 1.867467488 2.011570444 1.944482672 1.985875357 1.850646235 1.991669007 1.881384657 1.986323777 1.783903579 2.01911629 1.916453949 1.985875357 1.785329835 1.941511433 1.910624405 1.985875357 1.736396502 1.953759692 1.822821645 1.985875357 1.592176757 2.04060234 1.987666265 1.985875357 1.823474229 2.048053173 1.973589623 1.986771734 1.767155866 1.993876915 1.906873535 1.986771734 1.776701184 1.986323777 1.848189117 1.986771734 1.907948522 1.978180517 1.943494516 1.985875357 1.571708832 1.986771734 1.951823035 1.986323777 1.649334859 2.051923916 1.998259338 1.987666265 1.687528961 2.012415375 1.925312091 1.98811284 1.73239376 1.988558957 1.875639937 1.98811284 1.694605199 2.046885191 1.963787827 1.987666265 1.789580712 1.941511433 1.907411361 1.98811284 1.544068044 1.985875357 1.863917377 1.98811284 1.552668216 2.057285644 1.999130541 1.98811284 1.710117365 2.042575512 1.954242509 1.98811284 1.69019608 2.016615548 1.919601024 1.98811284 1.618048097 2.006893708 1.859738566 1.98811284 1.860338007 1.975891136 1.896526217 1.991669007 1.624282096 1.981818607 1.941014244 1.985875357 1.644438589 2.019946682 1.959041392 1.985875357 1.654176542 2.011993115 1.903632516 1.985875357 1.701567985 1.991669007 1.866877814 1.985875357 1.611723308 2.056523724 1.936513742 1.985875357 1.673941999 1.907948522 1.872156273 1.985875357 1.567026366 1.980911938 1.852479994 1.985875357 1.611723308 2.053846427 1.965671971 1.985875357 1.583198774 2.02489596 1.911157609 1.985875357 1.665580991 2.036628895 1.930949031 1.985875357 1.45331834 2.009875634 1.844477176 1.985875357 1.894316063 1.995635195 1.925312091 1.986323777 1.565847819 2.003029471 1.957607287 1.98721923 1.705007959 2.062581984 2.001300933 1.98721923 1.631443769 | |||||||||||||||||||||||||||||||||||||||||||||||||||||||||||||||||||||||||||||||||||||||||||||||||||||||||||||||||||||||||||||||||||||||||||||
Tables (Output of Computation) | |||||||||||||||||||||||||||||||||||||||||||||||||||||||||||||||||||||||||||||||||||||||||||||||||||||||||||||||||||||||||||||||||||||||||||||
| |||||||||||||||||||||||||||||||||||||||||||||||||||||||||||||||||||||||||||||||||||||||||||||||||||||||||||||||||||||||||||||||||||||||||||||
Figures (Output of Computation) | |||||||||||||||||||||||||||||||||||||||||||||||||||||||||||||||||||||||||||||||||||||||||||||||||||||||||||||||||||||||||||||||||||||||||||||
Input Parameters & R Code | |||||||||||||||||||||||||||||||||||||||||||||||||||||||||||||||||||||||||||||||||||||||||||||||||||||||||||||||||||||||||||||||||||||||||||||
| Parameters (Session): | |||||||||||||||||||||||||||||||||||||||||||||||||||||||||||||||||||||||||||||||||||||||||||||||||||||||||||||||||||||||||||||||||||||||||||||
| par1 = red ; | |||||||||||||||||||||||||||||||||||||||||||||||||||||||||||||||||||||||||||||||||||||||||||||||||||||||||||||||||||||||||||||||||||||||||||||
| Parameters (R input): | |||||||||||||||||||||||||||||||||||||||||||||||||||||||||||||||||||||||||||||||||||||||||||||||||||||||||||||||||||||||||||||||||||||||||||||
| par1 = red ; | |||||||||||||||||||||||||||||||||||||||||||||||||||||||||||||||||||||||||||||||||||||||||||||||||||||||||||||||||||||||||||||||||||||||||||||
| R code (references can be found in the software module): | |||||||||||||||||||||||||||||||||||||||||||||||||||||||||||||||||||||||||||||||||||||||||||||||||||||||||||||||||||||||||||||||||||||||||||||
z <- as.data.frame(t(y)) | |||||||||||||||||||||||||||||||||||||||||||||||||||||||||||||||||||||||||||||||||||||||||||||||||||||||||||||||||||||||||||||||||||||||||||||