Free Statistics

of Irreproducible Research!

Author's title

Author*The author of this computation has been verified*
R Software Modulerwasp_pairs.wasp
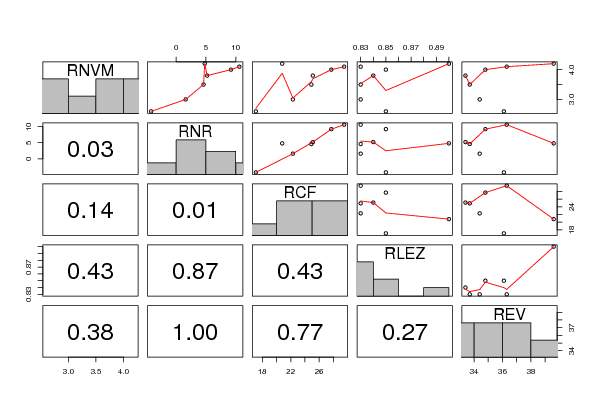
Title produced by softwareKendall tau Correlation Matrix
Date of computationMon, 03 Nov 2008 15:19:28 -0700
Cite this page as followsStatistical Computations at FreeStatistics.org, Office for Research Development and Education, URL https://freestatistics.org/blog/index.php?v=date/2008/Nov/03/t1225750825khl5sxqa1j6f1hi.htm/, Retrieved Sun, 19 May 2024 12:41:18 +0000
Statistical Computations at FreeStatistics.org, Office for Research Development and Education, URL https://freestatistics.org/blog/index.php?pk=21356, Retrieved Sun, 19 May 2024 12:41:18 +0000
QR Codes:

Original text written by user:
IsPrivate?No (this computation is public)
User-defined keywords
Estimated Impact177
Family? (F = Feedback message, R = changed R code, M = changed R Module, P = changed Parameters, D = changed Data)
F     [Kendall tau Correlation Matrix] [Kendall Tau] [2008-10-31 11:23:33] [1ce0d16c8f4225c977b42c8fa93bc163]
F         [Kendall tau Correlation Matrix] [Q1] [2008-11-03 22:19:28] [d96f761aa3e94002e7c05c3c847d2c79] [Current]
Feedback Forum
2008-11-10 10:36:50 [Kim Wester] [reply
De beste predictor voor RNR is RNVM of RCF. Dit is de zien aan de p-waarde.

0,03 voor RNR en RNVM.
0,01 voor NRN en RCF.

Deze p-waarde is geen correlatie coëfficiënt maar weergeeft de betrouwbaarheid. Bij een p-waarde lager dan 0,05 is er sprake van goede correlatie (maar geen aantal!).
2008-11-10 13:16:00 [339a57d8a4d5d113e4804fc423e4a59e] [reply
De student heeft voor de berekening de Kendall Tau-software gebruikt. Bij de Kendall Tau krijgt de data een rangorde, outliers worden hierdoor opgenomen in de rangorde, waardoor men een veel robuuster resultaat krijgt. De getallen die men krijgt zijn geen correlatiecoëfficienten, maar betrouwbaarheidspercentages. Men kan uit de tabel afleiden dat er een mooie correlatie is tussen RNR & RCF (0,01) en ook tussen RNVM & RCF (0,03).
2008-12-01 18:11:53 [0762c65deec3d397cd9f26b3749a0847] [reply
De student maakt de juiste berekening door via Kendall Tau te werken. HIj/zij maakt echter een verkeerde analyse van de matrix. De getallen die je in de tabel kan aflezen zijn namelijk geen correlatiecoëfficienten, maar betrouwbaarheidspercentages. De beste correlatie is er tussen RNR & RCF (waar het het kleinst is) Correlatie gegevens worden afgelezen in de bijhorende tabel.

Post a new message
Dataseries X:
4,2	4,8	20,8	0,9	39,6
2,6	-4,2	17,1	0,85	36,1
3	1,6	22,3	0,83	34,4
3,8	5,2	25,1	0,84	33,4
4	9,2	27,7	0,85	34,8
3,5	4,6	24,9	0,83	33,7
4,1	10,6	29,5	0,83	36,3


Summary of computational transaction
Raw Inputview raw input (R code)
Raw Outputview raw output of R engine
Computing time2 seconds
R Server'George Udny Yule' @ 72.249.76.132

\begin{tabular}{lllllllll}
\hline
Summary of computational transaction \tabularnewline
Raw Input & view raw input (R code)  \tabularnewline
Raw Output & view raw output of R engine  \tabularnewline
Computing time & 2 seconds \tabularnewline
R Server & 'George Udny Yule' @ 72.249.76.132 \tabularnewline
\hline
\end{tabular}
%Source: https://freestatistics.org/blog/index.php?pk=21356&T=0

[TABLE]
[ROW][C]Summary of computational transaction[/C][/ROW]
[ROW][C]Raw Input[/C][C]view raw input (R code) [/C][/ROW]
[ROW][C]Raw Output[/C][C]view raw output of R engine [/C][/ROW]
[ROW][C]Computing time[/C][C]2 seconds[/C][/ROW]
[ROW][C]R Server[/C][C]'George Udny Yule' @ 72.249.76.132[/C][/ROW]
[/TABLE]
Source: https://freestatistics.org/blog/index.php?pk=21356&T=0

Globally Unique Identifier (entire table): ba.freestatistics.org/blog/index.php?pk=21356&T=0

As an alternative you can also use a QR Code:  

The GUIDs for individual cells are displayed in the table below:

Summary of computational transaction
Raw Inputview raw input (R code)
Raw Outputview raw output of R engine
Computing time2 seconds
R Server'George Udny Yule' @ 72.249.76.132


Kendall tau rank correlations for all pairs of data series
pairtaup-value
tau( RNVM , RNR )0.7142857142857140.0301587301587301
tau( RNVM , RCF )0.5238095238095240.136111111111111
tau( RNVM , RLEZ )0.2646280620124820.427262856745706
tau( RNVM , REV )0.3333333333333330.381349206349206
tau( RNR , RCF )0.809523809523810.0107142857142857
tau( RNR , RLEZ )-0.05292561240249630.873844698517373
tau( RNR , REV )0.04761904761904761
tau( RCF , RLEZ )-0.2646280620124820.427262856745706
tau( RCF , REV )-0.1428571428571430.772619047619048
tau( RLEZ , REV )0.3704792868174740.266379923342483

\begin{tabular}{lllllllll}
\hline
Kendall tau rank correlations for all pairs of data series \tabularnewline
pair & tau & p-value \tabularnewline
tau( RNVM , RNR ) & 0.714285714285714 & 0.0301587301587301 \tabularnewline
tau( RNVM , RCF ) & 0.523809523809524 & 0.136111111111111 \tabularnewline
tau( RNVM , RLEZ ) & 0.264628062012482 & 0.427262856745706 \tabularnewline
tau( RNVM , REV ) & 0.333333333333333 & 0.381349206349206 \tabularnewline
tau( RNR , RCF ) & 0.80952380952381 & 0.0107142857142857 \tabularnewline
tau( RNR , RLEZ ) & -0.0529256124024963 & 0.873844698517373 \tabularnewline
tau( RNR , REV ) & 0.0476190476190476 & 1 \tabularnewline
tau( RCF , RLEZ ) & -0.264628062012482 & 0.427262856745706 \tabularnewline
tau( RCF , REV ) & -0.142857142857143 & 0.772619047619048 \tabularnewline
tau( RLEZ , REV ) & 0.370479286817474 & 0.266379923342483 \tabularnewline
\hline
\end{tabular}
%Source: https://freestatistics.org/blog/index.php?pk=21356&T=1

[TABLE]
[ROW][C]Kendall tau rank correlations for all pairs of data series[/C][/ROW]
[ROW][C]pair[/C][C]tau[/C][C]p-value[/C][/ROW]
[ROW][C]tau( RNVM , RNR )[/C][C]0.714285714285714[/C][C]0.0301587301587301[/C][/ROW]
[ROW][C]tau( RNVM , RCF )[/C][C]0.523809523809524[/C][C]0.136111111111111[/C][/ROW]
[ROW][C]tau( RNVM , RLEZ )[/C][C]0.264628062012482[/C][C]0.427262856745706[/C][/ROW]
[ROW][C]tau( RNVM , REV )[/C][C]0.333333333333333[/C][C]0.381349206349206[/C][/ROW]
[ROW][C]tau( RNR , RCF )[/C][C]0.80952380952381[/C][C]0.0107142857142857[/C][/ROW]
[ROW][C]tau( RNR , RLEZ )[/C][C]-0.0529256124024963[/C][C]0.873844698517373[/C][/ROW]
[ROW][C]tau( RNR , REV )[/C][C]0.0476190476190476[/C][C]1[/C][/ROW]
[ROW][C]tau( RCF , RLEZ )[/C][C]-0.264628062012482[/C][C]0.427262856745706[/C][/ROW]
[ROW][C]tau( RCF , REV )[/C][C]-0.142857142857143[/C][C]0.772619047619048[/C][/ROW]
[ROW][C]tau( RLEZ , REV )[/C][C]0.370479286817474[/C][C]0.266379923342483[/C][/ROW]
[/TABLE]
Source: https://freestatistics.org/blog/index.php?pk=21356&T=1

Globally Unique Identifier (entire table): ba.freestatistics.org/blog/index.php?pk=21356&T=1

As an alternative you can also use a QR Code:  

The GUIDs for individual cells are displayed in the table below:

Kendall tau rank correlations for all pairs of data series
pairtaup-value
tau( RNVM , RNR )0.7142857142857140.0301587301587301
tau( RNVM , RCF )0.5238095238095240.136111111111111
tau( RNVM , RLEZ )0.2646280620124820.427262856745706
tau( RNVM , REV )0.3333333333333330.381349206349206
tau( RNR , RCF )0.809523809523810.0107142857142857
tau( RNR , RLEZ )-0.05292561240249630.873844698517373
tau( RNR , REV )0.04761904761904761
tau( RCF , RLEZ )-0.2646280620124820.427262856745706
tau( RCF , REV )-0.1428571428571430.772619047619048
tau( RLEZ , REV )0.3704792868174740.266379923342483


Parameters (Session):
Parameters (R input):
par1 = ; par2 = ; par3 = ; par4 = ; par5 = ; par6 = ; par7 = ; par8 = ; par9 = ; par10 = ; par11 = ; par12 = ; par13 = ; par14 = ; par15 = ; par16 = ; par17 = ; par18 = ; par19 = ; par20 = ;
R code (references can be found in the software module):
panel.tau <- function(x, y, digits=2, prefix='', cex.cor)
{
usr <- par('usr'); on.exit(par(usr))
par(usr = c(0, 1, 0, 1))
rr <- cor.test(x, y, method='kendall')
r <- round(rr$p.value,2)
txt <- format(c(r, 0.123456789), digits=digits)[1]
txt <- paste(prefix, txt, sep='')
if(missing(cex.cor)) cex <- 0.5/strwidth(txt)
text(0.5, 0.5, txt, cex = cex)
}
panel.hist <- function(x, ...)
{
usr <- par('usr'); on.exit(par(usr))
par(usr = c(usr[1:2], 0, 1.5) )
h <- hist(x, plot = FALSE)
breaks <- h$breaks; nB <- length(breaks)
y <- h$counts; y <- y/max(y)
rect(breaks[-nB], 0, breaks[-1], y, col='grey', ...)
}
bitmap(file='test1.png')
pairs(t(y),diag.panel=panel.hist, upper.panel=panel.smooth, lower.panel=panel.tau, main=main)
dev.off()
load(file='createtable')
a<-table.start()
a<-table.row.start(a)
a<-table.element(a,'Kendall tau rank correlations for all pairs of data series',3,TRUE)
a<-table.row.end(a)
a<-table.row.start(a)
a<-table.element(a,'pair',1,TRUE)
a<-table.element(a,'tau',1,TRUE)
a<-table.element(a,'p-value',1,TRUE)
a<-table.row.end(a)
n <- length(y[,1])
n
cor.test(y[1,],y[2,],method='kendall')
for (i in 1:(n-1))
{
for (j in (i+1):n)
{
a<-table.row.start(a)
dum <- paste('tau(',dimnames(t(x))[[2]][i])
dum <- paste(dum,',')
dum <- paste(dum,dimnames(t(x))[[2]][j])
dum <- paste(dum,')')
a<-table.element(a,dum,header=TRUE)
r <- cor.test(y[i,],y[j,],method='kendall')
a<-table.element(a,r$estimate)
a<-table.element(a,r$p.value)
a<-table.row.end(a)
}
}
a<-table.end(a)
table.save(a,file='mytable.tab')