Free Statistics

of Irreproducible Research!

Author's title

Author*The author of this computation has been verified*
R Software Modulerwasp_meanplot.wasp
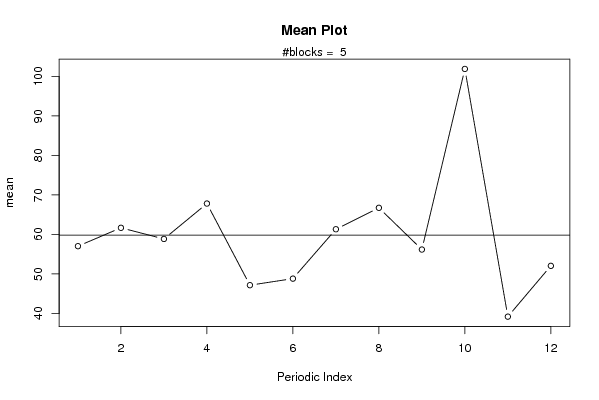
Title produced by softwareMean Plot
Date of computationMon, 03 Nov 2008 12:23:27 -0700
Cite this page as followsStatistical Computations at FreeStatistics.org, Office for Research Development and Education, URL https://freestatistics.org/blog/index.php?v=date/2008/Nov/03/t1225740325ky1b0e7rk8fvsvp.htm/, Retrieved Sun, 19 May 2024 11:14:09 +0000
Statistical Computations at FreeStatistics.org, Office for Research Development and Education, URL https://freestatistics.org/blog/index.php?pk=21051, Retrieved Sun, 19 May 2024 11:14:09 +0000
QR Codes:

Original text written by user:
IsPrivate?No (this computation is public)
User-defined keywords
Estimated Impact163
Family? (F = Feedback message, R = changed R code, M = changed R Module, P = changed Parameters, D = changed Data)
F     [Mean Plot] [workshop 3] [2007-10-26 12:14:28] [e9ffc5de6f8a7be62f22b142b5b6b1a8]
F    D  [Mean Plot] [Mean Plot Investm...] [2008-11-02 17:42:55] [bc937651ef42bf891200cf0e0edc7238]
F R  D      [Mean Plot] [Log (z) mean plot] [2008-11-03 19:23:27] [21d7d81e7693ad6dde5aadefb1046611] [Current]
Feedback Forum
2008-11-11 13:51:06 [256f97d8b7c07ed49f142eff724c6520] [reply
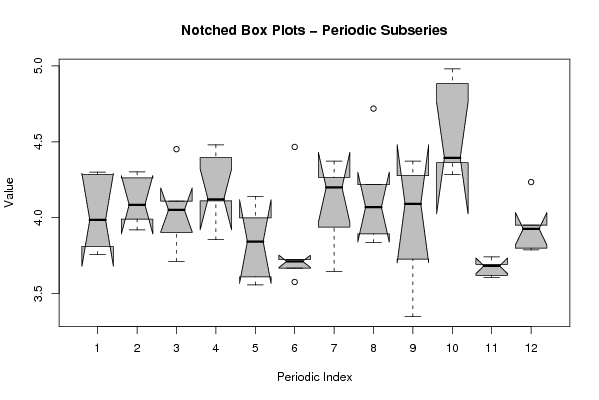
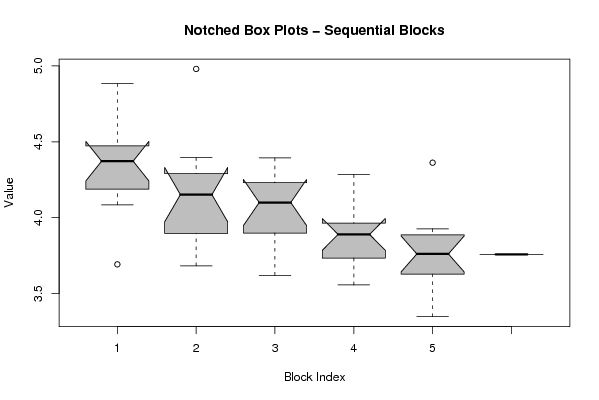
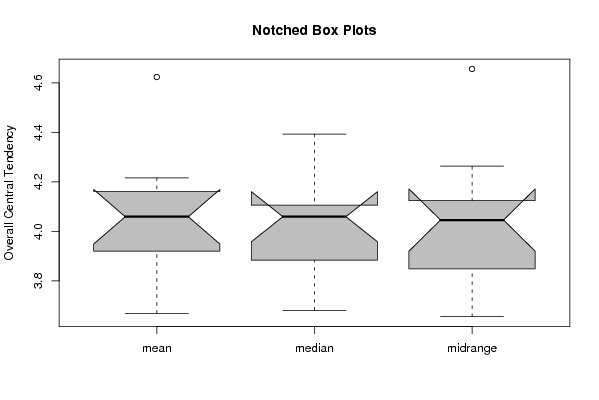
U had dit moeten bewijzen met de notched box plots.
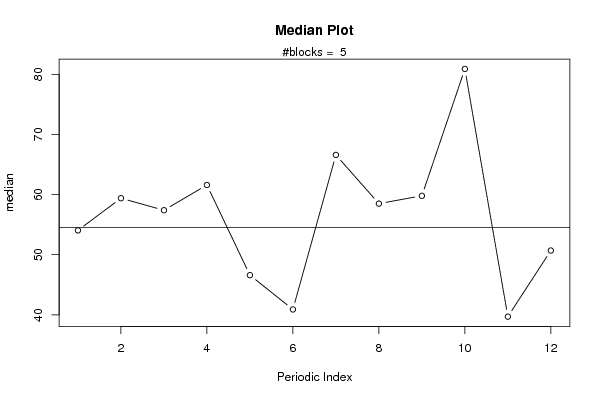
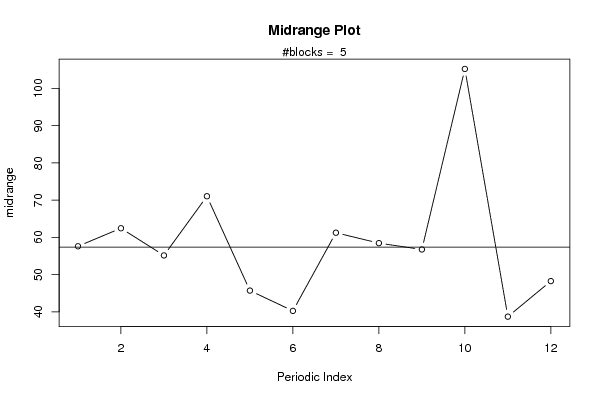
Je telt de waarden op in plaats van te vermenigvuldigen (principe van logaritmen). Hierdoor worden de grote getallen kleiner. Dit zorgt ervoor dat de schommelingen afgevlakt worden en de kleine getallen relatief grote worden. Alsook wordt de spreiding verkleint want de outliers komen dichter bij het gemiddelde.
2008-11-11 15:26:33 [Dorien Peeters] [reply
Hier mis ik net als bij de vorige antwoorden wat meer uitleg. Een logaritme gaat ervoor zorgen grote getallen veel kleiner worden->grote schommelingen worden afgezwakt; kleine worden iets groter. Outliers komen ook meer in dataset door logaritmes. Dus de spreiding moet worden aangepast(wordt kleiner)De logaritme van een getal wordt berekend op basis van een grondtal. Het grondtal is hier een waarneming uit de datareeks. Ik heb de logaritmes genomen van de outliers 132,10 en 145,5=> dankzij de logaritmes wordt de impact van deze outliers minder groot (want log zijn kleiner dan gewone waarde)=>naar nieuwe x4 kijken =>kleinste mediaan en grootste spreiding (maar nu zonder de outliers)

Post a new message
Dataseries X:
72.50
59.40
85.70
88.20
62.80
87.00
79.20
112.00
79.20
132.10
40.10
69.00
59.40
73.80
57.40
81.10
46.60
41.40
71.20
67.90
72.00
145.50
39.70
51.90
73.70
70.90
60.80
61.00
54.50
39.10
66.60
58.50
59.80
80.90
37.30
44.60
48.70
54.00
49.50
61.60
35.00
35.70
51.30
49.00
41.50
72.50
42.10
44.10
45.10
50.30
40.90
47.20
36.90
40.90
38.30
46.30
28.40
78.40
36.80
50.70
42.80


Summary of computational transaction
Raw Inputview raw input (R code)
Raw Outputview raw output of R engine
Computing time3 seconds
R Server'Sir Ronald Aylmer Fisher' @ 193.190.124.24

\begin{tabular}{lllllllll}
\hline
Summary of computational transaction \tabularnewline
Raw Input & view raw input (R code)  \tabularnewline
Raw Output & view raw output of R engine  \tabularnewline
Computing time & 3 seconds \tabularnewline
R Server & 'Sir Ronald Aylmer Fisher' @ 193.190.124.24 \tabularnewline
\hline
\end{tabular}
%Source: https://freestatistics.org/blog/index.php?pk=21051&T=0

[TABLE]
[ROW][C]Summary of computational transaction[/C][/ROW]
[ROW][C]Raw Input[/C][C]view raw input (R code) [/C][/ROW]
[ROW][C]Raw Output[/C][C]view raw output of R engine [/C][/ROW]
[ROW][C]Computing time[/C][C]3 seconds[/C][/ROW]
[ROW][C]R Server[/C][C]'Sir Ronald Aylmer Fisher' @ 193.190.124.24[/C][/ROW]
[/TABLE]
Source: https://freestatistics.org/blog/index.php?pk=21051&T=0

Globally Unique Identifier (entire table): ba.freestatistics.org/blog/index.php?pk=21051&T=0

As an alternative you can also use a QR Code:  

The GUIDs for individual cells are displayed in the table below:

Summary of computational transaction
Raw Inputview raw input (R code)
Raw Outputview raw output of R engine
Computing time3 seconds
R Server'Sir Ronald Aylmer Fisher' @ 193.190.124.24


Parameters (Session):
par1 = 12 ;
Parameters (R input):
par1 = 12 ;
R code (references can be found in the software module):
par1 <- as.numeric(par1)
(n <- length(x))
(np <- floor(n / par1))
arr <- array(NA,dim=c(par1,np+1))
ari <- array(0,dim=par1)
j <- 0
for (i in 1:n)
{
j = j + 1
ari[j] = ari[j] + 1
arr[j,ari[j]] <- x[i]
if (j == par1) j = 0
}
ari
arr
arr.mean <- array(NA,dim=par1)
arr.median <- array(NA,dim=par1)
arr.midrange <- array(NA,dim=par1)
for (j in 1:par1)
{
arr.mean[j] <- mean(arr[j,],na.rm=TRUE)
arr.median[j] <- median(arr[j,],na.rm=TRUE)
arr.midrange[j] <- (quantile(arr[j,],0.75,na.rm=TRUE) + quantile(arr[j,],0.25,na.rm=TRUE)) / 2
}
overall.mean <- mean(x)
overall.median <- median(x)
overall.midrange <- (quantile(x,0.75) + quantile(x,0.25)) / 2
bitmap(file='plot1.png')
plot(arr.mean,type='b',ylab='mean',main='Mean Plot',xlab='Periodic Index')
mtext(paste('#blocks = ',np))
abline(overall.mean,0)
dev.off()
bitmap(file='plot2.png')
plot(arr.median,type='b',ylab='median',main='Median Plot',xlab='Periodic Index')
mtext(paste('#blocks = ',np))
abline(overall.median,0)
dev.off()
bitmap(file='plot3.png')
plot(arr.midrange,type='b',ylab='midrange',main='Midrange Plot',xlab='Periodic Index')
mtext(paste('#blocks = ',np))
abline(overall.midrange,0)
dev.off()
bitmap(file='plot4.png')
z <- data.frame(t(arr))
names(z) <- c(1:par1)
(boxplot(log(z),notch=TRUE,col='grey',xlab='Periodic Index',ylab='Value',main='Notched Box Plots - Periodic Subseries'))
dev.off()
bitmap(file='plot5.png')
z <- data.frame(arr)
names(z) <- c(1:np)
(boxplot(log(z),notch=TRUE,col='grey',xlab='Block Index',ylab='Value',main='Notched Box Plots - Sequential Blocks'))
dev.off()
bitmap(file='plot6.png')
z <- data.frame(cbind(arr.mean,arr.median,arr.midrange))
names(z) <- list('mean','median','midrange')
(boxplot(log(z),notch=TRUE,col='grey',ylab='Overall Central Tendency',main='Notched Box Plots'))
dev.off()