Free Statistics

of Irreproducible Research!

Author's title

Author*The author of this computation has been verified*
R Software Modulerwasp_meanplot.wasp
Title produced by softwareMean Plot
Date of computationMon, 03 Nov 2008 11:20:44 -0700
Cite this page as followsStatistical Computations at FreeStatistics.org, Office for Research Development and Education, URL https://freestatistics.org/blog/index.php?v=date/2008/Nov/03/t12257364798ctspqqkbg1hkdz.htm/, Retrieved Sun, 19 May 2024 09:40:56 +0000
Statistical Computations at FreeStatistics.org, Office for Research Development and Education, URL https://freestatistics.org/blog/index.php?pk=20933, Retrieved Sun, 19 May 2024 09:40:56 +0000
QR Codes:

Original text written by user:
IsPrivate?No (this computation is public)
User-defined keywords
Estimated Impact182
Family? (F = Feedback message, R = changed R code, M = changed R Module, P = changed Parameters, D = changed Data)
F     [Mean Plot] [workshop 3] [2007-10-26 12:14:28] [e9ffc5de6f8a7be62f22b142b5b6b1a8]
F    D    [Mean Plot] [Task 1 Q2] [2008-11-03 18:20:44] [1fa440a634ec541bd583650ead0404df] [Current]
Feedback Forum
2008-11-06 19:00:43 [Peter Melgers] [reply
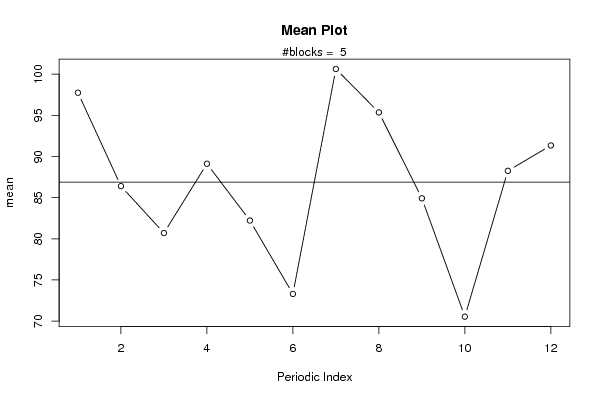
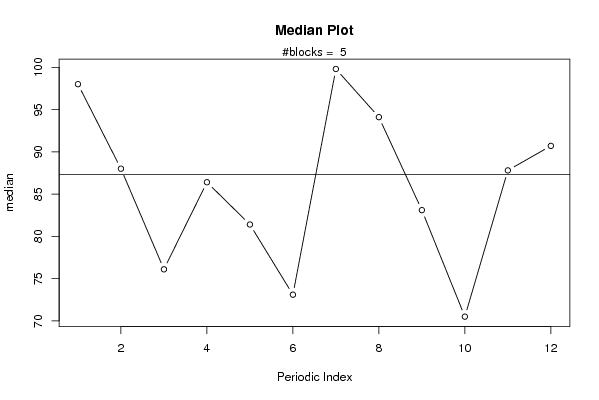
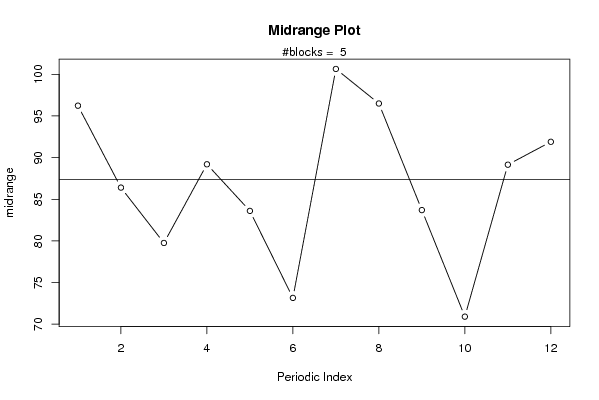
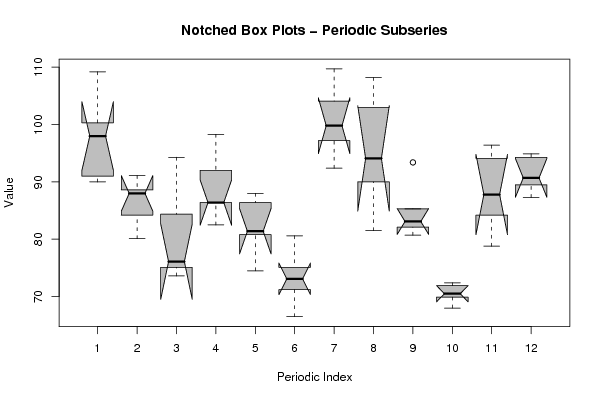
Zowel het Mean Plot, het Median Plot, het Midrange Plot en het Notched Box Plot (Periodic Subseries) zeggen hetzelfde.

Op de x-as staat de periode, in dit geval uitgedrukt in maanden (blockwidth 12). De eerste observatie (eerste bolletje) omvat het gemiddelde van maart, aangezien de datareeks begint bij maart.

De beentjes op het Notched Box Plot willen gewoon zeggen dat de spreiding groter is dan het 3de kwartiel.

Er is zeker seizonaliteit merkbaar in de datareeks. Tussen maand 6 en 7 stijgt het gemiddelde enorm, dit is te wijten aan seizonaliteit (ook vallen de medianen van maand 6 en 7 totaal niet bij elkaar in het betrouwbaarheidsinterval). Hetzelfde is ook duidelijk merkbaar bij maand 9 naar maand 10 en maand 10 naar maand 11.
2008-11-07 14:15:32 [Sofie Vanbrabant] [reply
Ik ga ook hier akkoord met de student hierboven.
2008-11-07 14:15:32 [Sofie Vanbrabant] [reply
Ik ga ook hier akkoord met de student hierboven.
2008-11-11 09:51:06 [Jens Peeters] [reply
Er is sprake van seizonaliteit.Zo liggen de zomermaanden juli en augustus duidelijk boven het gemiddelde evenals de maanden januari en december. Dit uit zich ook bij de notched box plots. De betrouwbaarheidsintervallen van deze maanden liggen ook significant hoger dan een groot deel van de andere maanden.
2008-11-11 20:06:50 [Koen Van den Heuvel] [reply
Het Mean plot gaat de tijdreeks opdelen in een aantal stukken van gelijke lengte (hier dus ingesteld op 12, zodat er per jaar gekeken wordt). Daarna wordt het gemiddelde berekend van de overeenstemmende perioden uit deze stukken. Op het mean plot kan er zo goed afgelezen worden of er een grote veranderingen meermaals in de totale tijdreeks. Zo is er rond periode 6 (dit komt overeen met augustus aangezien tijdreeks begint in maart) een diep dal, gevolgd door een sterke stijging om daarna terug af te nemen tot een ander dal rond periode 10 (december).
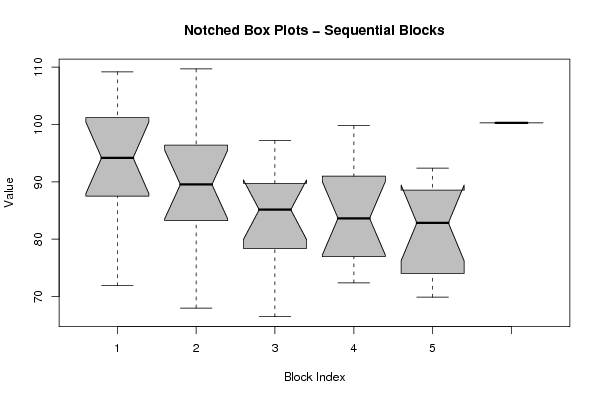
Aan de hand van de notches op de grafiek 'Notched box plots - periodic subseries' kan worden afgelezen dat er een significante verschillen zijn tussen verschillende perioden aangezien de notches niet overlappen.

Post a new message
Dataseries X:
109.20
88.60
94.30
98.30
86.40
80.60
104.10
108.20
93.40
71.90
94.10
94.90
96.40
91.10
84.40
86.40
88.00
75.10
109.70
103.00
82.10
68.00
96.40
94.30
90.00
88.00
76.10
82.50
81.40
66.50
97.20
94.10
80.70
70.50
87.80
89.50
99.60
84.20
75.10
92.00
80.80
73.10
99.80
90.00
83.10
72.40
78.80
87.30
91.00
80.10
73.60
86.40
74.50
71.20
92.40
81.50
85.30
69.90
84.20
90.70
100.30


Summary of computational transaction
Raw Inputview raw input (R code)
Raw Outputview raw output of R engine
Computing time3 seconds
R Server'George Udny Yule' @ 72.249.76.132

\begin{tabular}{lllllllll}
\hline
Summary of computational transaction \tabularnewline
Raw Input & view raw input (R code)  \tabularnewline
Raw Output & view raw output of R engine  \tabularnewline
Computing time & 3 seconds \tabularnewline
R Server & 'George Udny Yule' @ 72.249.76.132 \tabularnewline
\hline
\end{tabular}
%Source: https://freestatistics.org/blog/index.php?pk=20933&T=0

[TABLE]
[ROW][C]Summary of computational transaction[/C][/ROW]
[ROW][C]Raw Input[/C][C]view raw input (R code) [/C][/ROW]
[ROW][C]Raw Output[/C][C]view raw output of R engine [/C][/ROW]
[ROW][C]Computing time[/C][C]3 seconds[/C][/ROW]
[ROW][C]R Server[/C][C]'George Udny Yule' @ 72.249.76.132[/C][/ROW]
[/TABLE]
Source: https://freestatistics.org/blog/index.php?pk=20933&T=0

Globally Unique Identifier (entire table): ba.freestatistics.org/blog/index.php?pk=20933&T=0

As an alternative you can also use a QR Code:  

The GUIDs for individual cells are displayed in the table below:

Summary of computational transaction
Raw Inputview raw input (R code)
Raw Outputview raw output of R engine
Computing time3 seconds
R Server'George Udny Yule' @ 72.249.76.132


Parameters (Session):
par1 = 12 ;
Parameters (R input):
par1 = 12 ;
R code (references can be found in the software module):
par1 <- as.numeric(par1)
(n <- length(x))
(np <- floor(n / par1))
arr <- array(NA,dim=c(par1,np+1))
ari <- array(0,dim=par1)
j <- 0
for (i in 1:n)
{
j = j + 1
ari[j] = ari[j] + 1
arr[j,ari[j]] <- x[i]
if (j == par1) j = 0
}
ari
arr
arr.mean <- array(NA,dim=par1)
arr.median <- array(NA,dim=par1)
arr.midrange <- array(NA,dim=par1)
for (j in 1:par1)
{
arr.mean[j] <- mean(arr[j,],na.rm=TRUE)
arr.median[j] <- median(arr[j,],na.rm=TRUE)
arr.midrange[j] <- (quantile(arr[j,],0.75,na.rm=TRUE) + quantile(arr[j,],0.25,na.rm=TRUE)) / 2
}
overall.mean <- mean(x)
overall.median <- median(x)
overall.midrange <- (quantile(x,0.75) + quantile(x,0.25)) / 2
bitmap(file='plot1.png')
plot(arr.mean,type='b',ylab='mean',main='Mean Plot',xlab='Periodic Index')
mtext(paste('#blocks = ',np))
abline(overall.mean,0)
dev.off()
bitmap(file='plot2.png')
plot(arr.median,type='b',ylab='median',main='Median Plot',xlab='Periodic Index')
mtext(paste('#blocks = ',np))
abline(overall.median,0)
dev.off()
bitmap(file='plot3.png')
plot(arr.midrange,type='b',ylab='midrange',main='Midrange Plot',xlab='Periodic Index')
mtext(paste('#blocks = ',np))
abline(overall.midrange,0)
dev.off()
bitmap(file='plot4.png')
z <- data.frame(t(arr))
names(z) <- c(1:par1)
(boxplot(z,notch=TRUE,col='grey',xlab='Periodic Index',ylab='Value',main='Notched Box Plots - Periodic Subseries'))
dev.off()
bitmap(file='plot5.png')
z <- data.frame(arr)
names(z) <- c(1:np)
(boxplot(z,notch=TRUE,col='grey',xlab='Block Index',ylab='Value',main='Notched Box Plots - Sequential Blocks'))
dev.off()
bitmap(file='plot6.png')
z <- data.frame(cbind(arr.mean,arr.median,arr.midrange))
names(z) <- list('mean','median','midrange')
(boxplot(z,notch=TRUE,col='grey',ylab='Overall Central Tendency',main='Notched Box Plots'))
dev.off()