Free Statistics

of Irreproducible Research!

Author's title

Author*Unverified author*
R Software Modulerwasp_notchedbox1.wasp
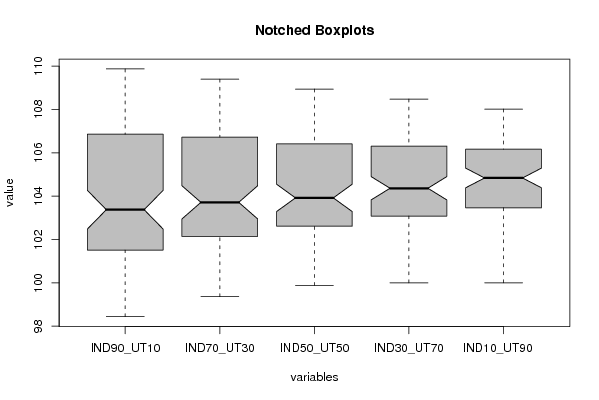
Title produced by softwareNotched Boxplots
Date of computationMon, 03 Nov 2008 10:01:06 -0700
Cite this page as followsStatistical Computations at FreeStatistics.org, Office for Research Development and Education, URL https://freestatistics.org/blog/index.php?v=date/2008/Nov/03/t12257324140ey32rgh1rimxlp.htm/, Retrieved Sun, 19 May 2024 10:48:06 +0000
Statistical Computations at FreeStatistics.org, Office for Research Development and Education, URL https://freestatistics.org/blog/index.php?pk=20887, Retrieved Sun, 19 May 2024 10:48:06 +0000
QR Codes:

Original text written by user:
IsPrivate?No (this computation is public)
User-defined keywords
Estimated Impact149
Family? (F = Feedback message, R = changed R code, M = changed R Module, P = changed Parameters, D = changed Data)
F       [Notched Boxplots] [q3 P2] [2008-11-03 17:01:06] [3cb29b4293f2e3432d2608f7187d3d03] [Current]
Feedback Forum
2008-11-06 12:00:51 [Ken Van den Heuvel] [reply
Part 1:

Hoe heb je dit geconcludeerd uit de boxplot?
Je had dit bijvoorbeeld als volgt kunnen verklaren.

De beste investering levert de meeste winst op. M.a.w. het verschil tussen beginkoers en eindkoers zal maximaal zijn. Wanneer we dit toepassen zien we dat bij IND90_UT10 dit verschil het grootste is (109,06- 100,00 = 9,06).
2008-11-06 12:04:46 [Ken Van den Heuvel] [reply
Part 2:

Je stelt: 'IND90_UT10 is het beste want de maximale waarde is het hoogste en heeft het grootste bereik tussen lower en upper hinge.'

Aangezien de investeerder te allen tijde kan verkopen is het van belang de investering te kiezen die het stabielste is. IND10_UT90 lijkt hiervoor het meeste. Kijk je naar de mediaan en de bijhorende betrouwbaarheidsintervallen dan stel je vast dat dit interval bij de laatste box inderdaad het kleinste is. Maw, de investering is stabieler.
2008-11-06 12:07:05 [Ken Van den Heuvel] [reply
Part 4:

Enkel naar de mediaan kijken is niet voldoende, je moet de betrouwbaarheidsintervallen mee onder de loep nemen.

Enkel bij geval 4 en 5 komt de lower bound boven de 103,8. Gezien de referentie 100 is, zijn dit dus de enige 2 gevallen waar de investeringsmeerwaarde boven de 3,8% zal komen.
2008-11-07 17:56:10 [Jan Van Riet] [reply
Je geeft in je antwoord voor elke eigenschap een gepast antwoord. Maar beter had je een tijdreeks gegeven die beantwoordt aan al deze eisen. Dit zou dan de laatste reeks (IND10_UT90 ) zijn, daar deze bijna helemaal boven de mediaan ligt. Dit is de beste keuze.
2008-11-10 15:38:31 [Niels Herremans] [reply
Ik heb hier de vraagstelling verkeerd begrepen en ben voor elke veronderstelling apart gaan onderzoeken wat de beste investering is.

Als ik nu voor alle veronderstellingen samen ga kijken wat de beste investering is zou ik IND10_UT90 nemen. Als ik een horizontale lijn trek ter hoogte van 103.8(ROI: 3.8%) stel ik vast dat hoogste aantal resultaten(observaties) en de mediaan boven deze lijn liggen bij IND10_UT90. Ook het betrouwbaarheidsinterval van IND10_UT90 ligt boven 103.8 dus is het niet te wijten aan toeval.
2008-11-11 16:45:59 [Bart Haemels] [reply
Ik zelf had de oprdacht ook fout opgelost. Maar je verbeterd jezeld wel correct de laatse portfolio is inderdaad de beste want deze heeft de meeste waarden met een ROI groter dan 103.8%

Post a new message
Dataseries X:
100,00	100,00	100,00	100,00	100,00
100,39	100,37	100,35	100,33	100,31
100,15	100,26	100,38	100,50	100,61
100,21	100,37	100,52	100,68	100,84
100,03	100,18	100,34	100,49	100,64
99,58	99,78	99,97	100,17	100,36
99,40	99,64	99,88	100,13	100,37
99,77	100,01	100,26	100,50	100,75
100,41	100,67	100,93	101,19	101,45
100,12	100,50	100,88	101,25	101,63
99,83	100,28	100,73	101,18	101,63
99,73	100,24	100,74	101,25	101,75
98,74	99,49	100,25	101,00	101,76
98,44	99,36	100,29	101,22	102,14
98,79	99,68	100,57	101,46	102,35
99,60	100,42	101,24	102,05	102,87
99,82	100,75	101,69	102,62	103,55
99,85	100,87	101,89	102,90	103,92
100,01	101,04	102,07	103,10	104,13
100,28	101,36	102,43	103,51	104,58
100,63	101,57	102,51	103,45	104,39
101,14	101,93	102,71	103,50	104,29
101,51	102,37	103,22	104,08	104,93
102,41	103,10	103,79	104,48	105,17
102,46	103,22	103,99	104,75	105,52
102,09	102,96	103,83	104,70	105,57
101,99	102,77	103,55	104,33	105,11
101,52	102,38	103,24	104,11	104,97
102,44	103,10	103,77	104,43	105,09
103,42	103,90	104,37	104,85	105,33
103,63	104,12	104,61	105,11	105,60
103,28	103,75	104,21	104,68	105,14
103,98	104,37	104,77	105,16	105,56
103,56	103,94	104,33	104,71	105,09
103,42	103,78	104,14	104,51	104,87
103,92	104,15	104,37	104,59	104,81
103,81	104,01	104,20	104,40	104,60
103,09	103,33	103,58	103,83	104,07
102,60	103,05	103,51	103,96	104,41
102,77	103,08	103,39	103,71	104,02
102,60	102,86	103,11	103,37	103,62
102,88	103,08	103,28	103,48	103,68
102,17	102,50	102,83	103,15	103,48
101,85	102,20	102,56	102,91	103,27
101,66	102,14	102,62	103,10	103,58
101,91	102,28	102,66	103,03	103,41
102,13	102,43	102,72	103,02	103,31
102,71	102,82	102,92	103,02	103,13
103,17	103,22	103,26	103,31	103,36
102,89	102,95	103,02	103,08	103,14
102,94	103,14	103,33	103,53	103,73
103,33	103,45	103,57	103,68	103,80
103,75	103,68	103,61	103,54	103,46
104,11	103,98	103,85	103,72	103,60
104,77	104,49	104,22	103,94	103,67
104,62	104,39	104,15	103,92	103,68
105,00	104,76	104,52	104,28	104,04
105,74	105,51	105,27	105,03	104,79
105,94	105,77	105,60	105,43	105,26
106,37	106,18	105,99	105,80	105,62
106,65	106,44	106,23	106,03	105,82
107,08	106,74	106,40	106,05	105,71
106,77	106,51	106,25	106,00	105,74
107,21	106,97	106,74	106,50	106,26
107,34	107,15	106,96	106,78	106,59
107,12	106,93	106,74	106,55	106,36
106,86	106,73	106,59	106,46	106,33
106,92	106,78	106,65	106,51	106,37
106,95	106,75	106,56	106,36	106,17
107,23	106,96	106,69	106,42	106,16
106,94	106,80	106,66	106,51	106,37
106,62	106,51	106,40	106,29	106,18
105,94	105,97	105,99	106,01	106,03
105,91	105,95	105,99	106,03	106,08
106,52	106,45	106,38	106,31	106,24
106,85	106,63	106,41	106,19	105,97
107,22	106,99	106,75	106,52	106,28
107,28	107,09	106,90	106,71	106,52
107,86	107,57	107,29	107,00	106,72
107,68	107,46	107,24	107,02	106,80
108,07	107,82	107,56	107,31	107,06
107,87	107,66	107,45	107,23	107,02
107,65	107,50	107,35	107,19	107,04
108,16	107,89	107,63	107,36	107,09
108,60	108,24	107,88	107,51	107,15
108,92	108,57	108,21	107,86	107,50
109,66	109,22	108,78	108,34	107,90
109,87	109,40	108,94	108,48	108,02
109,54	109,10	108,66	108,22	107,78
109,06	108,72	108,38	108,04	107,70


Summary of computational transaction
Raw Inputview raw input (R code)
Raw Outputview raw output of R engine
Computing time1 seconds
R Server'Gwilym Jenkins' @ 72.249.127.135
R Framework error message
The field 'Names of X columns' contains a hard return which cannot be interpreted.
Please, resubmit your request without hard returns in the 'Names of X columns'.

\begin{tabular}{lllllllll}
\hline
Summary of computational transaction \tabularnewline
Raw Input & view raw input (R code)  \tabularnewline
Raw Output & view raw output of R engine  \tabularnewline
Computing time & 1 seconds \tabularnewline
R Server & 'Gwilym Jenkins' @ 72.249.127.135 \tabularnewline
R Framework error message & 
The field 'Names of X columns' contains a hard return which cannot be interpreted.
Please, resubmit your request without hard returns in the 'Names of X columns'.
\tabularnewline \hline \end{tabular} %Source: https://freestatistics.org/blog/index.php?pk=20887&T=0

[TABLE]
[ROW][C]Summary of computational transaction[/C][/ROW]
[ROW][C]Raw Input[/C][C]view raw input (R code) [/C][/ROW]
[ROW][C]Raw Output[/C][C]view raw output of R engine [/C][/ROW]
[ROW][C]Computing time[/C][C]1 seconds[/C][/ROW]
[ROW][C]R Server[/C][C]'Gwilym Jenkins' @ 72.249.127.135[/C][/ROW]
[ROW][C]R Framework error message[/C][C]
The field 'Names of X columns' contains a hard return which cannot be interpreted.
Please, resubmit your request without hard returns in the 'Names of X columns'.
[/C][/ROW] [/TABLE] Source: https://freestatistics.org/blog/index.php?pk=20887&T=0

Globally Unique Identifier (entire table): ba.freestatistics.org/blog/index.php?pk=20887&T=0

As an alternative you can also use a QR Code:  

The GUIDs for individual cells are displayed in the table below:

Summary of computational transaction
Raw Inputview raw input (R code)
Raw Outputview raw output of R engine
Computing time1 seconds
R Server'Gwilym Jenkins' @ 72.249.127.135
R Framework error message
The field 'Names of X columns' contains a hard return which cannot be interpreted.
Please, resubmit your request without hard returns in the 'Names of X columns'.


Boxplot statistics
Variablelower whiskerlower hingemedianupper hingeupper whisker
IND90_UT1098.44101.51103.375106.86109.87
IND70_UT3099.36102.14103.715106.73109.4
IND50_UT5099.88102.62103.92106.41108.94
IND30_UT70100103.08104.365106.31108.48
IND10_UT90 100103.46104.84106.17108.02

\begin{tabular}{lllllllll}
\hline
Boxplot statistics \tabularnewline
Variable & lower whisker & lower hinge & median & upper hinge & upper whisker \tabularnewline
IND90_UT10 & 98.44 & 101.51 & 103.375 & 106.86 & 109.87 \tabularnewline
IND70_UT30 & 99.36 & 102.14 & 103.715 & 106.73 & 109.4 \tabularnewline
IND50_UT50 & 99.88 & 102.62 & 103.92 & 106.41 & 108.94 \tabularnewline
IND30_UT70 & 100 & 103.08 & 104.365 & 106.31 & 108.48 \tabularnewline
IND10_UT90
 & 100 & 103.46 & 104.84 & 106.17 & 108.02 \tabularnewline
\hline
\end{tabular}
%Source: https://freestatistics.org/blog/index.php?pk=20887&T=1

[TABLE]
[ROW][C]Boxplot statistics[/C][/ROW]
[ROW][C]Variable[/C][C]lower whisker[/C][C]lower hinge[/C][C]median[/C][C]upper hinge[/C][C]upper whisker[/C][/ROW]
[ROW][C]IND90_UT10[/C][C]98.44[/C][C]101.51[/C][C]103.375[/C][C]106.86[/C][C]109.87[/C][/ROW]
[ROW][C]IND70_UT30[/C][C]99.36[/C][C]102.14[/C][C]103.715[/C][C]106.73[/C][C]109.4[/C][/ROW]
[ROW][C]IND50_UT50[/C][C]99.88[/C][C]102.62[/C][C]103.92[/C][C]106.41[/C][C]108.94[/C][/ROW]
[ROW][C]IND30_UT70[/C][C]100[/C][C]103.08[/C][C]104.365[/C][C]106.31[/C][C]108.48[/C][/ROW]
[ROW][C]IND10_UT90
[/C][C]100[/C][C]103.46[/C][C]104.84[/C][C]106.17[/C][C]108.02[/C][/ROW]
[/TABLE]
Source: https://freestatistics.org/blog/index.php?pk=20887&T=1

Globally Unique Identifier (entire table): ba.freestatistics.org/blog/index.php?pk=20887&T=1

As an alternative you can also use a QR Code:  

The GUIDs for individual cells are displayed in the table below:

Boxplot statistics
Variablelower whiskerlower hingemedianupper hingeupper whisker
IND90_UT1098.44101.51103.375106.86109.87
IND70_UT3099.36102.14103.715106.73109.4
IND50_UT5099.88102.62103.92106.41108.94
IND30_UT70100103.08104.365106.31108.48
IND10_UT90 100103.46104.84106.17108.02


Boxplot Notches
Variablelower boundmedianupper bound
IND90_UT10102.483975564620103.375104.266024435380
IND70_UT30102.950550998431103.715104.479449001569
IND50_UT50103.288788297179103.92104.551211702821
IND30_UT70103.827054406303104.365104.902945593697
IND10_UT90 104.388658650490104.84105.291341349510

\begin{tabular}{lllllllll}
\hline
Boxplot Notches \tabularnewline
Variable & lower bound & median & upper bound \tabularnewline
IND90_UT10 & 102.483975564620 & 103.375 & 104.266024435380 \tabularnewline
IND70_UT30 & 102.950550998431 & 103.715 & 104.479449001569 \tabularnewline
IND50_UT50 & 103.288788297179 & 103.92 & 104.551211702821 \tabularnewline
IND30_UT70 & 103.827054406303 & 104.365 & 104.902945593697 \tabularnewline
IND10_UT90
 & 104.388658650490 & 104.84 & 105.291341349510 \tabularnewline
\hline
\end{tabular}
%Source: https://freestatistics.org/blog/index.php?pk=20887&T=2

[TABLE]
[ROW][C]Boxplot Notches[/C][/ROW]
[ROW][C]Variable[/C][C]lower bound[/C][C]median[/C][C]upper bound[/C][/ROW]
[ROW][C]IND90_UT10[/C][C]102.483975564620[/C][C]103.375[/C][C]104.266024435380[/C][/ROW]
[ROW][C]IND70_UT30[/C][C]102.950550998431[/C][C]103.715[/C][C]104.479449001569[/C][/ROW]
[ROW][C]IND50_UT50[/C][C]103.288788297179[/C][C]103.92[/C][C]104.551211702821[/C][/ROW]
[ROW][C]IND30_UT70[/C][C]103.827054406303[/C][C]104.365[/C][C]104.902945593697[/C][/ROW]
[ROW][C]IND10_UT90
[/C][C]104.388658650490[/C][C]104.84[/C][C]105.291341349510[/C][/ROW]
[/TABLE]
Source: https://freestatistics.org/blog/index.php?pk=20887&T=2

Globally Unique Identifier (entire table): ba.freestatistics.org/blog/index.php?pk=20887&T=2

As an alternative you can also use a QR Code:  

The GUIDs for individual cells are displayed in the table below:

Boxplot Notches
Variablelower boundmedianupper bound
IND90_UT10102.483975564620103.375104.266024435380
IND70_UT30102.950550998431103.715104.479449001569
IND50_UT50103.288788297179103.92104.551211702821
IND30_UT70103.827054406303104.365104.902945593697
IND10_UT90 104.388658650490104.84105.291341349510


Parameters (Session):
par1 = grey ;
Parameters (R input):
par1 = grey ;
R code (references can be found in the software module):
z <- as.data.frame(t(y))
bitmap(file='test1.png')
(r<-boxplot(z ,xlab=xlab,ylab=ylab,main=main,notch=TRUE,col=par1))
dev.off()
load(file='createtable')
a<-table.start()
a<-table.row.start(a)
a<-table.element(a,hyperlink('overview.htm','Boxplot statistics','Boxplot overview'),6,TRUE)
a<-table.row.end(a)
a<-table.row.start(a)
a<-table.element(a,'Variable',1,TRUE)
a<-table.element(a,hyperlink('lower_whisker.htm','lower whisker','definition of lower whisker'),1,TRUE)
a<-table.element(a,hyperlink('lower_hinge.htm','lower hinge','definition of lower hinge'),1,TRUE)
a<-table.element(a,hyperlink('central_tendency.htm','median','definitions about measures of central tendency'),1,TRUE)
a<-table.element(a,hyperlink('upper_hinge.htm','upper hinge','definition of upper hinge'),1,TRUE)
a<-table.element(a,hyperlink('upper_whisker.htm','upper whisker','definition of upper whisker'),1,TRUE)
a<-table.row.end(a)
for (i in 1:length(y[,1]))
{
a<-table.row.start(a)
a<-table.element(a,dimnames(t(x))[[2]][i],1,TRUE)
for (j in 1:5)
{
a<-table.element(a,r$stats[j,i])
}
a<-table.row.end(a)
}
a<-table.end(a)
table.save(a,file='mytable.tab')
a<-table.start()
a<-table.row.start(a)
a<-table.element(a,'Boxplot Notches',4,TRUE)
a<-table.row.end(a)
a<-table.row.start(a)
a<-table.element(a,'Variable',1,TRUE)
a<-table.element(a,'lower bound',1,TRUE)
a<-table.element(a,'median',1,TRUE)
a<-table.element(a,'upper bound',1,TRUE)
a<-table.row.end(a)
for (i in 1:length(y[,1]))
{
a<-table.row.start(a)
a<-table.element(a,dimnames(t(x))[[2]][i],1,TRUE)
a<-table.element(a,r$conf[1,i])
a<-table.element(a,r$stats[3,i])
a<-table.element(a,r$conf[2,i])
a<-table.row.end(a)
}
a<-table.end(a)
table.save(a,file='mytable1.tab')