Free Statistics

of Irreproducible Research!

Author's title

Author*The author of this computation has been verified*
R Software Modulerwasp_bootstrapplot.wasp
Title produced by softwareBlocked Bootstrap Plot - Central Tendency
Date of computationSun, 02 Nov 2008 11:21:44 -0700
Cite this page as followsStatistical Computations at FreeStatistics.org, Office for Research Development and Education, URL https://freestatistics.org/blog/index.php?v=date/2008/Nov/02/t1225653191xv1db4imf6qqzdf.htm/, Retrieved Sun, 19 May 2024 12:37:38 +0000
Statistical Computations at FreeStatistics.org, Office for Research Development and Education, URL https://freestatistics.org/blog/index.php?pk=20706, Retrieved Sun, 19 May 2024 12:37:38 +0000
QR Codes:

Original text written by user:
IsPrivate?No (this computation is public)
User-defined keywords
Estimated Impact139
Family? (F = Feedback message, R = changed R code, M = changed R Module, P = changed Parameters, D = changed Data)
F     [Blocked Bootstrap Plot - Central Tendency] [workshop 3] [2007-10-26 12:36:24] [e9ffc5de6f8a7be62f22b142b5b6b1a8]
F    D    [Blocked Bootstrap Plot - Central Tendency] [Hypotheses testin...] [2008-11-02 18:21:44] [620b6ad5c4696049e39cb73ce029682c] [Current]
Feedback Forum
2008-11-05 15:36:10 [Veerle Jackers] [reply
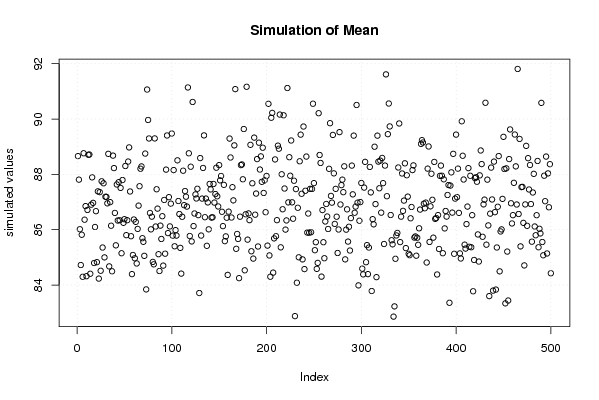
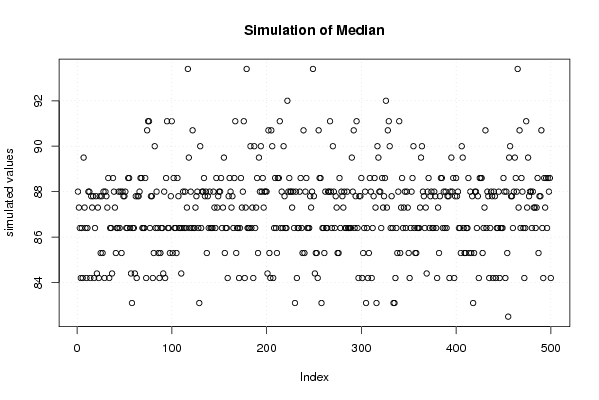
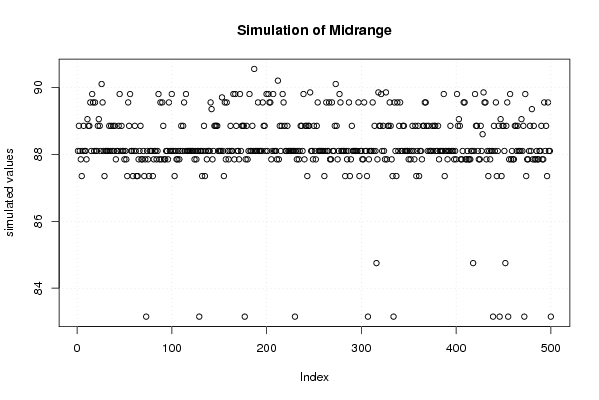
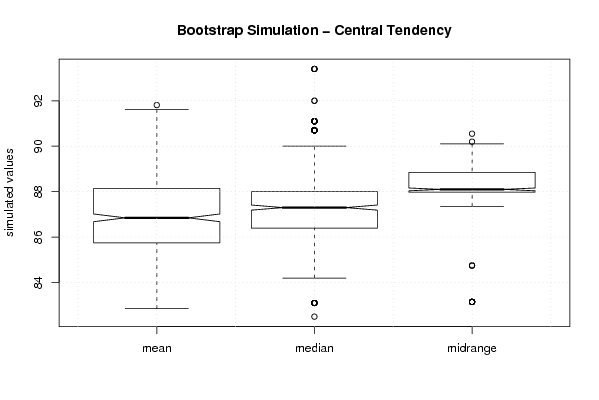
Mean is wel correct, maar je had ook naar de midrange moeten kijken. De plot van de midrange is het kleinst, dus dit wilt zeggen dat de mediaan daar het minste fluctueert. -> weinig spreiding, dus een goede schatter.
In principe is midrange het correcte antwoord, maar als we dan eens naar de outliers kijken, kunnen we twijfelen.
Midrange: goede schatter, weinig variantie, maar de outliers zijn wel extreem.
Mean: iets minder goede schatter, iets minder variantie, maar wel minder extreme outliers.
2008-11-05 16:03:41 [Ciska Tanghe] [reply
Of deze vraag al dan niet goed beantwoord werd, is moeilijk te zeggen. Het hangt af van de keuze die je neemt.

Dit leg ik even uit:
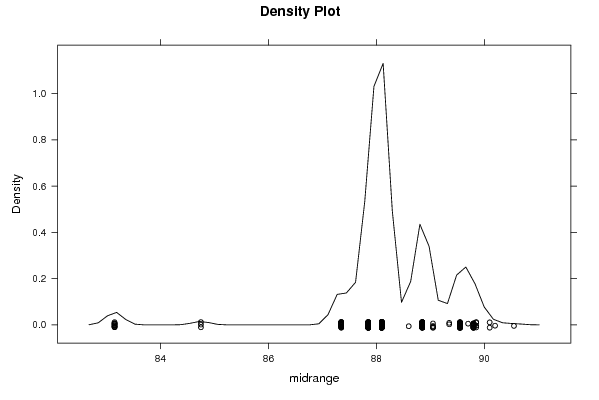
Kijken we naar de midrange, dan zien we dat deze plot het kleinst is, wat met zich meebrengt dat de mediaan daar het minst kan flucteren en de betrouwbaarheid dus heel groot is.
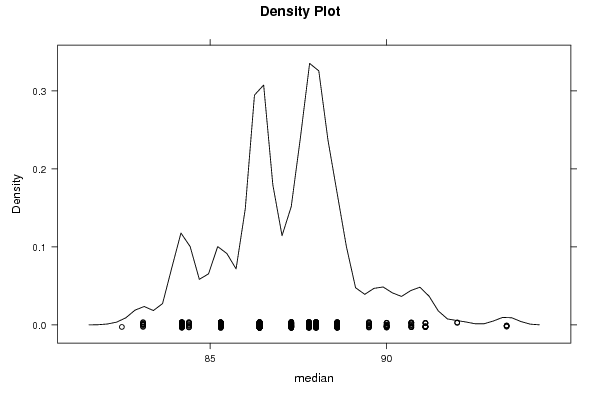
Kijken we naar de mediaan, dan zien we dat er daar een grotere spreiding is.
Kijken we naar de mean, dan zien we dat deze de grootste spreiding heeft.

We zien echter dat bij de midrange de meeste ouliers aanwezig zijn. Dit houdt in dat er een groter risico is, wanneer een berekend gemiddelde buiten de plot valt. Bij de mean kan je zekerder van het gemiddelde zijn, omdat er minder outliers zijn en deze dus minder risico's met zich meebrengen.

Afhankelijk van wat je kiest, zal de redenering bij je antwoord van belang zijn. We mogen niet vergeten dat outliers zeker relevant zijn!

Post a new message
Dataseries X:
109.20
88.60
94.30
98.30
86.40
80.60
104.10
108.20
93.40
71.90
94.10
94.90
96.40
91.10
84.40
86.40
88.00
75.10
109.70
103.00
82.10
68.00
96.40
94.30
90.00
88.00
76.10
82.50
81.40
66.50
97.20
94.10
80.70
70.50
87.80
89.50
99.60
84.20
75.10
92.00
80.80
73.10
99.80
90.00
83.10
72.40
78.80
87.30
91.00
80.10
73.60
86.40
74.50
71.20
92.40
81.50
85.30
69.90
84.20
90.70
100.30


Summary of computational transaction
Raw Inputview raw input (R code)
Raw Outputview raw output of R engine
Computing time3 seconds
R Server'Gwilym Jenkins' @ 72.249.127.135

\begin{tabular}{lllllllll}
\hline
Summary of computational transaction \tabularnewline
Raw Input & view raw input (R code)  \tabularnewline
Raw Output & view raw output of R engine  \tabularnewline
Computing time & 3 seconds \tabularnewline
R Server & 'Gwilym Jenkins' @ 72.249.127.135 \tabularnewline
\hline
\end{tabular}
%Source: https://freestatistics.org/blog/index.php?pk=20706&T=0

[TABLE]
[ROW][C]Summary of computational transaction[/C][/ROW]
[ROW][C]Raw Input[/C][C]view raw input (R code) [/C][/ROW]
[ROW][C]Raw Output[/C][C]view raw output of R engine [/C][/ROW]
[ROW][C]Computing time[/C][C]3 seconds[/C][/ROW]
[ROW][C]R Server[/C][C]'Gwilym Jenkins' @ 72.249.127.135[/C][/ROW]
[/TABLE]
Source: https://freestatistics.org/blog/index.php?pk=20706&T=0

Globally Unique Identifier (entire table): ba.freestatistics.org/blog/index.php?pk=20706&T=0

As an alternative you can also use a QR Code:  

The GUIDs for individual cells are displayed in the table below:

Summary of computational transaction
Raw Inputview raw input (R code)
Raw Outputview raw output of R engine
Computing time3 seconds
R Server'Gwilym Jenkins' @ 72.249.127.135


Estimation Results of Blocked Bootstrap
statisticQ1EstimateQ3S.D.IQR
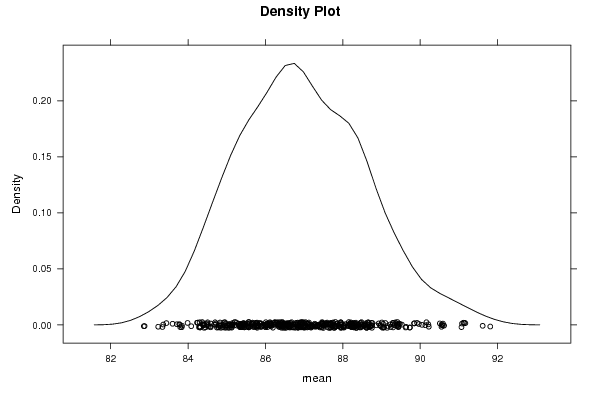
mean85.752459016393486.893442622950888.13688524590161.643588199551082.38442622950819
median86.487.3881.83581859120111.59999999999999
midrange88.037588.188.851.049803035252640.8125

\begin{tabular}{lllllllll}
\hline
Estimation Results of Blocked Bootstrap \tabularnewline
statistic & Q1 & Estimate & Q3 & S.D. & IQR \tabularnewline
mean & 85.7524590163934 & 86.8934426229508 & 88.1368852459016 & 1.64358819955108 & 2.38442622950819 \tabularnewline
median & 86.4 & 87.3 & 88 & 1.8358185912011 & 1.59999999999999 \tabularnewline
midrange & 88.0375 & 88.1 & 88.85 & 1.04980303525264 & 0.8125 \tabularnewline
\hline
\end{tabular}
%Source: https://freestatistics.org/blog/index.php?pk=20706&T=1

[TABLE]
[ROW][C]Estimation Results of Blocked Bootstrap[/C][/ROW]
[ROW][C]statistic[/C][C]Q1[/C][C]Estimate[/C][C]Q3[/C][C]S.D.[/C][C]IQR[/C][/ROW]
[ROW][C]mean[/C][C]85.7524590163934[/C][C]86.8934426229508[/C][C]88.1368852459016[/C][C]1.64358819955108[/C][C]2.38442622950819[/C][/ROW]
[ROW][C]median[/C][C]86.4[/C][C]87.3[/C][C]88[/C][C]1.8358185912011[/C][C]1.59999999999999[/C][/ROW]
[ROW][C]midrange[/C][C]88.0375[/C][C]88.1[/C][C]88.85[/C][C]1.04980303525264[/C][C]0.8125[/C][/ROW]
[/TABLE]
Source: https://freestatistics.org/blog/index.php?pk=20706&T=1

Globally Unique Identifier (entire table): ba.freestatistics.org/blog/index.php?pk=20706&T=1

As an alternative you can also use a QR Code:  

The GUIDs for individual cells are displayed in the table below:

Estimation Results of Blocked Bootstrap
statisticQ1EstimateQ3S.D.IQR
mean85.752459016393486.893442622950888.13688524590161.643588199551082.38442622950819
median86.487.3881.83581859120111.59999999999999
midrange88.037588.188.851.049803035252640.8125


Parameters (Session):
par1 = 500 ; par2 = 12 ;
Parameters (R input):
par1 = 500 ; par2 = 12 ;
R code (references can be found in the software module):
par1 <- as.numeric(par1)
par2 <- as.numeric(par2)
if (par1 < 10) par1 = 10
if (par1 > 5000) par1 = 5000
if (par2 < 3) par2 = 3
if (par2 > length(x)) par2 = length(x)
library(lattice)
library(boot)
boot.stat <- function(s)
{
s.mean <- mean(s)
s.median <- median(s)
s.midrange <- (max(s) + min(s)) / 2
c(s.mean, s.median, s.midrange)
}
(r <- tsboot(x, boot.stat, R=par1, l=12, sim='fixed'))
bitmap(file='plot1.png')
plot(r$t[,1],type='p',ylab='simulated values',main='Simulation of Mean')
grid()
dev.off()
bitmap(file='plot2.png')
plot(r$t[,2],type='p',ylab='simulated values',main='Simulation of Median')
grid()
dev.off()
bitmap(file='plot3.png')
plot(r$t[,3],type='p',ylab='simulated values',main='Simulation of Midrange')
grid()
dev.off()
bitmap(file='plot4.png')
densityplot(~r$t[,1],col='black',main='Density Plot',xlab='mean')
dev.off()
bitmap(file='plot5.png')
densityplot(~r$t[,2],col='black',main='Density Plot',xlab='median')
dev.off()
bitmap(file='plot6.png')
densityplot(~r$t[,3],col='black',main='Density Plot',xlab='midrange')
dev.off()
z <- data.frame(cbind(r$t[,1],r$t[,2],r$t[,3]))
colnames(z) <- list('mean','median','midrange')
bitmap(file='plot7.png')
boxplot(z,notch=TRUE,ylab='simulated values',main='Bootstrap Simulation - Central Tendency')
grid()
dev.off()
load(file='createtable')
a<-table.start()
a<-table.row.start(a)
a<-table.element(a,'Estimation Results of Blocked Bootstrap',6,TRUE)
a<-table.row.end(a)
a<-table.row.start(a)
a<-table.element(a,'statistic',header=TRUE)
a<-table.element(a,'Q1',header=TRUE)
a<-table.element(a,'Estimate',header=TRUE)
a<-table.element(a,'Q3',header=TRUE)
a<-table.element(a,'S.D.',header=TRUE)
a<-table.element(a,'IQR',header=TRUE)
a<-table.row.end(a)
a<-table.row.start(a)
a<-table.element(a,'mean',header=TRUE)
q1 <- quantile(r$t[,1],0.25)[[1]]
q3 <- quantile(r$t[,1],0.75)[[1]]
a<-table.element(a,q1)
a<-table.element(a,r$t0[1])
a<-table.element(a,q3)
a<-table.element(a,sqrt(var(r$t[,1])))
a<-table.element(a,q3-q1)
a<-table.row.end(a)
a<-table.row.start(a)
a<-table.element(a,'median',header=TRUE)
q1 <- quantile(r$t[,2],0.25)[[1]]
q3 <- quantile(r$t[,2],0.75)[[1]]
a<-table.element(a,q1)
a<-table.element(a,r$t0[2])
a<-table.element(a,q3)
a<-table.element(a,sqrt(var(r$t[,2])))
a<-table.element(a,q3-q1)
a<-table.row.end(a)
a<-table.row.start(a)
a<-table.element(a,'midrange',header=TRUE)
q1 <- quantile(r$t[,3],0.25)[[1]]
q3 <- quantile(r$t[,3],0.75)[[1]]
a<-table.element(a,q1)
a<-table.element(a,r$t0[3])
a<-table.element(a,q3)
a<-table.element(a,sqrt(var(r$t[,3])))
a<-table.element(a,q3-q1)
a<-table.row.end(a)
a<-table.end(a)
table.save(a,file='mytable.tab')