Free Statistics

of Irreproducible Research!

Author's title

Author*The author of this computation has been verified*
R Software Modulerwasp_notchedbox1.wasp
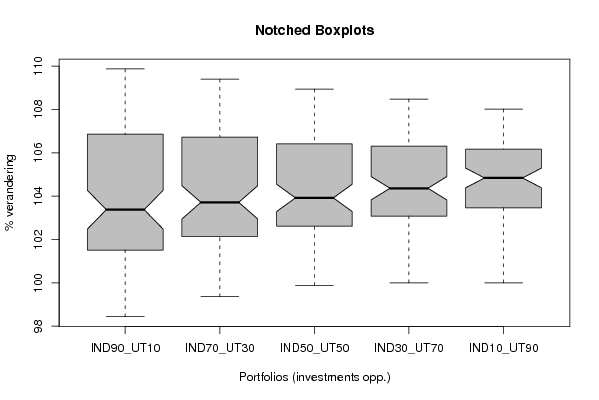
Title produced by softwareNotched Boxplots
Date of computationSat, 01 Nov 2008 10:20:45 -0600
Cite this page as followsStatistical Computations at FreeStatistics.org, Office for Research Development and Education, URL https://freestatistics.org/blog/index.php?v=date/2008/Nov/01/t12255564949inp0xi8ggg2vo0.htm/, Retrieved Sun, 19 May 2024 10:04:21 +0000
Statistical Computations at FreeStatistics.org, Office for Research Development and Education, URL https://freestatistics.org/blog/index.php?pk=20445, Retrieved Sun, 19 May 2024 10:04:21 +0000
QR Codes:

Original text written by user:
IsPrivate?No (this computation is public)
User-defined keywords
Estimated Impact158
Family? (F = Feedback message, R = changed R code, M = changed R Module, P = changed Parameters, D = changed Data)
F       [Notched Boxplots] [Hypothesis Testin...] [2008-11-01 16:20:45] [0f30549460cf4ec26d9cf94b1fcf7789] [Current]
Feedback Forum
2008-11-05 16:06:11 [Veerle Jackers] [reply
In orde, behalve laatste puntje:
The investor wants a return on investment that is significantly higher than 3.8%
Dit is enkel zo bij geval 4 (twijfelgeval) en 5.
2008-11-06 11:35:08 [Ken Van den Heuvel] [reply
Punt 1:

Beetje onvoorzichtig om je enkel op de boxplot te baseren.

Best controleren hoe de reeks juist verloopt (negatief/positief).

http://www.freestatistics.org/blog/index.php?v=date/2008/Oct/30/t1225381471f6aoaist3fp7inb.htm

Hier zie je bijvoorbeeld dat de reeks inderdaad op het einde zijn maximum bereikt. Dit kan je niet rechtstreeks van de boxplot aflezen gezien deze niet tijdgeorienteerd is.
2008-11-06 11:41:34 [Ken Van den Heuvel] [reply
Punt 2:

Wederom zie ik niet goed in hoe je juist het volledige verloop van de reeks uit deze plot kan afleiden.

http://www.freestatistics.org/blog/index.php?v=date/2008/Oct/30/t1225381841pib1iieqd4hxueo.htm

Uit bovenstaande link stel je je bevindingen toch veel eenvoudiger en zekerder vast?

Je conclusie ivm de stabiliteit is correct. Kijk je naar de mediaan en de bijhorende betrouwbaarheidsintervallen dan stel je vast dat dit interval bij de laatste box inderdaad het kleinste is. Maw, de investering is stabieler.
2008-11-06 11:44:18 [Ken Van den Heuvel] [reply
Punt 4:
Je opmerking van hierboven is inderdaad een goede zelfverbetering.

Enkel bij geval 4 en 5 komt de lower bound boven de 103,8. Gezien de referentie 100 is, zijn dit dus de enige 2 gevallen waar de investeringsmeerwaarde boven de 3,8% zal komen.
2008-11-08 15:10:01 [Jeroen Aerts] [reply
Punt 1: Je conclusie is juist maar zoals de eerde vermelde post kan je beter eerst het verloop van de grafiek opzoeken omdat je anders wel eens bedrogen uit kan komen als de grafiek negatief zou verlopen.

Punt 2:Juiste conclusie, maar ook hier weer eerst het verloop van de grafiek controleren.

Punt 3: is correct.

Punt 4: Enkel bij geval 4 & 5 komen we meer dan 3,8% uit. ( maar dat heb je zelf al verbeterd)

Post a new message
Dataseries X:
100,00	100,00	100,00	100,00	100,00
100,39	100,37	100,35	100,33	100,31
100,15	100,26	100,38	100,50	100,61
100,21	100,37	100,52	100,68	100,84
100,03	100,18	100,34	100,49	100,64
99,58	99,78	99,97	100,17	100,36
99,40	99,64	99,88	100,13	100,37
99,77	100,01	100,26	100,50	100,75
100,41	100,67	100,93	101,19	101,45
100,12	100,50	100,88	101,25	101,63
99,83	100,28	100,73	101,18	101,63
99,73	100,24	100,74	101,25	101,75
98,74	99,49	100,25	101,00	101,76
98,44	99,36	100,29	101,22	102,14
98,79	99,68	100,57	101,46	102,35
99,60	100,42	101,24	102,05	102,87
99,82	100,75	101,69	102,62	103,55
99,85	100,87	101,89	102,90	103,92
100,01	101,04	102,07	103,10	104,13
100,28	101,36	102,43	103,51	104,58
100,63	101,57	102,51	103,45	104,39
101,14	101,93	102,71	103,50	104,29
101,51	102,37	103,22	104,08	104,93
102,41	103,10	103,79	104,48	105,17
102,46	103,22	103,99	104,75	105,52
102,09	102,96	103,83	104,70	105,57
101,99	102,77	103,55	104,33	105,11
101,52	102,38	103,24	104,11	104,97
102,44	103,10	103,77	104,43	105,09
103,42	103,90	104,37	104,85	105,33
103,63	104,12	104,61	105,11	105,60
103,28	103,75	104,21	104,68	105,14
103,98	104,37	104,77	105,16	105,56
103,56	103,94	104,33	104,71	105,09
103,42	103,78	104,14	104,51	104,87
103,92	104,15	104,37	104,59	104,81
103,81	104,01	104,20	104,40	104,60
103,09	103,33	103,58	103,83	104,07
102,60	103,05	103,51	103,96	104,41
102,77	103,08	103,39	103,71	104,02
102,60	102,86	103,11	103,37	103,62
102,88	103,08	103,28	103,48	103,68
102,17	102,50	102,83	103,15	103,48
101,85	102,20	102,56	102,91	103,27
101,66	102,14	102,62	103,10	103,58
101,91	102,28	102,66	103,03	103,41
102,13	102,43	102,72	103,02	103,31
102,71	102,82	102,92	103,02	103,13
103,17	103,22	103,26	103,31	103,36
102,89	102,95	103,02	103,08	103,14
102,94	103,14	103,33	103,53	103,73
103,33	103,45	103,57	103,68	103,80
103,75	103,68	103,61	103,54	103,46
104,11	103,98	103,85	103,72	103,60
104,77	104,49	104,22	103,94	103,67
104,62	104,39	104,15	103,92	103,68
105,00	104,76	104,52	104,28	104,04
105,74	105,51	105,27	105,03	104,79
105,94	105,77	105,60	105,43	105,26
106,37	106,18	105,99	105,80	105,62
106,65	106,44	106,23	106,03	105,82
107,08	106,74	106,40	106,05	105,71
106,77	106,51	106,25	106,00	105,74
107,21	106,97	106,74	106,50	106,26
107,34	107,15	106,96	106,78	106,59
107,12	106,93	106,74	106,55	106,36
106,86	106,73	106,59	106,46	106,33
106,92	106,78	106,65	106,51	106,37
106,95	106,75	106,56	106,36	106,17
107,23	106,96	106,69	106,42	106,16
106,94	106,80	106,66	106,51	106,37
106,62	106,51	106,40	106,29	106,18
105,94	105,97	105,99	106,01	106,03
105,91	105,95	105,99	106,03	106,08
106,52	106,45	106,38	106,31	106,24
106,85	106,63	106,41	106,19	105,97
107,22	106,99	106,75	106,52	106,28
107,28	107,09	106,90	106,71	106,52
107,86	107,57	107,29	107,00	106,72
107,68	107,46	107,24	107,02	106,80
108,07	107,82	107,56	107,31	107,06
107,87	107,66	107,45	107,23	107,02
107,65	107,50	107,35	107,19	107,04
108,16	107,89	107,63	107,36	107,09
108,60	108,24	107,88	107,51	107,15
108,92	108,57	108,21	107,86	107,50
109,66	109,22	108,78	108,34	107,90
109,87	109,40	108,94	108,48	108,02
109,54	109,10	108,66	108,22	107,78
109,06	108,72	108,38	108,04	107,70


Summary of computational transaction
Raw Inputview raw input (R code)
Raw Outputview raw output of R engine
Computing time3 seconds
R Server'Sir Ronald Aylmer Fisher' @ 193.190.124.24

\begin{tabular}{lllllllll}
\hline
Summary of computational transaction \tabularnewline
Raw Input & view raw input (R code)  \tabularnewline
Raw Output & view raw output of R engine  \tabularnewline
Computing time & 3 seconds \tabularnewline
R Server & 'Sir Ronald Aylmer Fisher' @ 193.190.124.24 \tabularnewline
\hline
\end{tabular}
%Source: https://freestatistics.org/blog/index.php?pk=20445&T=0

[TABLE]
[ROW][C]Summary of computational transaction[/C][/ROW]
[ROW][C]Raw Input[/C][C]view raw input (R code) [/C][/ROW]
[ROW][C]Raw Output[/C][C]view raw output of R engine [/C][/ROW]
[ROW][C]Computing time[/C][C]3 seconds[/C][/ROW]
[ROW][C]R Server[/C][C]'Sir Ronald Aylmer Fisher' @ 193.190.124.24[/C][/ROW]
[/TABLE]
Source: https://freestatistics.org/blog/index.php?pk=20445&T=0

Globally Unique Identifier (entire table): ba.freestatistics.org/blog/index.php?pk=20445&T=0

As an alternative you can also use a QR Code:  

The GUIDs for individual cells are displayed in the table below:

Summary of computational transaction
Raw Inputview raw input (R code)
Raw Outputview raw output of R engine
Computing time3 seconds
R Server'Sir Ronald Aylmer Fisher' @ 193.190.124.24


Boxplot statistics
Variablelower whiskerlower hingemedianupper hingeupper whisker
IND90_UT1098.44101.51103.375106.86109.87
IND70_UT3099.36102.14103.715106.73109.4
IND50_UT5099.88102.62103.92106.41108.94
IND30_UT70100103.08104.365106.31108.48
IND10_UT90100103.46104.84106.17108.02

\begin{tabular}{lllllllll}
\hline
Boxplot statistics \tabularnewline
Variable & lower whisker & lower hinge & median & upper hinge & upper whisker \tabularnewline
IND90_UT10 & 98.44 & 101.51 & 103.375 & 106.86 & 109.87 \tabularnewline
IND70_UT30 & 99.36 & 102.14 & 103.715 & 106.73 & 109.4 \tabularnewline
IND50_UT50 & 99.88 & 102.62 & 103.92 & 106.41 & 108.94 \tabularnewline
IND30_UT70 & 100 & 103.08 & 104.365 & 106.31 & 108.48 \tabularnewline
IND10_UT90 & 100 & 103.46 & 104.84 & 106.17 & 108.02 \tabularnewline
\hline
\end{tabular}
%Source: https://freestatistics.org/blog/index.php?pk=20445&T=1

[TABLE]
[ROW][C]Boxplot statistics[/C][/ROW]
[ROW][C]Variable[/C][C]lower whisker[/C][C]lower hinge[/C][C]median[/C][C]upper hinge[/C][C]upper whisker[/C][/ROW]
[ROW][C]IND90_UT10[/C][C]98.44[/C][C]101.51[/C][C]103.375[/C][C]106.86[/C][C]109.87[/C][/ROW]
[ROW][C]IND70_UT30[/C][C]99.36[/C][C]102.14[/C][C]103.715[/C][C]106.73[/C][C]109.4[/C][/ROW]
[ROW][C]IND50_UT50[/C][C]99.88[/C][C]102.62[/C][C]103.92[/C][C]106.41[/C][C]108.94[/C][/ROW]
[ROW][C]IND30_UT70[/C][C]100[/C][C]103.08[/C][C]104.365[/C][C]106.31[/C][C]108.48[/C][/ROW]
[ROW][C]IND10_UT90[/C][C]100[/C][C]103.46[/C][C]104.84[/C][C]106.17[/C][C]108.02[/C][/ROW]
[/TABLE]
Source: https://freestatistics.org/blog/index.php?pk=20445&T=1

Globally Unique Identifier (entire table): ba.freestatistics.org/blog/index.php?pk=20445&T=1

As an alternative you can also use a QR Code:  

The GUIDs for individual cells are displayed in the table below:

Boxplot statistics
Variablelower whiskerlower hingemedianupper hingeupper whisker
IND90_UT1098.44101.51103.375106.86109.87
IND70_UT3099.36102.14103.715106.73109.4
IND50_UT5099.88102.62103.92106.41108.94
IND30_UT70100103.08104.365106.31108.48
IND10_UT90100103.46104.84106.17108.02


Boxplot Notches
Variablelower boundmedianupper bound
IND90_UT10102.483975564620103.375104.26602443538
IND70_UT30102.950550998431103.715104.479449001569
IND50_UT50103.288788297179103.92104.551211702821
IND30_UT70103.827054406303104.365104.902945593697
IND10_UT90104.388658650490104.84105.291341349510

\begin{tabular}{lllllllll}
\hline
Boxplot Notches \tabularnewline
Variable & lower bound & median & upper bound \tabularnewline
IND90_UT10 & 102.483975564620 & 103.375 & 104.26602443538 \tabularnewline
IND70_UT30 & 102.950550998431 & 103.715 & 104.479449001569 \tabularnewline
IND50_UT50 & 103.288788297179 & 103.92 & 104.551211702821 \tabularnewline
IND30_UT70 & 103.827054406303 & 104.365 & 104.902945593697 \tabularnewline
IND10_UT90 & 104.388658650490 & 104.84 & 105.291341349510 \tabularnewline
\hline
\end{tabular}
%Source: https://freestatistics.org/blog/index.php?pk=20445&T=2

[TABLE]
[ROW][C]Boxplot Notches[/C][/ROW]
[ROW][C]Variable[/C][C]lower bound[/C][C]median[/C][C]upper bound[/C][/ROW]
[ROW][C]IND90_UT10[/C][C]102.483975564620[/C][C]103.375[/C][C]104.26602443538[/C][/ROW]
[ROW][C]IND70_UT30[/C][C]102.950550998431[/C][C]103.715[/C][C]104.479449001569[/C][/ROW]
[ROW][C]IND50_UT50[/C][C]103.288788297179[/C][C]103.92[/C][C]104.551211702821[/C][/ROW]
[ROW][C]IND30_UT70[/C][C]103.827054406303[/C][C]104.365[/C][C]104.902945593697[/C][/ROW]
[ROW][C]IND10_UT90[/C][C]104.388658650490[/C][C]104.84[/C][C]105.291341349510[/C][/ROW]
[/TABLE]
Source: https://freestatistics.org/blog/index.php?pk=20445&T=2

Globally Unique Identifier (entire table): ba.freestatistics.org/blog/index.php?pk=20445&T=2

As an alternative you can also use a QR Code:  

The GUIDs for individual cells are displayed in the table below:

Boxplot Notches
Variablelower boundmedianupper bound
IND90_UT10102.483975564620103.375104.26602443538
IND70_UT30102.950550998431103.715104.479449001569
IND50_UT50103.288788297179103.92104.551211702821
IND30_UT70103.827054406303104.365104.902945593697
IND10_UT90104.388658650490104.84105.291341349510


Parameters (Session):
par1 = grey ;
Parameters (R input):
par1 = grey ;
R code (references can be found in the software module):
z <- as.data.frame(t(y))
bitmap(file='test1.png')
(r<-boxplot(z ,xlab=xlab,ylab=ylab,main=main,notch=TRUE,col=par1))
dev.off()
load(file='createtable')
a<-table.start()
a<-table.row.start(a)
a<-table.element(a,hyperlink('overview.htm','Boxplot statistics','Boxplot overview'),6,TRUE)
a<-table.row.end(a)
a<-table.row.start(a)
a<-table.element(a,'Variable',1,TRUE)
a<-table.element(a,hyperlink('lower_whisker.htm','lower whisker','definition of lower whisker'),1,TRUE)
a<-table.element(a,hyperlink('lower_hinge.htm','lower hinge','definition of lower hinge'),1,TRUE)
a<-table.element(a,hyperlink('central_tendency.htm','median','definitions about measures of central tendency'),1,TRUE)
a<-table.element(a,hyperlink('upper_hinge.htm','upper hinge','definition of upper hinge'),1,TRUE)
a<-table.element(a,hyperlink('upper_whisker.htm','upper whisker','definition of upper whisker'),1,TRUE)
a<-table.row.end(a)
for (i in 1:length(y[,1]))
{
a<-table.row.start(a)
a<-table.element(a,dimnames(t(x))[[2]][i],1,TRUE)
for (j in 1:5)
{
a<-table.element(a,r$stats[j,i])
}
a<-table.row.end(a)
}
a<-table.end(a)
table.save(a,file='mytable.tab')
a<-table.start()
a<-table.row.start(a)
a<-table.element(a,'Boxplot Notches',4,TRUE)
a<-table.row.end(a)
a<-table.row.start(a)
a<-table.element(a,'Variable',1,TRUE)
a<-table.element(a,'lower bound',1,TRUE)
a<-table.element(a,'median',1,TRUE)
a<-table.element(a,'upper bound',1,TRUE)
a<-table.row.end(a)
for (i in 1:length(y[,1]))
{
a<-table.row.start(a)
a<-table.element(a,dimnames(t(x))[[2]][i],1,TRUE)
a<-table.element(a,r$conf[1,i])
a<-table.element(a,r$stats[3,i])
a<-table.element(a,r$conf[2,i])
a<-table.row.end(a)
}
a<-table.end(a)
table.save(a,file='mytable1.tab')