Free Statistics

of Irreproducible Research!

Author's title

Author*Unverified author*
R Software Modulerwasp_exponentialsmoothing.wasp
Title produced by softwareExponential Smoothing
Date of computationThu, 29 May 2008 12:40:59 -0600
Cite this page as followsStatistical Computations at FreeStatistics.org, Office for Research Development and Education, URL https://freestatistics.org/blog/index.php?v=date/2008/May/29/t1212086506my2986rq52cl5u5.htm/, Retrieved Mon, 20 May 2024 02:56:50 +0000
Statistical Computations at FreeStatistics.org, Office for Research Development and Education, URL https://freestatistics.org/blog/index.php?pk=13515, Retrieved Mon, 20 May 2024 02:56:50 +0000
QR Codes:

Original text written by user:
IsPrivate?No (this computation is public)
User-defined keywords
Estimated Impact216
Family? (F = Feedback message, R = changed R code, M = changed R Module, P = changed Parameters, D = changed Data)
-       [Exponential Smoothing] [Exponential smoot...] [2008-05-29 18:40:59] [3e68c9212ad297cb41373898449ccda3] [Current]
Feedback Forum

Post a new message
Dataseries X:
68.4
70.6
83.9
90.1
90.6
87.1
90.8
94.1
99.8
96.8
87
96.3
107.1
115.2
106.1
89.5
91.3
97.6
100.7
104.6
94.7
101.8
102.5
105.3
110.3
109.8
117.3
118.8
131.3
125.9
133.1
147
145.8
164.4
149.8
137.7
151.7
156.8
180
180.4
170.4
191.6
199.5
218.2
217.5
205
194
199.3
219.3
211.1
215.2
240.2
242.2
240.7
255.4
253
218.2
203.7
205.6
215.6
188.5
202.9
214
230.3
230
241
259.6
247.8
270.3
289.7
322.7
315
320.2


Summary of computational transaction
Raw Inputview raw input (R code)
Raw Outputview raw output of R engine
Computing time6 seconds
R Server'Gwilym Jenkins' @ 72.249.127.135

\begin{tabular}{lllllllll}
\hline
Summary of computational transaction \tabularnewline
Raw Input & view raw input (R code)  \tabularnewline
Raw Output & view raw output of R engine  \tabularnewline
Computing time & 6 seconds \tabularnewline
R Server & 'Gwilym Jenkins' @ 72.249.127.135 \tabularnewline
\hline
\end{tabular}
%Source: https://freestatistics.org/blog/index.php?pk=13515&T=0

[TABLE]
[ROW][C]Summary of computational transaction[/C][/ROW]
[ROW][C]Raw Input[/C][C]view raw input (R code) [/C][/ROW]
[ROW][C]Raw Output[/C][C]view raw output of R engine [/C][/ROW]
[ROW][C]Computing time[/C][C]6 seconds[/C][/ROW]
[ROW][C]R Server[/C][C]'Gwilym Jenkins' @ 72.249.127.135[/C][/ROW]
[/TABLE]
Source: https://freestatistics.org/blog/index.php?pk=13515&T=0

Globally Unique Identifier (entire table): ba.freestatistics.org/blog/index.php?pk=13515&T=0

As an alternative you can also use a QR Code:  

The GUIDs for individual cells are displayed in the table below:

Summary of computational transaction
Raw Inputview raw input (R code)
Raw Outputview raw output of R engine
Computing time6 seconds
R Server'Gwilym Jenkins' @ 72.249.127.135


Estimated Parameters of Exponential Smoothing
ParameterValue
alpha1
beta0
gamma0

\begin{tabular}{lllllllll}
\hline
Estimated Parameters of Exponential Smoothing \tabularnewline
Parameter & Value \tabularnewline
alpha & 1 \tabularnewline
beta & 0 \tabularnewline
gamma & 0 \tabularnewline
\hline
\end{tabular}
%Source: https://freestatistics.org/blog/index.php?pk=13515&T=1

[TABLE]
[ROW][C]Estimated Parameters of Exponential Smoothing[/C][/ROW]
[ROW][C]Parameter[/C][C]Value[/C][/ROW]
[ROW][C]alpha[/C][C]1[/C][/ROW]
[ROW][C]beta[/C][C]0[/C][/ROW]
[ROW][C]gamma[/C][C]0[/C][/ROW]
[/TABLE]
Source: https://freestatistics.org/blog/index.php?pk=13515&T=1

Globally Unique Identifier (entire table): ba.freestatistics.org/blog/index.php?pk=13515&T=1

As an alternative you can also use a QR Code:  

The GUIDs for individual cells are displayed in the table below:

Estimated Parameters of Exponential Smoothing
ParameterValue
alpha1
beta0
gamma0


Interpolation Forecasts of Exponential Smoothing
tObservedFittedResiduals
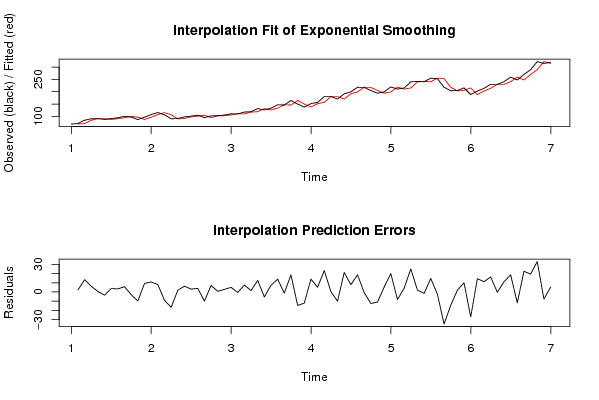
270.668.42.19999999999999
383.970.613.3
490.183.96.19999999999999
590.690.10.5
687.190.6-3.5
790.887.13.7
894.190.83.3
999.894.15.7
1096.899.8-3
118796.8-9.8
1296.3879.3
13107.196.310.8
14115.2107.18.10000000000001
15106.1115.2-9.1
1689.5106.1-16.6
1791.389.51.80000000000000
1897.691.36.3
19100.797.63.10000000000001
20104.6100.73.89999999999999
2194.7104.6-9.9
22101.894.77.1
23102.5101.80.700000000000003
24105.3102.52.800
25110.3105.35
26109.8110.3-0.5
27117.3109.87.5
28118.8117.31.5
29131.3118.812.5000000000000
30125.9131.3-5.40000000000001
31133.1125.97.19999999999999
32147133.113.9
33145.8147-1.19999999999999
34164.4145.818.6
35149.8164.4-14.6
36137.7149.8-12.1000000000000
37151.7137.714
38156.8151.75.10000000000002
39180156.823.2
40180.41800.400000000000006
41170.4180.4-10
42191.6170.421.2
43199.5191.67.9
44218.2199.518.7
45217.5218.2-0.699999999999989
46205217.5-12.5
47194205-11
48199.31945.30000000000001
49219.3199.320
50211.1219.3-8.20000000000002
51215.2211.14.09999999999999
52240.2215.225
53242.2240.22
54240.7242.2-1.5
55255.4240.714.7000000000000
56253255.4-2.40000000000001
57218.2253-34.8
58203.7218.2-14.5
59205.6203.71.90000000000001
60215.6205.610
61188.5215.6-27.1
62202.9188.514.4
63214202.911.1
64230.321416.3
65230230.3-0.300000000000011
6624123011
67259.624118.6000000000000
68247.8259.6-11.8
69270.3247.822.5
70289.7270.319.4000000000000
71322.7289.733
72315322.7-7.69999999999999
73320.23155.19999999999999

\begin{tabular}{lllllllll}
\hline
Interpolation Forecasts of Exponential Smoothing \tabularnewline
t & Observed & Fitted & Residuals \tabularnewline
2 & 70.6 & 68.4 & 2.19999999999999 \tabularnewline
3 & 83.9 & 70.6 & 13.3 \tabularnewline
4 & 90.1 & 83.9 & 6.19999999999999 \tabularnewline
5 & 90.6 & 90.1 & 0.5 \tabularnewline
6 & 87.1 & 90.6 & -3.5 \tabularnewline
7 & 90.8 & 87.1 & 3.7 \tabularnewline
8 & 94.1 & 90.8 & 3.3 \tabularnewline
9 & 99.8 & 94.1 & 5.7 \tabularnewline
10 & 96.8 & 99.8 & -3 \tabularnewline
11 & 87 & 96.8 & -9.8 \tabularnewline
12 & 96.3 & 87 & 9.3 \tabularnewline
13 & 107.1 & 96.3 & 10.8 \tabularnewline
14 & 115.2 & 107.1 & 8.10000000000001 \tabularnewline
15 & 106.1 & 115.2 & -9.1 \tabularnewline
16 & 89.5 & 106.1 & -16.6 \tabularnewline
17 & 91.3 & 89.5 & 1.80000000000000 \tabularnewline
18 & 97.6 & 91.3 & 6.3 \tabularnewline
19 & 100.7 & 97.6 & 3.10000000000001 \tabularnewline
20 & 104.6 & 100.7 & 3.89999999999999 \tabularnewline
21 & 94.7 & 104.6 & -9.9 \tabularnewline
22 & 101.8 & 94.7 & 7.1 \tabularnewline
23 & 102.5 & 101.8 & 0.700000000000003 \tabularnewline
24 & 105.3 & 102.5 & 2.800 \tabularnewline
25 & 110.3 & 105.3 & 5 \tabularnewline
26 & 109.8 & 110.3 & -0.5 \tabularnewline
27 & 117.3 & 109.8 & 7.5 \tabularnewline
28 & 118.8 & 117.3 & 1.5 \tabularnewline
29 & 131.3 & 118.8 & 12.5000000000000 \tabularnewline
30 & 125.9 & 131.3 & -5.40000000000001 \tabularnewline
31 & 133.1 & 125.9 & 7.19999999999999 \tabularnewline
32 & 147 & 133.1 & 13.9 \tabularnewline
33 & 145.8 & 147 & -1.19999999999999 \tabularnewline
34 & 164.4 & 145.8 & 18.6 \tabularnewline
35 & 149.8 & 164.4 & -14.6 \tabularnewline
36 & 137.7 & 149.8 & -12.1000000000000 \tabularnewline
37 & 151.7 & 137.7 & 14 \tabularnewline
38 & 156.8 & 151.7 & 5.10000000000002 \tabularnewline
39 & 180 & 156.8 & 23.2 \tabularnewline
40 & 180.4 & 180 & 0.400000000000006 \tabularnewline
41 & 170.4 & 180.4 & -10 \tabularnewline
42 & 191.6 & 170.4 & 21.2 \tabularnewline
43 & 199.5 & 191.6 & 7.9 \tabularnewline
44 & 218.2 & 199.5 & 18.7 \tabularnewline
45 & 217.5 & 218.2 & -0.699999999999989 \tabularnewline
46 & 205 & 217.5 & -12.5 \tabularnewline
47 & 194 & 205 & -11 \tabularnewline
48 & 199.3 & 194 & 5.30000000000001 \tabularnewline
49 & 219.3 & 199.3 & 20 \tabularnewline
50 & 211.1 & 219.3 & -8.20000000000002 \tabularnewline
51 & 215.2 & 211.1 & 4.09999999999999 \tabularnewline
52 & 240.2 & 215.2 & 25 \tabularnewline
53 & 242.2 & 240.2 & 2 \tabularnewline
54 & 240.7 & 242.2 & -1.5 \tabularnewline
55 & 255.4 & 240.7 & 14.7000000000000 \tabularnewline
56 & 253 & 255.4 & -2.40000000000001 \tabularnewline
57 & 218.2 & 253 & -34.8 \tabularnewline
58 & 203.7 & 218.2 & -14.5 \tabularnewline
59 & 205.6 & 203.7 & 1.90000000000001 \tabularnewline
60 & 215.6 & 205.6 & 10 \tabularnewline
61 & 188.5 & 215.6 & -27.1 \tabularnewline
62 & 202.9 & 188.5 & 14.4 \tabularnewline
63 & 214 & 202.9 & 11.1 \tabularnewline
64 & 230.3 & 214 & 16.3 \tabularnewline
65 & 230 & 230.3 & -0.300000000000011 \tabularnewline
66 & 241 & 230 & 11 \tabularnewline
67 & 259.6 & 241 & 18.6000000000000 \tabularnewline
68 & 247.8 & 259.6 & -11.8 \tabularnewline
69 & 270.3 & 247.8 & 22.5 \tabularnewline
70 & 289.7 & 270.3 & 19.4000000000000 \tabularnewline
71 & 322.7 & 289.7 & 33 \tabularnewline
72 & 315 & 322.7 & -7.69999999999999 \tabularnewline
73 & 320.2 & 315 & 5.19999999999999 \tabularnewline
\hline
\end{tabular}
%Source: https://freestatistics.org/blog/index.php?pk=13515&T=2

[TABLE]
[ROW][C]Interpolation Forecasts of Exponential Smoothing[/C][/ROW]
[ROW][C]t[/C][C]Observed[/C][C]Fitted[/C][C]Residuals[/C][/ROW]
[ROW][C]2[/C][C]70.6[/C][C]68.4[/C][C]2.19999999999999[/C][/ROW]
[ROW][C]3[/C][C]83.9[/C][C]70.6[/C][C]13.3[/C][/ROW]
[ROW][C]4[/C][C]90.1[/C][C]83.9[/C][C]6.19999999999999[/C][/ROW]
[ROW][C]5[/C][C]90.6[/C][C]90.1[/C][C]0.5[/C][/ROW]
[ROW][C]6[/C][C]87.1[/C][C]90.6[/C][C]-3.5[/C][/ROW]
[ROW][C]7[/C][C]90.8[/C][C]87.1[/C][C]3.7[/C][/ROW]
[ROW][C]8[/C][C]94.1[/C][C]90.8[/C][C]3.3[/C][/ROW]
[ROW][C]9[/C][C]99.8[/C][C]94.1[/C][C]5.7[/C][/ROW]
[ROW][C]10[/C][C]96.8[/C][C]99.8[/C][C]-3[/C][/ROW]
[ROW][C]11[/C][C]87[/C][C]96.8[/C][C]-9.8[/C][/ROW]
[ROW][C]12[/C][C]96.3[/C][C]87[/C][C]9.3[/C][/ROW]
[ROW][C]13[/C][C]107.1[/C][C]96.3[/C][C]10.8[/C][/ROW]
[ROW][C]14[/C][C]115.2[/C][C]107.1[/C][C]8.10000000000001[/C][/ROW]
[ROW][C]15[/C][C]106.1[/C][C]115.2[/C][C]-9.1[/C][/ROW]
[ROW][C]16[/C][C]89.5[/C][C]106.1[/C][C]-16.6[/C][/ROW]
[ROW][C]17[/C][C]91.3[/C][C]89.5[/C][C]1.80000000000000[/C][/ROW]
[ROW][C]18[/C][C]97.6[/C][C]91.3[/C][C]6.3[/C][/ROW]
[ROW][C]19[/C][C]100.7[/C][C]97.6[/C][C]3.10000000000001[/C][/ROW]
[ROW][C]20[/C][C]104.6[/C][C]100.7[/C][C]3.89999999999999[/C][/ROW]
[ROW][C]21[/C][C]94.7[/C][C]104.6[/C][C]-9.9[/C][/ROW]
[ROW][C]22[/C][C]101.8[/C][C]94.7[/C][C]7.1[/C][/ROW]
[ROW][C]23[/C][C]102.5[/C][C]101.8[/C][C]0.700000000000003[/C][/ROW]
[ROW][C]24[/C][C]105.3[/C][C]102.5[/C][C]2.800[/C][/ROW]
[ROW][C]25[/C][C]110.3[/C][C]105.3[/C][C]5[/C][/ROW]
[ROW][C]26[/C][C]109.8[/C][C]110.3[/C][C]-0.5[/C][/ROW]
[ROW][C]27[/C][C]117.3[/C][C]109.8[/C][C]7.5[/C][/ROW]
[ROW][C]28[/C][C]118.8[/C][C]117.3[/C][C]1.5[/C][/ROW]
[ROW][C]29[/C][C]131.3[/C][C]118.8[/C][C]12.5000000000000[/C][/ROW]
[ROW][C]30[/C][C]125.9[/C][C]131.3[/C][C]-5.40000000000001[/C][/ROW]
[ROW][C]31[/C][C]133.1[/C][C]125.9[/C][C]7.19999999999999[/C][/ROW]
[ROW][C]32[/C][C]147[/C][C]133.1[/C][C]13.9[/C][/ROW]
[ROW][C]33[/C][C]145.8[/C][C]147[/C][C]-1.19999999999999[/C][/ROW]
[ROW][C]34[/C][C]164.4[/C][C]145.8[/C][C]18.6[/C][/ROW]
[ROW][C]35[/C][C]149.8[/C][C]164.4[/C][C]-14.6[/C][/ROW]
[ROW][C]36[/C][C]137.7[/C][C]149.8[/C][C]-12.1000000000000[/C][/ROW]
[ROW][C]37[/C][C]151.7[/C][C]137.7[/C][C]14[/C][/ROW]
[ROW][C]38[/C][C]156.8[/C][C]151.7[/C][C]5.10000000000002[/C][/ROW]
[ROW][C]39[/C][C]180[/C][C]156.8[/C][C]23.2[/C][/ROW]
[ROW][C]40[/C][C]180.4[/C][C]180[/C][C]0.400000000000006[/C][/ROW]
[ROW][C]41[/C][C]170.4[/C][C]180.4[/C][C]-10[/C][/ROW]
[ROW][C]42[/C][C]191.6[/C][C]170.4[/C][C]21.2[/C][/ROW]
[ROW][C]43[/C][C]199.5[/C][C]191.6[/C][C]7.9[/C][/ROW]
[ROW][C]44[/C][C]218.2[/C][C]199.5[/C][C]18.7[/C][/ROW]
[ROW][C]45[/C][C]217.5[/C][C]218.2[/C][C]-0.699999999999989[/C][/ROW]
[ROW][C]46[/C][C]205[/C][C]217.5[/C][C]-12.5[/C][/ROW]
[ROW][C]47[/C][C]194[/C][C]205[/C][C]-11[/C][/ROW]
[ROW][C]48[/C][C]199.3[/C][C]194[/C][C]5.30000000000001[/C][/ROW]
[ROW][C]49[/C][C]219.3[/C][C]199.3[/C][C]20[/C][/ROW]
[ROW][C]50[/C][C]211.1[/C][C]219.3[/C][C]-8.20000000000002[/C][/ROW]
[ROW][C]51[/C][C]215.2[/C][C]211.1[/C][C]4.09999999999999[/C][/ROW]
[ROW][C]52[/C][C]240.2[/C][C]215.2[/C][C]25[/C][/ROW]
[ROW][C]53[/C][C]242.2[/C][C]240.2[/C][C]2[/C][/ROW]
[ROW][C]54[/C][C]240.7[/C][C]242.2[/C][C]-1.5[/C][/ROW]
[ROW][C]55[/C][C]255.4[/C][C]240.7[/C][C]14.7000000000000[/C][/ROW]
[ROW][C]56[/C][C]253[/C][C]255.4[/C][C]-2.40000000000001[/C][/ROW]
[ROW][C]57[/C][C]218.2[/C][C]253[/C][C]-34.8[/C][/ROW]
[ROW][C]58[/C][C]203.7[/C][C]218.2[/C][C]-14.5[/C][/ROW]
[ROW][C]59[/C][C]205.6[/C][C]203.7[/C][C]1.90000000000001[/C][/ROW]
[ROW][C]60[/C][C]215.6[/C][C]205.6[/C][C]10[/C][/ROW]
[ROW][C]61[/C][C]188.5[/C][C]215.6[/C][C]-27.1[/C][/ROW]
[ROW][C]62[/C][C]202.9[/C][C]188.5[/C][C]14.4[/C][/ROW]
[ROW][C]63[/C][C]214[/C][C]202.9[/C][C]11.1[/C][/ROW]
[ROW][C]64[/C][C]230.3[/C][C]214[/C][C]16.3[/C][/ROW]
[ROW][C]65[/C][C]230[/C][C]230.3[/C][C]-0.300000000000011[/C][/ROW]
[ROW][C]66[/C][C]241[/C][C]230[/C][C]11[/C][/ROW]
[ROW][C]67[/C][C]259.6[/C][C]241[/C][C]18.6000000000000[/C][/ROW]
[ROW][C]68[/C][C]247.8[/C][C]259.6[/C][C]-11.8[/C][/ROW]
[ROW][C]69[/C][C]270.3[/C][C]247.8[/C][C]22.5[/C][/ROW]
[ROW][C]70[/C][C]289.7[/C][C]270.3[/C][C]19.4000000000000[/C][/ROW]
[ROW][C]71[/C][C]322.7[/C][C]289.7[/C][C]33[/C][/ROW]
[ROW][C]72[/C][C]315[/C][C]322.7[/C][C]-7.69999999999999[/C][/ROW]
[ROW][C]73[/C][C]320.2[/C][C]315[/C][C]5.19999999999999[/C][/ROW]
[/TABLE]
Source: https://freestatistics.org/blog/index.php?pk=13515&T=2

Globally Unique Identifier (entire table): ba.freestatistics.org/blog/index.php?pk=13515&T=2

As an alternative you can also use a QR Code:  

The GUIDs for individual cells are displayed in the table below:

Interpolation Forecasts of Exponential Smoothing
tObservedFittedResiduals
270.668.42.19999999999999
383.970.613.3
490.183.96.19999999999999
590.690.10.5
687.190.6-3.5
790.887.13.7
894.190.83.3
999.894.15.7
1096.899.8-3
118796.8-9.8
1296.3879.3
13107.196.310.8
14115.2107.18.10000000000001
15106.1115.2-9.1
1689.5106.1-16.6
1791.389.51.80000000000000
1897.691.36.3
19100.797.63.10000000000001
20104.6100.73.89999999999999
2194.7104.6-9.9
22101.894.77.1
23102.5101.80.700000000000003
24105.3102.52.800
25110.3105.35
26109.8110.3-0.5
27117.3109.87.5
28118.8117.31.5
29131.3118.812.5000000000000
30125.9131.3-5.40000000000001
31133.1125.97.19999999999999
32147133.113.9
33145.8147-1.19999999999999
34164.4145.818.6
35149.8164.4-14.6
36137.7149.8-12.1000000000000
37151.7137.714
38156.8151.75.10000000000002
39180156.823.2
40180.41800.400000000000006
41170.4180.4-10
42191.6170.421.2
43199.5191.67.9
44218.2199.518.7
45217.5218.2-0.699999999999989
46205217.5-12.5
47194205-11
48199.31945.30000000000001
49219.3199.320
50211.1219.3-8.20000000000002
51215.2211.14.09999999999999
52240.2215.225
53242.2240.22
54240.7242.2-1.5
55255.4240.714.7000000000000
56253255.4-2.40000000000001
57218.2253-34.8
58203.7218.2-14.5
59205.6203.71.90000000000001
60215.6205.610
61188.5215.6-27.1
62202.9188.514.4
63214202.911.1
64230.321416.3
65230230.3-0.300000000000011
6624123011
67259.624118.6000000000000
68247.8259.6-11.8
69270.3247.822.5
70289.7270.319.4000000000000
71322.7289.733
72315322.7-7.69999999999999
73320.23155.19999999999999


Extrapolation Forecasts of Exponential Smoothing
tForecast95% Lower Bound95% Upper Bound
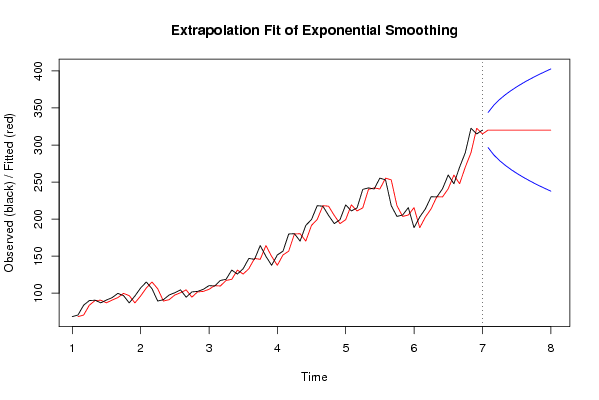
74320.2296.397229952147344.002770047853
75320.2286.537799776278353.862200223722
76320.2278.97239291624361.42760708376
77320.2272.594459904294367.805540095706
78320.2266.975388120205373.424611879795
79320.2261.895358917957378.504641082043
80320.2257.223789938924383.176210061076
81320.2252.875599552556387.524400447444
82320.2248.791689856441391.608310143559
83320.2244.929032027549395.470967972451
84320.2241.255142780162399.144857219838
85320.2237.744785832480402.65521416752

\begin{tabular}{lllllllll}
\hline
Extrapolation Forecasts of Exponential Smoothing \tabularnewline
t & Forecast & 95% Lower Bound & 95% Upper Bound \tabularnewline
74 & 320.2 & 296.397229952147 & 344.002770047853 \tabularnewline
75 & 320.2 & 286.537799776278 & 353.862200223722 \tabularnewline
76 & 320.2 & 278.97239291624 & 361.42760708376 \tabularnewline
77 & 320.2 & 272.594459904294 & 367.805540095706 \tabularnewline
78 & 320.2 & 266.975388120205 & 373.424611879795 \tabularnewline
79 & 320.2 & 261.895358917957 & 378.504641082043 \tabularnewline
80 & 320.2 & 257.223789938924 & 383.176210061076 \tabularnewline
81 & 320.2 & 252.875599552556 & 387.524400447444 \tabularnewline
82 & 320.2 & 248.791689856441 & 391.608310143559 \tabularnewline
83 & 320.2 & 244.929032027549 & 395.470967972451 \tabularnewline
84 & 320.2 & 241.255142780162 & 399.144857219838 \tabularnewline
85 & 320.2 & 237.744785832480 & 402.65521416752 \tabularnewline
\hline
\end{tabular}
%Source: https://freestatistics.org/blog/index.php?pk=13515&T=3

[TABLE]
[ROW][C]Extrapolation Forecasts of Exponential Smoothing[/C][/ROW]
[ROW][C]t[/C][C]Forecast[/C][C]95% Lower Bound[/C][C]95% Upper Bound[/C][/ROW]
[ROW][C]74[/C][C]320.2[/C][C]296.397229952147[/C][C]344.002770047853[/C][/ROW]
[ROW][C]75[/C][C]320.2[/C][C]286.537799776278[/C][C]353.862200223722[/C][/ROW]
[ROW][C]76[/C][C]320.2[/C][C]278.97239291624[/C][C]361.42760708376[/C][/ROW]
[ROW][C]77[/C][C]320.2[/C][C]272.594459904294[/C][C]367.805540095706[/C][/ROW]
[ROW][C]78[/C][C]320.2[/C][C]266.975388120205[/C][C]373.424611879795[/C][/ROW]
[ROW][C]79[/C][C]320.2[/C][C]261.895358917957[/C][C]378.504641082043[/C][/ROW]
[ROW][C]80[/C][C]320.2[/C][C]257.223789938924[/C][C]383.176210061076[/C][/ROW]
[ROW][C]81[/C][C]320.2[/C][C]252.875599552556[/C][C]387.524400447444[/C][/ROW]
[ROW][C]82[/C][C]320.2[/C][C]248.791689856441[/C][C]391.608310143559[/C][/ROW]
[ROW][C]83[/C][C]320.2[/C][C]244.929032027549[/C][C]395.470967972451[/C][/ROW]
[ROW][C]84[/C][C]320.2[/C][C]241.255142780162[/C][C]399.144857219838[/C][/ROW]
[ROW][C]85[/C][C]320.2[/C][C]237.744785832480[/C][C]402.65521416752[/C][/ROW]
[/TABLE]
Source: https://freestatistics.org/blog/index.php?pk=13515&T=3

Globally Unique Identifier (entire table): ba.freestatistics.org/blog/index.php?pk=13515&T=3

As an alternative you can also use a QR Code:  

The GUIDs for individual cells are displayed in the table below:

Extrapolation Forecasts of Exponential Smoothing
tForecast95% Lower Bound95% Upper Bound
74320.2296.397229952147344.002770047853
75320.2286.537799776278353.862200223722
76320.2278.97239291624361.42760708376
77320.2272.594459904294367.805540095706
78320.2266.975388120205373.424611879795
79320.2261.895358917957378.504641082043
80320.2257.223789938924383.176210061076
81320.2252.875599552556387.524400447444
82320.2248.791689856441391.608310143559
83320.2244.929032027549395.470967972451
84320.2241.255142780162399.144857219838
85320.2237.744785832480402.65521416752


Parameters (Session):
par1 = 12 ; par2 = Single ; par3 = additive ;
Parameters (R input):
par1 = 12 ; par2 = Single ; par3 = additive ;
R code (references can be found in the software module):
par1 <- as.numeric(par1)
if (par2 == 'Single') K <- 1
if (par2 == 'Double') K <- 2
if (par2 == 'Triple') K <- par1
nx <- length(x)
nxmK <- nx - K
x <- ts(x, frequency = par1)
if (par2 == 'Single') fit <- HoltWinters(x, gamma=0, beta=0)
if (par2 == 'Double') fit <- HoltWinters(x, gamma=0)
if (par2 == 'Triple') fit <- HoltWinters(x, seasonal=par3)
fit
myresid <- x - fit$fitted[,'xhat']
bitmap(file='test1.png')
op <- par(mfrow=c(2,1))
plot(fit,ylab='Observed (black) / Fitted (red)',main='Interpolation Fit of Exponential Smoothing')
plot(myresid,ylab='Residuals',main='Interpolation Prediction Errors')
par(op)
dev.off()
bitmap(file='test2.png')
p <- predict(fit, par1, prediction.interval=TRUE)
np <- length(p[,1])
plot(fit,p,ylab='Observed (black) / Fitted (red)',main='Extrapolation Fit of Exponential Smoothing')
dev.off()
bitmap(file='test3.png')
op <- par(mfrow = c(2,2))
acf(as.numeric(myresid),lag.max = nx/2,main='Residual ACF')
spectrum(myresid,main='Residals Periodogram')
cpgram(myresid,main='Residal Cumulative Periodogram')
qqnorm(myresid,main='Residual Normal QQ Plot')
qqline(myresid)
par(op)
dev.off()
load(file='createtable')
a<-table.start()
a<-table.row.start(a)
a<-table.element(a,'Estimated Parameters of Exponential Smoothing',2,TRUE)
a<-table.row.end(a)
a<-table.row.start(a)
a<-table.element(a,'Parameter',header=TRUE)
a<-table.element(a,'Value',header=TRUE)
a<-table.row.end(a)
a<-table.row.start(a)
a<-table.element(a,'alpha',header=TRUE)
a<-table.element(a,fit$alpha)
a<-table.row.end(a)
a<-table.row.start(a)
a<-table.element(a,'beta',header=TRUE)
a<-table.element(a,fit$beta)
a<-table.row.end(a)
a<-table.row.start(a)
a<-table.element(a,'gamma',header=TRUE)
a<-table.element(a,fit$gamma)
a<-table.row.end(a)
a<-table.end(a)
table.save(a,file='mytable.tab')
a<-table.start()
a<-table.row.start(a)
a<-table.element(a,'Interpolation Forecasts of Exponential Smoothing',4,TRUE)
a<-table.row.end(a)
a<-table.row.start(a)
a<-table.element(a,'t',header=TRUE)
a<-table.element(a,'Observed',header=TRUE)
a<-table.element(a,'Fitted',header=TRUE)
a<-table.element(a,'Residuals',header=TRUE)
a<-table.row.end(a)
for (i in 1:nxmK) {
a<-table.row.start(a)
a<-table.element(a,i+K,header=TRUE)
a<-table.element(a,x[i+K])
a<-table.element(a,fit$fitted[i,'xhat'])
a<-table.element(a,myresid[i])
a<-table.row.end(a)
}
a<-table.end(a)
table.save(a,file='mytable1.tab')
a<-table.start()
a<-table.row.start(a)
a<-table.element(a,'Extrapolation Forecasts of Exponential Smoothing',4,TRUE)
a<-table.row.end(a)
a<-table.row.start(a)
a<-table.element(a,'t',header=TRUE)
a<-table.element(a,'Forecast',header=TRUE)
a<-table.element(a,'95% Lower Bound',header=TRUE)
a<-table.element(a,'95% Upper Bound',header=TRUE)
a<-table.row.end(a)
for (i in 1:np) {
a<-table.row.start(a)
a<-table.element(a,nx+i,header=TRUE)
a<-table.element(a,p[i,'fit'])
a<-table.element(a,p[i,'lwr'])
a<-table.element(a,p[i,'upr'])
a<-table.row.end(a)
}
a<-table.end(a)
table.save(a,file='mytable2.tab')