Free Statistics

of Irreproducible Research!

Author's title

Author*Unverified author*
R Software Modulerwasp_exponentialsmoothing.wasp
Title produced by softwareExponential Smoothing
Date of computationWed, 28 May 2008 12:56:30 -0600
Cite this page as followsStatistical Computations at FreeStatistics.org, Office for Research Development and Education, URL https://freestatistics.org/blog/index.php?v=date/2008/May/28/t1212001262pg4q77yc5yelgsm.htm/, Retrieved Sun, 19 May 2024 23:04:20 +0000
Statistical Computations at FreeStatistics.org, Office for Research Development and Education, URL https://freestatistics.org/blog/index.php?pk=13469, Retrieved Sun, 19 May 2024 23:04:20 +0000
QR Codes:

Original text written by user:
IsPrivate?No (this computation is public)
User-defined keywords
Estimated Impact185
Family? (F = Feedback message, R = changed R code, M = changed R Module, P = changed Parameters, D = changed Data)
-       [Exponential Smoothing] [ExponentialSmooth...] [2008-05-28 18:56:30] [d41d8cd98f00b204e9800998ecf8427e] [Current]
Feedback Forum

Post a new message
Dataseries X:
1.43
1.43
1.43
1.43
1.43
1.43
1.43
1.43
1.43
1.43
1.43
1.43
1.43
1.43
1.43
1.43
1.43
1.43
1.43
1.44
1.48
1.48
1.48
1.48
1.48
1.48
1.48
1.48
1.48
1.48
1.48
1.48
1.48
1.48
1.48
1.48
1.48
1.48
1.48
1.48
1.48
1.48
1.48
1.48
1.48
1.48
1.48
1.48
1.48
1.48
1.57
1.58
1.58
1.58
1.58
1.59
1.6
1.6
1.61
1.61
1.61
1.62
1.63
1.63
1.64
1.64
1.64
1.64
1.64
1.65
1.65
1.65
1.65


Summary of computational transaction
Raw Inputview raw input (R code)
Raw Outputview raw output of R engine
Computing time2 seconds
R Server'Sir Ronald Aylmer Fisher' @ 193.190.124.24

\begin{tabular}{lllllllll}
\hline
Summary of computational transaction \tabularnewline
Raw Input & view raw input (R code)  \tabularnewline
Raw Output & view raw output of R engine  \tabularnewline
Computing time & 2 seconds \tabularnewline
R Server & 'Sir Ronald Aylmer Fisher' @ 193.190.124.24 \tabularnewline
\hline
\end{tabular}
%Source: https://freestatistics.org/blog/index.php?pk=13469&T=0

[TABLE]
[ROW][C]Summary of computational transaction[/C][/ROW]
[ROW][C]Raw Input[/C][C]view raw input (R code) [/C][/ROW]
[ROW][C]Raw Output[/C][C]view raw output of R engine [/C][/ROW]
[ROW][C]Computing time[/C][C]2 seconds[/C][/ROW]
[ROW][C]R Server[/C][C]'Sir Ronald Aylmer Fisher' @ 193.190.124.24[/C][/ROW]
[/TABLE]
Source: https://freestatistics.org/blog/index.php?pk=13469&T=0

Globally Unique Identifier (entire table): ba.freestatistics.org/blog/index.php?pk=13469&T=0

As an alternative you can also use a QR Code:  

The GUIDs for individual cells are displayed in the table below:

Summary of computational transaction
Raw Inputview raw input (R code)
Raw Outputview raw output of R engine
Computing time2 seconds
R Server'Sir Ronald Aylmer Fisher' @ 193.190.124.24


Estimated Parameters of Exponential Smoothing
ParameterValue
alpha1
beta0
gamma0

\begin{tabular}{lllllllll}
\hline
Estimated Parameters of Exponential Smoothing \tabularnewline
Parameter & Value \tabularnewline
alpha & 1 \tabularnewline
beta & 0 \tabularnewline
gamma & 0 \tabularnewline
\hline
\end{tabular}
%Source: https://freestatistics.org/blog/index.php?pk=13469&T=1

[TABLE]
[ROW][C]Estimated Parameters of Exponential Smoothing[/C][/ROW]
[ROW][C]Parameter[/C][C]Value[/C][/ROW]
[ROW][C]alpha[/C][C]1[/C][/ROW]
[ROW][C]beta[/C][C]0[/C][/ROW]
[ROW][C]gamma[/C][C]0[/C][/ROW]
[/TABLE]
Source: https://freestatistics.org/blog/index.php?pk=13469&T=1

Globally Unique Identifier (entire table): ba.freestatistics.org/blog/index.php?pk=13469&T=1

As an alternative you can also use a QR Code:  

The GUIDs for individual cells are displayed in the table below:

Estimated Parameters of Exponential Smoothing
ParameterValue
alpha1
beta0
gamma0


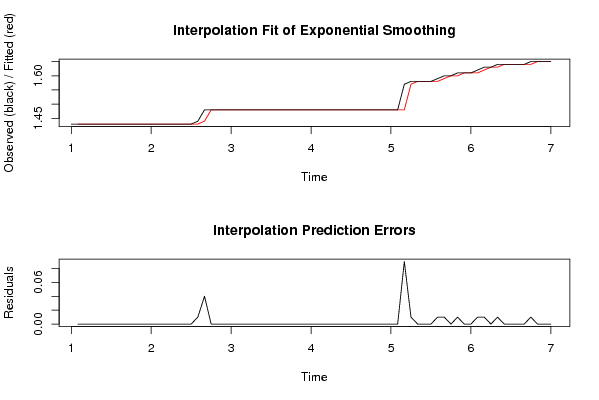
Interpolation Forecasts of Exponential Smoothing
tObservedFittedResiduals
21.431.430
31.431.430
41.431.430
51.431.430
61.431.430
71.431.430
81.431.430
91.431.430
101.431.430
111.431.430
121.431.430
131.431.430
141.431.430
151.431.430
161.431.430
171.431.430
181.431.430
191.431.430
201.441.430.01
211.481.440.04
221.481.480
231.481.480
241.481.480
251.481.480
261.481.480
271.481.480
281.481.480
291.481.480
301.481.480
311.481.480
321.481.480
331.481.480
341.481.480
351.481.480
361.481.480
371.481.480
381.481.480
391.481.480
401.481.480
411.481.480
421.481.480
431.481.480
441.481.480
451.481.480
461.481.480
471.481.480
481.481.480
491.481.480
501.481.480
511.571.480.09
521.581.570.01
531.581.580
541.581.580
551.581.580
561.591.580.01
571.61.590.01
581.61.60
591.611.60.01
601.611.610
611.611.610
621.621.610.01
631.631.620.00999999999999979
641.631.630
651.641.630.01
661.641.640
671.641.640
681.641.640
691.641.640
701.651.640.01
711.651.650
721.651.650
731.651.650

\begin{tabular}{lllllllll}
\hline
Interpolation Forecasts of Exponential Smoothing \tabularnewline
t & Observed & Fitted & Residuals \tabularnewline
2 & 1.43 & 1.43 & 0 \tabularnewline
3 & 1.43 & 1.43 & 0 \tabularnewline
4 & 1.43 & 1.43 & 0 \tabularnewline
5 & 1.43 & 1.43 & 0 \tabularnewline
6 & 1.43 & 1.43 & 0 \tabularnewline
7 & 1.43 & 1.43 & 0 \tabularnewline
8 & 1.43 & 1.43 & 0 \tabularnewline
9 & 1.43 & 1.43 & 0 \tabularnewline
10 & 1.43 & 1.43 & 0 \tabularnewline
11 & 1.43 & 1.43 & 0 \tabularnewline
12 & 1.43 & 1.43 & 0 \tabularnewline
13 & 1.43 & 1.43 & 0 \tabularnewline
14 & 1.43 & 1.43 & 0 \tabularnewline
15 & 1.43 & 1.43 & 0 \tabularnewline
16 & 1.43 & 1.43 & 0 \tabularnewline
17 & 1.43 & 1.43 & 0 \tabularnewline
18 & 1.43 & 1.43 & 0 \tabularnewline
19 & 1.43 & 1.43 & 0 \tabularnewline
20 & 1.44 & 1.43 & 0.01 \tabularnewline
21 & 1.48 & 1.44 & 0.04 \tabularnewline
22 & 1.48 & 1.48 & 0 \tabularnewline
23 & 1.48 & 1.48 & 0 \tabularnewline
24 & 1.48 & 1.48 & 0 \tabularnewline
25 & 1.48 & 1.48 & 0 \tabularnewline
26 & 1.48 & 1.48 & 0 \tabularnewline
27 & 1.48 & 1.48 & 0 \tabularnewline
28 & 1.48 & 1.48 & 0 \tabularnewline
29 & 1.48 & 1.48 & 0 \tabularnewline
30 & 1.48 & 1.48 & 0 \tabularnewline
31 & 1.48 & 1.48 & 0 \tabularnewline
32 & 1.48 & 1.48 & 0 \tabularnewline
33 & 1.48 & 1.48 & 0 \tabularnewline
34 & 1.48 & 1.48 & 0 \tabularnewline
35 & 1.48 & 1.48 & 0 \tabularnewline
36 & 1.48 & 1.48 & 0 \tabularnewline
37 & 1.48 & 1.48 & 0 \tabularnewline
38 & 1.48 & 1.48 & 0 \tabularnewline
39 & 1.48 & 1.48 & 0 \tabularnewline
40 & 1.48 & 1.48 & 0 \tabularnewline
41 & 1.48 & 1.48 & 0 \tabularnewline
42 & 1.48 & 1.48 & 0 \tabularnewline
43 & 1.48 & 1.48 & 0 \tabularnewline
44 & 1.48 & 1.48 & 0 \tabularnewline
45 & 1.48 & 1.48 & 0 \tabularnewline
46 & 1.48 & 1.48 & 0 \tabularnewline
47 & 1.48 & 1.48 & 0 \tabularnewline
48 & 1.48 & 1.48 & 0 \tabularnewline
49 & 1.48 & 1.48 & 0 \tabularnewline
50 & 1.48 & 1.48 & 0 \tabularnewline
51 & 1.57 & 1.48 & 0.09 \tabularnewline
52 & 1.58 & 1.57 & 0.01 \tabularnewline
53 & 1.58 & 1.58 & 0 \tabularnewline
54 & 1.58 & 1.58 & 0 \tabularnewline
55 & 1.58 & 1.58 & 0 \tabularnewline
56 & 1.59 & 1.58 & 0.01 \tabularnewline
57 & 1.6 & 1.59 & 0.01 \tabularnewline
58 & 1.6 & 1.6 & 0 \tabularnewline
59 & 1.61 & 1.6 & 0.01 \tabularnewline
60 & 1.61 & 1.61 & 0 \tabularnewline
61 & 1.61 & 1.61 & 0 \tabularnewline
62 & 1.62 & 1.61 & 0.01 \tabularnewline
63 & 1.63 & 1.62 & 0.00999999999999979 \tabularnewline
64 & 1.63 & 1.63 & 0 \tabularnewline
65 & 1.64 & 1.63 & 0.01 \tabularnewline
66 & 1.64 & 1.64 & 0 \tabularnewline
67 & 1.64 & 1.64 & 0 \tabularnewline
68 & 1.64 & 1.64 & 0 \tabularnewline
69 & 1.64 & 1.64 & 0 \tabularnewline
70 & 1.65 & 1.64 & 0.01 \tabularnewline
71 & 1.65 & 1.65 & 0 \tabularnewline
72 & 1.65 & 1.65 & 0 \tabularnewline
73 & 1.65 & 1.65 & 0 \tabularnewline
\hline
\end{tabular}
%Source: https://freestatistics.org/blog/index.php?pk=13469&T=2

[TABLE]
[ROW][C]Interpolation Forecasts of Exponential Smoothing[/C][/ROW]
[ROW][C]t[/C][C]Observed[/C][C]Fitted[/C][C]Residuals[/C][/ROW]
[ROW][C]2[/C][C]1.43[/C][C]1.43[/C][C]0[/C][/ROW]
[ROW][C]3[/C][C]1.43[/C][C]1.43[/C][C]0[/C][/ROW]
[ROW][C]4[/C][C]1.43[/C][C]1.43[/C][C]0[/C][/ROW]
[ROW][C]5[/C][C]1.43[/C][C]1.43[/C][C]0[/C][/ROW]
[ROW][C]6[/C][C]1.43[/C][C]1.43[/C][C]0[/C][/ROW]
[ROW][C]7[/C][C]1.43[/C][C]1.43[/C][C]0[/C][/ROW]
[ROW][C]8[/C][C]1.43[/C][C]1.43[/C][C]0[/C][/ROW]
[ROW][C]9[/C][C]1.43[/C][C]1.43[/C][C]0[/C][/ROW]
[ROW][C]10[/C][C]1.43[/C][C]1.43[/C][C]0[/C][/ROW]
[ROW][C]11[/C][C]1.43[/C][C]1.43[/C][C]0[/C][/ROW]
[ROW][C]12[/C][C]1.43[/C][C]1.43[/C][C]0[/C][/ROW]
[ROW][C]13[/C][C]1.43[/C][C]1.43[/C][C]0[/C][/ROW]
[ROW][C]14[/C][C]1.43[/C][C]1.43[/C][C]0[/C][/ROW]
[ROW][C]15[/C][C]1.43[/C][C]1.43[/C][C]0[/C][/ROW]
[ROW][C]16[/C][C]1.43[/C][C]1.43[/C][C]0[/C][/ROW]
[ROW][C]17[/C][C]1.43[/C][C]1.43[/C][C]0[/C][/ROW]
[ROW][C]18[/C][C]1.43[/C][C]1.43[/C][C]0[/C][/ROW]
[ROW][C]19[/C][C]1.43[/C][C]1.43[/C][C]0[/C][/ROW]
[ROW][C]20[/C][C]1.44[/C][C]1.43[/C][C]0.01[/C][/ROW]
[ROW][C]21[/C][C]1.48[/C][C]1.44[/C][C]0.04[/C][/ROW]
[ROW][C]22[/C][C]1.48[/C][C]1.48[/C][C]0[/C][/ROW]
[ROW][C]23[/C][C]1.48[/C][C]1.48[/C][C]0[/C][/ROW]
[ROW][C]24[/C][C]1.48[/C][C]1.48[/C][C]0[/C][/ROW]
[ROW][C]25[/C][C]1.48[/C][C]1.48[/C][C]0[/C][/ROW]
[ROW][C]26[/C][C]1.48[/C][C]1.48[/C][C]0[/C][/ROW]
[ROW][C]27[/C][C]1.48[/C][C]1.48[/C][C]0[/C][/ROW]
[ROW][C]28[/C][C]1.48[/C][C]1.48[/C][C]0[/C][/ROW]
[ROW][C]29[/C][C]1.48[/C][C]1.48[/C][C]0[/C][/ROW]
[ROW][C]30[/C][C]1.48[/C][C]1.48[/C][C]0[/C][/ROW]
[ROW][C]31[/C][C]1.48[/C][C]1.48[/C][C]0[/C][/ROW]
[ROW][C]32[/C][C]1.48[/C][C]1.48[/C][C]0[/C][/ROW]
[ROW][C]33[/C][C]1.48[/C][C]1.48[/C][C]0[/C][/ROW]
[ROW][C]34[/C][C]1.48[/C][C]1.48[/C][C]0[/C][/ROW]
[ROW][C]35[/C][C]1.48[/C][C]1.48[/C][C]0[/C][/ROW]
[ROW][C]36[/C][C]1.48[/C][C]1.48[/C][C]0[/C][/ROW]
[ROW][C]37[/C][C]1.48[/C][C]1.48[/C][C]0[/C][/ROW]
[ROW][C]38[/C][C]1.48[/C][C]1.48[/C][C]0[/C][/ROW]
[ROW][C]39[/C][C]1.48[/C][C]1.48[/C][C]0[/C][/ROW]
[ROW][C]40[/C][C]1.48[/C][C]1.48[/C][C]0[/C][/ROW]
[ROW][C]41[/C][C]1.48[/C][C]1.48[/C][C]0[/C][/ROW]
[ROW][C]42[/C][C]1.48[/C][C]1.48[/C][C]0[/C][/ROW]
[ROW][C]43[/C][C]1.48[/C][C]1.48[/C][C]0[/C][/ROW]
[ROW][C]44[/C][C]1.48[/C][C]1.48[/C][C]0[/C][/ROW]
[ROW][C]45[/C][C]1.48[/C][C]1.48[/C][C]0[/C][/ROW]
[ROW][C]46[/C][C]1.48[/C][C]1.48[/C][C]0[/C][/ROW]
[ROW][C]47[/C][C]1.48[/C][C]1.48[/C][C]0[/C][/ROW]
[ROW][C]48[/C][C]1.48[/C][C]1.48[/C][C]0[/C][/ROW]
[ROW][C]49[/C][C]1.48[/C][C]1.48[/C][C]0[/C][/ROW]
[ROW][C]50[/C][C]1.48[/C][C]1.48[/C][C]0[/C][/ROW]
[ROW][C]51[/C][C]1.57[/C][C]1.48[/C][C]0.09[/C][/ROW]
[ROW][C]52[/C][C]1.58[/C][C]1.57[/C][C]0.01[/C][/ROW]
[ROW][C]53[/C][C]1.58[/C][C]1.58[/C][C]0[/C][/ROW]
[ROW][C]54[/C][C]1.58[/C][C]1.58[/C][C]0[/C][/ROW]
[ROW][C]55[/C][C]1.58[/C][C]1.58[/C][C]0[/C][/ROW]
[ROW][C]56[/C][C]1.59[/C][C]1.58[/C][C]0.01[/C][/ROW]
[ROW][C]57[/C][C]1.6[/C][C]1.59[/C][C]0.01[/C][/ROW]
[ROW][C]58[/C][C]1.6[/C][C]1.6[/C][C]0[/C][/ROW]
[ROW][C]59[/C][C]1.61[/C][C]1.6[/C][C]0.01[/C][/ROW]
[ROW][C]60[/C][C]1.61[/C][C]1.61[/C][C]0[/C][/ROW]
[ROW][C]61[/C][C]1.61[/C][C]1.61[/C][C]0[/C][/ROW]
[ROW][C]62[/C][C]1.62[/C][C]1.61[/C][C]0.01[/C][/ROW]
[ROW][C]63[/C][C]1.63[/C][C]1.62[/C][C]0.00999999999999979[/C][/ROW]
[ROW][C]64[/C][C]1.63[/C][C]1.63[/C][C]0[/C][/ROW]
[ROW][C]65[/C][C]1.64[/C][C]1.63[/C][C]0.01[/C][/ROW]
[ROW][C]66[/C][C]1.64[/C][C]1.64[/C][C]0[/C][/ROW]
[ROW][C]67[/C][C]1.64[/C][C]1.64[/C][C]0[/C][/ROW]
[ROW][C]68[/C][C]1.64[/C][C]1.64[/C][C]0[/C][/ROW]
[ROW][C]69[/C][C]1.64[/C][C]1.64[/C][C]0[/C][/ROW]
[ROW][C]70[/C][C]1.65[/C][C]1.64[/C][C]0.01[/C][/ROW]
[ROW][C]71[/C][C]1.65[/C][C]1.65[/C][C]0[/C][/ROW]
[ROW][C]72[/C][C]1.65[/C][C]1.65[/C][C]0[/C][/ROW]
[ROW][C]73[/C][C]1.65[/C][C]1.65[/C][C]0[/C][/ROW]
[/TABLE]
Source: https://freestatistics.org/blog/index.php?pk=13469&T=2

Globally Unique Identifier (entire table): ba.freestatistics.org/blog/index.php?pk=13469&T=2

As an alternative you can also use a QR Code:  

The GUIDs for individual cells are displayed in the table below:

Interpolation Forecasts of Exponential Smoothing
tObservedFittedResiduals
21.431.430
31.431.430
41.431.430
51.431.430
61.431.430
71.431.430
81.431.430
91.431.430
101.431.430
111.431.430
121.431.430
131.431.430
141.431.430
151.431.430
161.431.430
171.431.430
181.431.430
191.431.430
201.441.430.01
211.481.440.04
221.481.480
231.481.480
241.481.480
251.481.480
261.481.480
271.481.480
281.481.480
291.481.480
301.481.480
311.481.480
321.481.480
331.481.480
341.481.480
351.481.480
361.481.480
371.481.480
381.481.480
391.481.480
401.481.480
411.481.480
421.481.480
431.481.480
441.481.480
451.481.480
461.481.480
471.481.480
481.481.480
491.481.480
501.481.480
511.571.480.09
521.581.570.01
531.581.580
541.581.580
551.581.580
561.591.580.01
571.61.590.01
581.61.60
591.611.60.01
601.611.610
611.611.610
621.621.610.01
631.631.620.00999999999999979
641.631.630
651.641.630.01
661.641.640
671.641.640
681.641.640
691.641.640
701.651.640.01
711.651.650
721.651.650
731.651.650


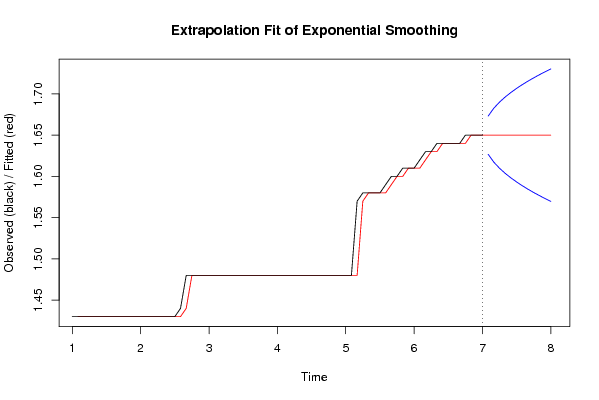
Extrapolation Forecasts of Exponential Smoothing
tForecast95% Lower Bound95% Upper Bound
741.651.626823655359261.67317634464074
751.651.617223699082841.68277630091716
761.651.609857393548521.69014260645148
771.651.603647310718531.69635268928147
781.651.598176117913351.70182388208665
791.651.593229781527311.70677021847269
801.651.588681155781091.71131884421891
811.651.584447398165681.71555260183432
821.651.580470966077791.71952903392221
831.651.576709963098241.72329003690176
841.651.573132760814721.72686723918528
851.651.569714787097041.73028521290296

\begin{tabular}{lllllllll}
\hline
Extrapolation Forecasts of Exponential Smoothing \tabularnewline
t & Forecast & 95% Lower Bound & 95% Upper Bound \tabularnewline
74 & 1.65 & 1.62682365535926 & 1.67317634464074 \tabularnewline
75 & 1.65 & 1.61722369908284 & 1.68277630091716 \tabularnewline
76 & 1.65 & 1.60985739354852 & 1.69014260645148 \tabularnewline
77 & 1.65 & 1.60364731071853 & 1.69635268928147 \tabularnewline
78 & 1.65 & 1.59817611791335 & 1.70182388208665 \tabularnewline
79 & 1.65 & 1.59322978152731 & 1.70677021847269 \tabularnewline
80 & 1.65 & 1.58868115578109 & 1.71131884421891 \tabularnewline
81 & 1.65 & 1.58444739816568 & 1.71555260183432 \tabularnewline
82 & 1.65 & 1.58047096607779 & 1.71952903392221 \tabularnewline
83 & 1.65 & 1.57670996309824 & 1.72329003690176 \tabularnewline
84 & 1.65 & 1.57313276081472 & 1.72686723918528 \tabularnewline
85 & 1.65 & 1.56971478709704 & 1.73028521290296 \tabularnewline
\hline
\end{tabular}
%Source: https://freestatistics.org/blog/index.php?pk=13469&T=3

[TABLE]
[ROW][C]Extrapolation Forecasts of Exponential Smoothing[/C][/ROW]
[ROW][C]t[/C][C]Forecast[/C][C]95% Lower Bound[/C][C]95% Upper Bound[/C][/ROW]
[ROW][C]74[/C][C]1.65[/C][C]1.62682365535926[/C][C]1.67317634464074[/C][/ROW]
[ROW][C]75[/C][C]1.65[/C][C]1.61722369908284[/C][C]1.68277630091716[/C][/ROW]
[ROW][C]76[/C][C]1.65[/C][C]1.60985739354852[/C][C]1.69014260645148[/C][/ROW]
[ROW][C]77[/C][C]1.65[/C][C]1.60364731071853[/C][C]1.69635268928147[/C][/ROW]
[ROW][C]78[/C][C]1.65[/C][C]1.59817611791335[/C][C]1.70182388208665[/C][/ROW]
[ROW][C]79[/C][C]1.65[/C][C]1.59322978152731[/C][C]1.70677021847269[/C][/ROW]
[ROW][C]80[/C][C]1.65[/C][C]1.58868115578109[/C][C]1.71131884421891[/C][/ROW]
[ROW][C]81[/C][C]1.65[/C][C]1.58444739816568[/C][C]1.71555260183432[/C][/ROW]
[ROW][C]82[/C][C]1.65[/C][C]1.58047096607779[/C][C]1.71952903392221[/C][/ROW]
[ROW][C]83[/C][C]1.65[/C][C]1.57670996309824[/C][C]1.72329003690176[/C][/ROW]
[ROW][C]84[/C][C]1.65[/C][C]1.57313276081472[/C][C]1.72686723918528[/C][/ROW]
[ROW][C]85[/C][C]1.65[/C][C]1.56971478709704[/C][C]1.73028521290296[/C][/ROW]
[/TABLE]
Source: https://freestatistics.org/blog/index.php?pk=13469&T=3

Globally Unique Identifier (entire table): ba.freestatistics.org/blog/index.php?pk=13469&T=3

As an alternative you can also use a QR Code:  

The GUIDs for individual cells are displayed in the table below:

Extrapolation Forecasts of Exponential Smoothing
tForecast95% Lower Bound95% Upper Bound
741.651.626823655359261.67317634464074
751.651.617223699082841.68277630091716
761.651.609857393548521.69014260645148
771.651.603647310718531.69635268928147
781.651.598176117913351.70182388208665
791.651.593229781527311.70677021847269
801.651.588681155781091.71131884421891
811.651.584447398165681.71555260183432
821.651.580470966077791.71952903392221
831.651.576709963098241.72329003690176
841.651.573132760814721.72686723918528
851.651.569714787097041.73028521290296


Parameters (Session):
par1 = 12 ; par2 = Single ; par3 = additive ;
Parameters (R input):
par1 = 12 ; par2 = Single ; par3 = additive ;
R code (references can be found in the software module):
par1 <- as.numeric(par1)
if (par2 == 'Single') K <- 1
if (par2 == 'Double') K <- 2
if (par2 == 'Triple') K <- par1
nx <- length(x)
nxmK <- nx - K
x <- ts(x, frequency = par1)
if (par2 == 'Single') fit <- HoltWinters(x, gamma=0, beta=0)
if (par2 == 'Double') fit <- HoltWinters(x, gamma=0)
if (par2 == 'Triple') fit <- HoltWinters(x, seasonal=par3)
fit
myresid <- x - fit$fitted[,'xhat']
bitmap(file='test1.png')
op <- par(mfrow=c(2,1))
plot(fit,ylab='Observed (black) / Fitted (red)',main='Interpolation Fit of Exponential Smoothing')
plot(myresid,ylab='Residuals',main='Interpolation Prediction Errors')
par(op)
dev.off()
bitmap(file='test2.png')
p <- predict(fit, par1, prediction.interval=TRUE)
np <- length(p[,1])
plot(fit,p,ylab='Observed (black) / Fitted (red)',main='Extrapolation Fit of Exponential Smoothing')
dev.off()
bitmap(file='test3.png')
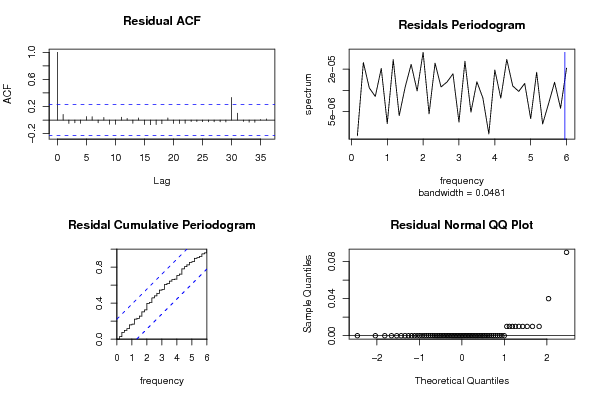
op <- par(mfrow = c(2,2))
acf(as.numeric(myresid),lag.max = nx/2,main='Residual ACF')
spectrum(myresid,main='Residals Periodogram')
cpgram(myresid,main='Residal Cumulative Periodogram')
qqnorm(myresid,main='Residual Normal QQ Plot')
qqline(myresid)
par(op)
dev.off()
load(file='createtable')
a<-table.start()
a<-table.row.start(a)
a<-table.element(a,'Estimated Parameters of Exponential Smoothing',2,TRUE)
a<-table.row.end(a)
a<-table.row.start(a)
a<-table.element(a,'Parameter',header=TRUE)
a<-table.element(a,'Value',header=TRUE)
a<-table.row.end(a)
a<-table.row.start(a)
a<-table.element(a,'alpha',header=TRUE)
a<-table.element(a,fit$alpha)
a<-table.row.end(a)
a<-table.row.start(a)
a<-table.element(a,'beta',header=TRUE)
a<-table.element(a,fit$beta)
a<-table.row.end(a)
a<-table.row.start(a)
a<-table.element(a,'gamma',header=TRUE)
a<-table.element(a,fit$gamma)
a<-table.row.end(a)
a<-table.end(a)
table.save(a,file='mytable.tab')
a<-table.start()
a<-table.row.start(a)
a<-table.element(a,'Interpolation Forecasts of Exponential Smoothing',4,TRUE)
a<-table.row.end(a)
a<-table.row.start(a)
a<-table.element(a,'t',header=TRUE)
a<-table.element(a,'Observed',header=TRUE)
a<-table.element(a,'Fitted',header=TRUE)
a<-table.element(a,'Residuals',header=TRUE)
a<-table.row.end(a)
for (i in 1:nxmK) {
a<-table.row.start(a)
a<-table.element(a,i+K,header=TRUE)
a<-table.element(a,x[i+K])
a<-table.element(a,fit$fitted[i,'xhat'])
a<-table.element(a,myresid[i])
a<-table.row.end(a)
}
a<-table.end(a)
table.save(a,file='mytable1.tab')
a<-table.start()
a<-table.row.start(a)
a<-table.element(a,'Extrapolation Forecasts of Exponential Smoothing',4,TRUE)
a<-table.row.end(a)
a<-table.row.start(a)
a<-table.element(a,'t',header=TRUE)
a<-table.element(a,'Forecast',header=TRUE)
a<-table.element(a,'95% Lower Bound',header=TRUE)
a<-table.element(a,'95% Upper Bound',header=TRUE)
a<-table.row.end(a)
for (i in 1:np) {
a<-table.row.start(a)
a<-table.element(a,nx+i,header=TRUE)
a<-table.element(a,p[i,'fit'])
a<-table.element(a,p[i,'lwr'])
a<-table.element(a,p[i,'upr'])
a<-table.row.end(a)
}
a<-table.end(a)
table.save(a,file='mytable2.tab')