Free Statistics

of Irreproducible Research!

Author's title

Author*Unverified author*
R Software Modulerwasp_smp.wasp
Title produced by softwareStandard Deviation-Mean Plot
Date of computationTue, 27 May 2008 05:56:07 -0600
Cite this page as followsStatistical Computations at FreeStatistics.org, Office for Research Development and Education, URL https://freestatistics.org/blog/index.php?v=date/2008/May/27/t1211889397a81pwgm3sy6xrzz.htm/, Retrieved Mon, 20 May 2024 01:09:11 +0000
Statistical Computations at FreeStatistics.org, Office for Research Development and Education, URL https://freestatistics.org/blog/index.php?pk=13336, Retrieved Mon, 20 May 2024 01:09:11 +0000
QR Codes:

Original text written by user:
IsPrivate?No (this computation is public)
User-defined keywords
Estimated Impact192
Family? (F = Feedback message, R = changed R code, M = changed R Module, P = changed Parameters, D = changed Data)
-     [Bootstrap Plot - Central Tendency] [Bootstrap Maximum...] [2008-05-26 18:07:41] [5a9957222b47d6f610c4aa164db8acb4]
- RMPD    [Standard Deviation-Mean Plot] [Verbetering opgav...] [2008-05-27 11:56:07] [d41d8cd98f00b204e9800998ecf8427e] [Current]
Feedback Forum

Post a new message
Dataseries X:
10236
10893
10756
10940
10997
10827
10166
10186
10457
10368
10244
10511
10812
10738
10171
9721
9897
9828
9924
10371
10846
10413
10709
10662
10570
10297
10635
10872
10296
10383
10431
10574
10653
10805
10872
10625
10407
10463
10556
10646
10702
11353
11346
11451
11964
12574
13031
13812
14544
14931
14886
16005
17064
15168
16050
15839
15137
14954
15648
15305
15579
16348
15928
16171
15937
15713
15594
15683
16438
17032
17696
17745
19394


Summary of computational transaction
Raw Inputview raw input (R code)
Raw Outputview raw output of R engine
Computing time3 seconds
R Server'Herman Ole Andreas Wold' @ 193.190.124.10:1001

\begin{tabular}{lllllllll}
\hline
Summary of computational transaction \tabularnewline
Raw Input & view raw input (R code)  \tabularnewline
Raw Output & view raw output of R engine  \tabularnewline
Computing time & 3 seconds \tabularnewline
R Server & 'Herman Ole Andreas Wold' @ 193.190.124.10:1001 \tabularnewline
\hline
\end{tabular}
%Source: https://freestatistics.org/blog/index.php?pk=13336&T=0

[TABLE]
[ROW][C]Summary of computational transaction[/C][/ROW]
[ROW][C]Raw Input[/C][C]view raw input (R code) [/C][/ROW]
[ROW][C]Raw Output[/C][C]view raw output of R engine [/C][/ROW]
[ROW][C]Computing time[/C][C]3 seconds[/C][/ROW]
[ROW][C]R Server[/C][C]'Herman Ole Andreas Wold' @ 193.190.124.10:1001[/C][/ROW]
[/TABLE]
Source: https://freestatistics.org/blog/index.php?pk=13336&T=0

Globally Unique Identifier (entire table): ba.freestatistics.org/blog/index.php?pk=13336&T=0

As an alternative you can also use a QR Code:  

The GUIDs for individual cells are displayed in the table below:

Summary of computational transaction
Raw Inputview raw input (R code)
Raw Outputview raw output of R engine
Computing time3 seconds
R Server'Herman Ole Andreas Wold' @ 193.190.124.10:1001


Standard Deviation-Mean Plot
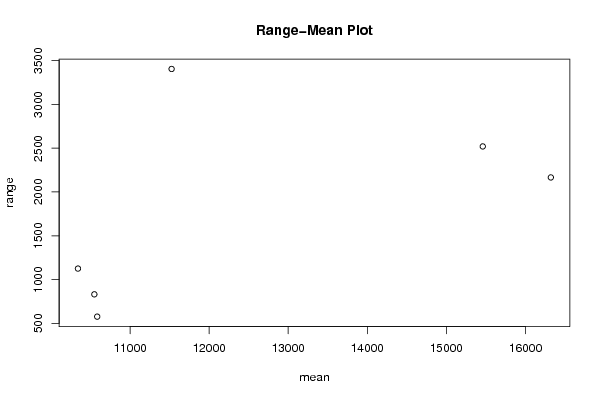
SectionMeanStandard DeviationRange
110548.4166666667316.826725896702831
210341418.4949223108931125
310584.4166666667202.975349301935576
411525.41666666671112.953683454603405
515460.9166666667695.1090768993592520
616322775.6835109056462166

\begin{tabular}{lllllllll}
\hline
Standard Deviation-Mean Plot \tabularnewline
Section & Mean & Standard Deviation & Range \tabularnewline
1 & 10548.4166666667 & 316.826725896702 & 831 \tabularnewline
2 & 10341 & 418.494922310893 & 1125 \tabularnewline
3 & 10584.4166666667 & 202.975349301935 & 576 \tabularnewline
4 & 11525.4166666667 & 1112.95368345460 & 3405 \tabularnewline
5 & 15460.9166666667 & 695.109076899359 & 2520 \tabularnewline
6 & 16322 & 775.683510905646 & 2166 \tabularnewline
\hline
\end{tabular}
%Source: https://freestatistics.org/blog/index.php?pk=13336&T=1

[TABLE]
[ROW][C]Standard Deviation-Mean Plot[/C][/ROW]
[ROW][C]Section[/C][C]Mean[/C][C]Standard Deviation[/C][C]Range[/C][/ROW]
[ROW][C]1[/C][C]10548.4166666667[/C][C]316.826725896702[/C][C]831[/C][/ROW]
[ROW][C]2[/C][C]10341[/C][C]418.494922310893[/C][C]1125[/C][/ROW]
[ROW][C]3[/C][C]10584.4166666667[/C][C]202.975349301935[/C][C]576[/C][/ROW]
[ROW][C]4[/C][C]11525.4166666667[/C][C]1112.95368345460[/C][C]3405[/C][/ROW]
[ROW][C]5[/C][C]15460.9166666667[/C][C]695.109076899359[/C][C]2520[/C][/ROW]
[ROW][C]6[/C][C]16322[/C][C]775.683510905646[/C][C]2166[/C][/ROW]
[/TABLE]
Source: https://freestatistics.org/blog/index.php?pk=13336&T=1

Globally Unique Identifier (entire table): ba.freestatistics.org/blog/index.php?pk=13336&T=1

As an alternative you can also use a QR Code:  

The GUIDs for individual cells are displayed in the table below:

Standard Deviation-Mean Plot
SectionMeanStandard DeviationRange
110548.4166666667316.826725896702831
210341418.4949223108931125
310584.4166666667202.975349301935576
411525.41666666671112.953683454603405
515460.9166666667695.1090768993592520
616322775.6835109056462166


Regression: S.E.(k) = alpha + beta * Mean(k)
alpha-149.875415175609
beta0.0591223276470475
S.D.0.0552631112693811
T-STAT1.06983349813322
p-value0.344956114216523

\begin{tabular}{lllllllll}
\hline
Regression: S.E.(k) = alpha + beta * Mean(k) \tabularnewline
alpha & -149.875415175609 \tabularnewline
beta & 0.0591223276470475 \tabularnewline
S.D. & 0.0552631112693811 \tabularnewline
T-STAT & 1.06983349813322 \tabularnewline
p-value & 0.344956114216523 \tabularnewline
\hline
\end{tabular}
%Source: https://freestatistics.org/blog/index.php?pk=13336&T=2

[TABLE]
[ROW][C]Regression: S.E.(k) = alpha + beta * Mean(k)[/C][/ROW]
[ROW][C]alpha[/C][C]-149.875415175609[/C][/ROW]
[ROW][C]beta[/C][C]0.0591223276470475[/C][/ROW]
[ROW][C]S.D.[/C][C]0.0552631112693811[/C][/ROW]
[ROW][C]T-STAT[/C][C]1.06983349813322[/C][/ROW]
[ROW][C]p-value[/C][C]0.344956114216523[/C][/ROW]
[/TABLE]
Source: https://freestatistics.org/blog/index.php?pk=13336&T=2

Globally Unique Identifier (entire table): ba.freestatistics.org/blog/index.php?pk=13336&T=2

As an alternative you can also use a QR Code:  

The GUIDs for individual cells are displayed in the table below:

Regression: S.E.(k) = alpha + beta * Mean(k)
alpha-149.875415175609
beta0.0591223276470475
S.D.0.0552631112693811
T-STAT1.06983349813322
p-value0.344956114216523


Regression: ln S.E.(k) = alpha + beta * ln Mean(k)
alpha-10.7778104114075
beta1.80593995648738
S.D.1.23633343030626
T-STAT1.46072241696159
p-value0.217883368672161
Lambda-0.805939956487375

\begin{tabular}{lllllllll}
\hline
Regression: ln S.E.(k) = alpha + beta * ln Mean(k) \tabularnewline
alpha & -10.7778104114075 \tabularnewline
beta & 1.80593995648738 \tabularnewline
S.D. & 1.23633343030626 \tabularnewline
T-STAT & 1.46072241696159 \tabularnewline
p-value & 0.217883368672161 \tabularnewline
Lambda & -0.805939956487375 \tabularnewline
\hline
\end{tabular}
%Source: https://freestatistics.org/blog/index.php?pk=13336&T=3

[TABLE]
[ROW][C]Regression: ln S.E.(k) = alpha + beta * ln Mean(k)[/C][/ROW]
[ROW][C]alpha[/C][C]-10.7778104114075[/C][/ROW]
[ROW][C]beta[/C][C]1.80593995648738[/C][/ROW]
[ROW][C]S.D.[/C][C]1.23633343030626[/C][/ROW]
[ROW][C]T-STAT[/C][C]1.46072241696159[/C][/ROW]
[ROW][C]p-value[/C][C]0.217883368672161[/C][/ROW]
[ROW][C]Lambda[/C][C]-0.805939956487375[/C][/ROW]
[/TABLE]
Source: https://freestatistics.org/blog/index.php?pk=13336&T=3

Globally Unique Identifier (entire table): ba.freestatistics.org/blog/index.php?pk=13336&T=3

As an alternative you can also use a QR Code:  

The GUIDs for individual cells are displayed in the table below:

Regression: ln S.E.(k) = alpha + beta * ln Mean(k)
alpha-10.7778104114075
beta1.80593995648738
S.D.1.23633343030626
T-STAT1.46072241696159
p-value0.217883368672161
Lambda-0.805939956487375


Parameters (Session):
par1 = 12 ;
Parameters (R input):
par1 = 12 ;
R code (references can be found in the software module):
par1 <- as.numeric(par1)
(n <- length(x))
(np <- floor(n / par1))
arr <- array(NA,dim=c(par1,np))
j <- 0
k <- 1
for (i in 1:(np*par1))
{
j = j + 1
arr[j,k] <- x[i]
if (j == par1) {
j = 0
k=k+1
}
}
arr
arr.mean <- array(NA,dim=np)
arr.sd <- array(NA,dim=np)
arr.range <- array(NA,dim=np)
for (j in 1:np)
{
arr.mean[j] <- mean(arr[,j],na.rm=TRUE)
arr.sd[j] <- sd(arr[,j],na.rm=TRUE)
arr.range[j] <- max(arr[,j],na.rm=TRUE) - min(arr[,j],na.rm=TRUE)
}
arr.mean
arr.sd
arr.range
(lm1 <- lm(arr.sd~arr.mean))
(lnlm1 <- lm(log(arr.sd)~log(arr.mean)))
(lm2 <- lm(arr.range~arr.mean))
bitmap(file='test1.png')
plot(arr.mean,arr.sd,main='Standard Deviation-Mean Plot',xlab='mean',ylab='standard deviation')
dev.off()
bitmap(file='test2.png')
plot(arr.mean,arr.range,main='Range-Mean Plot',xlab='mean',ylab='range')
dev.off()
load(file='createtable')
a<-table.start()
a<-table.row.start(a)
a<-table.element(a,'Standard Deviation-Mean Plot',4,TRUE)
a<-table.row.end(a)
a<-table.row.start(a)
a<-table.element(a,'Section',header=TRUE)
a<-table.element(a,'Mean',header=TRUE)
a<-table.element(a,'Standard Deviation',header=TRUE)
a<-table.element(a,'Range',header=TRUE)
a<-table.row.end(a)
for (j in 1:np) {
a<-table.row.start(a)
a<-table.element(a,j,header=TRUE)
a<-table.element(a,arr.mean[j])
a<-table.element(a,arr.sd[j] )
a<-table.element(a,arr.range[j] )
a<-table.row.end(a)
}
a<-table.end(a)
table.save(a,file='mytable.tab')
a<-table.start()
a<-table.row.start(a)
a<-table.element(a,'Regression: S.E.(k) = alpha + beta * Mean(k)',2,TRUE)
a<-table.row.end(a)
a<-table.row.start(a)
a<-table.element(a,'alpha',header=TRUE)
a<-table.element(a,lm1$coefficients[[1]])
a<-table.row.end(a)
a<-table.row.start(a)
a<-table.element(a,'beta',header=TRUE)
a<-table.element(a,lm1$coefficients[[2]])
a<-table.row.end(a)
a<-table.row.start(a)
a<-table.element(a,'S.D.',header=TRUE)
a<-table.element(a,summary(lm1)$coefficients[2,2])
a<-table.row.end(a)
a<-table.row.start(a)
a<-table.element(a,'T-STAT',header=TRUE)
a<-table.element(a,summary(lm1)$coefficients[2,3])
a<-table.row.end(a)
a<-table.row.start(a)
a<-table.element(a,'p-value',header=TRUE)
a<-table.element(a,summary(lm1)$coefficients[2,4])
a<-table.row.end(a)
a<-table.end(a)
table.save(a,file='mytable1.tab')
a<-table.start()
a<-table.row.start(a)
a<-table.element(a,'Regression: ln S.E.(k) = alpha + beta * ln Mean(k)',2,TRUE)
a<-table.row.end(a)
a<-table.row.start(a)
a<-table.element(a,'alpha',header=TRUE)
a<-table.element(a,lnlm1$coefficients[[1]])
a<-table.row.end(a)
a<-table.row.start(a)
a<-table.element(a,'beta',header=TRUE)
a<-table.element(a,lnlm1$coefficients[[2]])
a<-table.row.end(a)
a<-table.row.start(a)
a<-table.element(a,'S.D.',header=TRUE)
a<-table.element(a,summary(lnlm1)$coefficients[2,2])
a<-table.row.end(a)
a<-table.row.start(a)
a<-table.element(a,'T-STAT',header=TRUE)
a<-table.element(a,summary(lnlm1)$coefficients[2,3])
a<-table.row.end(a)
a<-table.row.start(a)
a<-table.element(a,'p-value',header=TRUE)
a<-table.element(a,summary(lnlm1)$coefficients[2,4])
a<-table.row.end(a)
a<-table.row.start(a)
a<-table.element(a,'Lambda',header=TRUE)
a<-table.element(a,1-lnlm1$coefficients[[2]])
a<-table.row.end(a)
a<-table.end(a)
table.save(a,file='mytable2.tab')