Free Statistics

of Irreproducible Research!

Author's title

Author*Unverified author*
R Software Modulerwasp_hierarchicalclustering.wasp
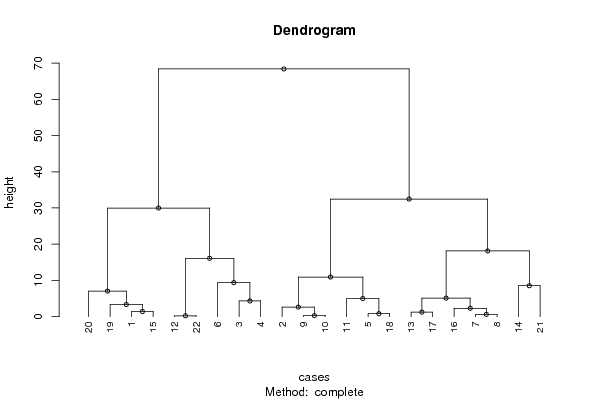
Title produced by softwareHierarchical Clustering
Date of computationThu, 15 May 2008 11:12:52 -0600
Cite this page as followsStatistical Computations at FreeStatistics.org, Office for Research Development and Education, URL https://freestatistics.org/blog/index.php?v=date/2008/May/15/t1210871657uakrx8kvahnmqqp.htm/, Retrieved Sun, 19 May 2024 19:19:28 +0000
Statistical Computations at FreeStatistics.org, Office for Research Development and Education, URL https://freestatistics.org/blog/index.php?pk=14699, Retrieved Sun, 19 May 2024 19:19:28 +0000
QR Codes:

Original text written by user:
IsPrivate?No (this computation is public)
User-defined keywords
Estimated Impact234
Family? (F = Feedback message, R = changed R code, M = changed R Module, P = changed Parameters, D = changed Data)
-       [Hierarchical Clustering] [Spend on Students...] [2008-05-15 17:12:52] [d998ff3a339f9318bd7b6e98912e4043] [Current]
Feedback Forum

Post a new message
Dataseries X:
73.984
35.406
56.333
60.659
42.885
65.733
29.362
28.736
32.770
33.083
38.694
49.624
24.242
19.762
72.555
27.042
25.485
43.700
75.901
79.611
11.229
49.873


Summary of computational transaction
Raw Inputview raw input (R code)
Raw Outputview raw output of R engine
Computing time23 seconds
R Server'George Udny Yule' @ 72.249.76.132

\begin{tabular}{lllllllll}
\hline
Summary of computational transaction \tabularnewline
Raw Input & view raw input (R code)  \tabularnewline
Raw Output & view raw output of R engine  \tabularnewline
Computing time & 23 seconds \tabularnewline
R Server & 'George Udny Yule' @ 72.249.76.132 \tabularnewline
\hline
\end{tabular}
%Source: https://freestatistics.org/blog/index.php?pk=14699&T=0

[TABLE]
[ROW][C]Summary of computational transaction[/C][/ROW]
[ROW][C]Raw Input[/C][C]view raw input (R code) [/C][/ROW]
[ROW][C]Raw Output[/C][C]view raw output of R engine [/C][/ROW]
[ROW][C]Computing time[/C][C]23 seconds[/C][/ROW]
[ROW][C]R Server[/C][C]'George Udny Yule' @ 72.249.76.132[/C][/ROW]
[/TABLE]
Source: https://freestatistics.org/blog/index.php?pk=14699&T=0

Globally Unique Identifier (entire table): ba.freestatistics.org/blog/index.php?pk=14699&T=0

As an alternative you can also use a QR Code:  

The GUIDs for individual cells are displayed in the table below:

Summary of computational transaction
Raw Inputview raw input (R code)
Raw Outputview raw output of R engine
Computing time23 seconds
R Server'George Udny Yule' @ 72.249.76.132


Summary of Dendrogram
LabelHeight
10.248999999999995
20.312999999999995
30.625999999999998
40.815000000000005
51.24300000000000
61.42899999999999
72.32000000000000
82.63600000000000
93.34599999999999
104.326
115.006
125.12
137.056
148.533
159.4
1610.93
1716.109
1818.133
1929.987
2032.471
2168.382

\begin{tabular}{lllllllll}
\hline
Summary of Dendrogram \tabularnewline
Label & Height \tabularnewline
1 & 0.248999999999995 \tabularnewline
2 & 0.312999999999995 \tabularnewline
3 & 0.625999999999998 \tabularnewline
4 & 0.815000000000005 \tabularnewline
5 & 1.24300000000000 \tabularnewline
6 & 1.42899999999999 \tabularnewline
7 & 2.32000000000000 \tabularnewline
8 & 2.63600000000000 \tabularnewline
9 & 3.34599999999999 \tabularnewline
10 & 4.326 \tabularnewline
11 & 5.006 \tabularnewline
12 & 5.12 \tabularnewline
13 & 7.056 \tabularnewline
14 & 8.533 \tabularnewline
15 & 9.4 \tabularnewline
16 & 10.93 \tabularnewline
17 & 16.109 \tabularnewline
18 & 18.133 \tabularnewline
19 & 29.987 \tabularnewline
20 & 32.471 \tabularnewline
21 & 68.382 \tabularnewline
\hline
\end{tabular}
%Source: https://freestatistics.org/blog/index.php?pk=14699&T=1

[TABLE]
[ROW][C]Summary of Dendrogram[/C][/ROW]
[ROW][C]Label[/C][C]Height[/C][/ROW]
[ROW][C]1[/C][C]0.248999999999995[/C][/ROW]
[ROW][C]2[/C][C]0.312999999999995[/C][/ROW]
[ROW][C]3[/C][C]0.625999999999998[/C][/ROW]
[ROW][C]4[/C][C]0.815000000000005[/C][/ROW]
[ROW][C]5[/C][C]1.24300000000000[/C][/ROW]
[ROW][C]6[/C][C]1.42899999999999[/C][/ROW]
[ROW][C]7[/C][C]2.32000000000000[/C][/ROW]
[ROW][C]8[/C][C]2.63600000000000[/C][/ROW]
[ROW][C]9[/C][C]3.34599999999999[/C][/ROW]
[ROW][C]10[/C][C]4.326[/C][/ROW]
[ROW][C]11[/C][C]5.006[/C][/ROW]
[ROW][C]12[/C][C]5.12[/C][/ROW]
[ROW][C]13[/C][C]7.056[/C][/ROW]
[ROW][C]14[/C][C]8.533[/C][/ROW]
[ROW][C]15[/C][C]9.4[/C][/ROW]
[ROW][C]16[/C][C]10.93[/C][/ROW]
[ROW][C]17[/C][C]16.109[/C][/ROW]
[ROW][C]18[/C][C]18.133[/C][/ROW]
[ROW][C]19[/C][C]29.987[/C][/ROW]
[ROW][C]20[/C][C]32.471[/C][/ROW]
[ROW][C]21[/C][C]68.382[/C][/ROW]
[/TABLE]
Source: https://freestatistics.org/blog/index.php?pk=14699&T=1

Globally Unique Identifier (entire table): ba.freestatistics.org/blog/index.php?pk=14699&T=1

As an alternative you can also use a QR Code:  

The GUIDs for individual cells are displayed in the table below:

Summary of Dendrogram
LabelHeight
10.248999999999995
20.312999999999995
30.625999999999998
40.815000000000005
51.24300000000000
61.42899999999999
72.32000000000000
82.63600000000000
93.34599999999999
104.326
115.006
125.12
137.056
148.533
159.4
1610.93
1716.109
1818.133
1929.987
2032.471
2168.382


Parameters (Session):
Parameters (R input):
par1 = complete ; par2 = ALL ; par3 = FALSE ; par4 = FALSE ;
R code (references can be found in the software module):
par3 <- as.logical(par3)
par4 <- as.logical(par4)
if (par3 == 'TRUE'){
dum = xlab
xlab = ylab
ylab = dum
}
x <- t(y)
hc <- hclust(dist(x),method=par1)
d <- as.dendrogram(hc)
str(d)
mysub <- paste('Method: ',par1)
bitmap(file='test1.png')
if (par4 == 'TRUE'){
plot(d,main=main,ylab=ylab,xlab=xlab,horiz=par3, nodePar=list(pch = c(1,NA), cex=0.8, lab.cex = 0.8),type='t',center=T, sub=mysub)
} else {
plot(d,main=main,ylab=ylab,xlab=xlab,horiz=par3, nodePar=list(pch = c(1,NA), cex=0.8, lab.cex = 0.8), sub=mysub)
}
dev.off()
if (par2 != 'ALL'){
if (par3 == 'TRUE'){
ylab = 'cluster'
} else {
xlab = 'cluster'
}
par2 <- as.numeric(par2)
memb <- cutree(hc, k = par2)
cent <- NULL
for(k in 1:par2){
cent <- rbind(cent, colMeans(x[memb == k, , drop = FALSE]))
}
hc1 <- hclust(dist(cent),method=par1, members = table(memb))
de <- as.dendrogram(hc1)
bitmap(file='test2.png')
if (par4 == 'TRUE'){
plot(de,main=main,ylab=ylab,xlab=xlab,horiz=par3, nodePar=list(pch = c(1,NA), cex=0.8, lab.cex = 0.8),type='t',center=T, sub=mysub)
} else {
plot(de,main=main,ylab=ylab,xlab=xlab,horiz=par3, nodePar=list(pch = c(1,NA), cex=0.8, lab.cex = 0.8), sub=mysub)
}
dev.off()
str(de)
}
load(file='createtable')
a<-table.start()
a<-table.row.start(a)
a<-table.element(a,'Summary of Dendrogram',2,TRUE)
a<-table.row.end(a)
a<-table.row.start(a)
a<-table.element(a,'Label',header=TRUE)
a<-table.element(a,'Height',header=TRUE)
a<-table.row.end(a)
num <- length(x[,1])-1
for (i in 1:num)
{
a<-table.row.start(a)
a<-table.element(a,hc$labels[i])
a<-table.element(a,hc$height[i])
a<-table.row.end(a)
}
a<-table.end(a)
table.save(a,file='mytable1.tab')
if (par2 != 'ALL'){
a<-table.start()
a<-table.row.start(a)
a<-table.element(a,'Summary of Cut Dendrogram',2,TRUE)
a<-table.row.end(a)
a<-table.row.start(a)
a<-table.element(a,'Label',header=TRUE)
a<-table.element(a,'Height',header=TRUE)
a<-table.row.end(a)
num <- par2-1
for (i in 1:num)
{
a<-table.row.start(a)
a<-table.element(a,i)
a<-table.element(a,hc1$height[i])
a<-table.row.end(a)
}
a<-table.end(a)
table.save(a,file='mytable2.tab')
}