Free Statistics

of Irreproducible Research!

Author's title

Author*Unverified author*
R Software Modulerwasp_exponentialsmoothing.wasp
Title produced by softwareExponential Smoothing
Date of computationMon, 02 Jun 2008 02:08:19 -0600
Cite this page as followsStatistical Computations at FreeStatistics.org, Office for Research Development and Education, URL https://freestatistics.org/blog/index.php?v=date/2008/Jun/02/t1212394134e8brzgr32lt597f.htm/, Retrieved Sat, 18 May 2024 16:22:12 +0000
Statistical Computations at FreeStatistics.org, Office for Research Development and Education, URL https://freestatistics.org/blog/index.php?pk=13764, Retrieved Sat, 18 May 2024 16:22:12 +0000
QR Codes:

Original text written by user:
IsPrivate?No (this computation is public)
User-defined keywords
Estimated Impact320
Family? (F = Feedback message, R = changed R code, M = changed R Module, P = changed Parameters, D = changed Data)
-     [Exponential Smoothing] [Opgave 10: Inschr...] [2008-05-26 23:51:15] [5a9957222b47d6f610c4aa164db8acb4]
-   PD    [Exponential Smoothing] [Verbetering opgav...] [2008-06-02 08:08:19] [d41d8cd98f00b204e9800998ecf8427e] [Current]
Feedback Forum

Post a new message
Dataseries X:
10236
10893
10756
10940
10997
10827
10166
10186
10457
10368
10244
10511
10812
10738
10171
9721
9897
9828
9924
10371
10846
10413
10709
10662
10570
10297
10635
10872
10296
10383
10431
10574
10653
10805
10872
10625
10407
10463
10556
10646
10702
11353
11346
11451
11964
12574
13031
13812
14544
14931
14886
16005
17064
15168
16050
15839
15137
14954
15648
15305
15579
16348
15928
16171
15937
15713
15594
15683
16438
17032
17696
17745
19394


Summary of computational transaction
Raw Inputview raw input (R code)
Raw Outputview raw output of R engine
Computing time2 seconds
R Server'Sir Ronald Aylmer Fisher' @ 193.190.124.24

\begin{tabular}{lllllllll}
\hline
Summary of computational transaction \tabularnewline
Raw Input & view raw input (R code)  \tabularnewline
Raw Output & view raw output of R engine  \tabularnewline
Computing time & 2 seconds \tabularnewline
R Server & 'Sir Ronald Aylmer Fisher' @ 193.190.124.24 \tabularnewline
\hline
\end{tabular}
%Source: https://freestatistics.org/blog/index.php?pk=13764&T=0

[TABLE]
[ROW][C]Summary of computational transaction[/C][/ROW]
[ROW][C]Raw Input[/C][C]view raw input (R code) [/C][/ROW]
[ROW][C]Raw Output[/C][C]view raw output of R engine [/C][/ROW]
[ROW][C]Computing time[/C][C]2 seconds[/C][/ROW]
[ROW][C]R Server[/C][C]'Sir Ronald Aylmer Fisher' @ 193.190.124.24[/C][/ROW]
[/TABLE]
Source: https://freestatistics.org/blog/index.php?pk=13764&T=0

Globally Unique Identifier (entire table): ba.freestatistics.org/blog/index.php?pk=13764&T=0

As an alternative you can also use a QR Code:  

The GUIDs for individual cells are displayed in the table below:

Summary of computational transaction
Raw Inputview raw input (R code)
Raw Outputview raw output of R engine
Computing time2 seconds
R Server'Sir Ronald Aylmer Fisher' @ 193.190.124.24


Estimated Parameters of Exponential Smoothing
ParameterValue
alpha0.914427070243967
beta0.0344554406262715
gamma1

\begin{tabular}{lllllllll}
\hline
Estimated Parameters of Exponential Smoothing \tabularnewline
Parameter & Value \tabularnewline
alpha & 0.914427070243967 \tabularnewline
beta & 0.0344554406262715 \tabularnewline
gamma & 1 \tabularnewline
\hline
\end{tabular}
%Source: https://freestatistics.org/blog/index.php?pk=13764&T=1

[TABLE]
[ROW][C]Estimated Parameters of Exponential Smoothing[/C][/ROW]
[ROW][C]Parameter[/C][C]Value[/C][/ROW]
[ROW][C]alpha[/C][C]0.914427070243967[/C][/ROW]
[ROW][C]beta[/C][C]0.0344554406262715[/C][/ROW]
[ROW][C]gamma[/C][C]1[/C][/ROW]
[/TABLE]
Source: https://freestatistics.org/blog/index.php?pk=13764&T=1

Globally Unique Identifier (entire table): ba.freestatistics.org/blog/index.php?pk=13764&T=1

As an alternative you can also use a QR Code:  

The GUIDs for individual cells are displayed in the table below:

Estimated Parameters of Exponential Smoothing
ParameterValue
alpha0.914427070243967
beta0.0344554406262715
gamma1


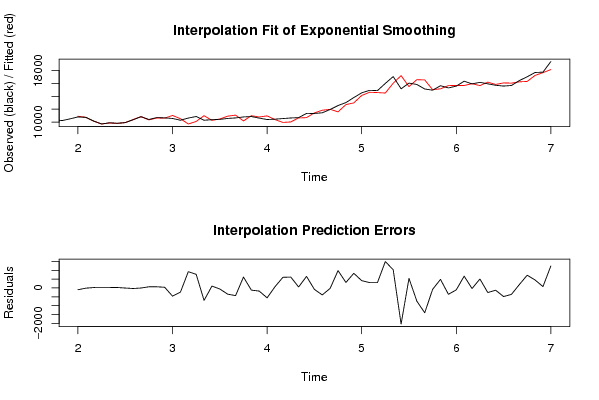
Interpolation Forecasts of Exponential Smoothing
tObservedFittedResiduals
131081210914.545-102.545000000002
141073810750.8917282676-12.8917282676284
151017110149.521988953621.4780110464035
1697219703.0909104271517.9090895728496
1798979876.793908290620.2060917093950
1898289803.817313502924.1826864970917
1999249929.69728157403-5.6972815740337
201037110403.7413604695-32.7413604695084
211084610850.6073532273-4.60735322731671
221041310348.721346647464.2786533526305
231070910643.560129314265.4398706857501
241066210623.355907074238.6440929257624
251057011034.7163831580-464.71638315804
261029710539.0955696924-242.095569692427
27106359715.39511183796919.604888162043
281087210102.5457909711769.454209028861
291029610999.9731063343-703.973106334326
301038310278.6055875396104.394412460400
311043110491.2814921564-60.2814921563568
321057410927.3833455591-353.383345559088
331065311087.6359689984-434.635968998438
341080510189.0488585829615.951141417059
351087210996.4667312719-124.466731271887
361062510802.3458574756-177.345857475637
371040710968.3521319551-561.352131955147
381046310395.597474332867.4025256671957
39105569956.25410266609599.745897333911
401064610029.9239730652616.076026934777
411070210648.035894751753.9641052483403
421135310699.8246351958653.17536480418
431134611428.4229118461-82.4229118460953
441145111846.6928711565-395.692871156501
451196411987.4668520811-23.4668520810756
461257411593.8837879629980.116212037108
471303112721.5361353658309.463864634223
481381212983.9517719481828.04822805195
491454414132.3976601841411.602339815858
501493114629.7387399561301.261260043888
511488614583.7599439579302.240056042145
521600514511.36996008881493.63003991117
531706416036.07866981201027.92133018804
541516817212.6821902173-2044.68219021730
551605015509.2634878286540.736512171443
561583916588.1180421682-749.118042168222
571513716543.9857647608-1406.98576476078
581495415033.9873988450-79.9873988449799
591564815164.2942507298483.705749270222
601530515665.3396333509-360.339633350886
611557915688.9339414398-109.933941439775
621634815680.9728258988667.027174101157
631592815962.1151315066-34.1151315065963
641617115666.077141574504.922858425996
651593716197.6555476122-260.655547612248
661571315843.2409942166-130.240994216649
671559416082.2224644933-488.222464493265
681568316047.9145111236-364.914511123585
691643816249.0398383683188.960161631661
701703216312.4833804945719.516619505546
711769617247.8157992586448.184200741394
721774517668.733278663376.2667213367349
731939418151.33775479121242.66224520878

\begin{tabular}{lllllllll}
\hline
Interpolation Forecasts of Exponential Smoothing \tabularnewline
t & Observed & Fitted & Residuals \tabularnewline
13 & 10812 & 10914.545 & -102.545000000002 \tabularnewline
14 & 10738 & 10750.8917282676 & -12.8917282676284 \tabularnewline
15 & 10171 & 10149.5219889536 & 21.4780110464035 \tabularnewline
16 & 9721 & 9703.09091042715 & 17.9090895728496 \tabularnewline
17 & 9897 & 9876.7939082906 & 20.2060917093950 \tabularnewline
18 & 9828 & 9803.8173135029 & 24.1826864970917 \tabularnewline
19 & 9924 & 9929.69728157403 & -5.6972815740337 \tabularnewline
20 & 10371 & 10403.7413604695 & -32.7413604695084 \tabularnewline
21 & 10846 & 10850.6073532273 & -4.60735322731671 \tabularnewline
22 & 10413 & 10348.7213466474 & 64.2786533526305 \tabularnewline
23 & 10709 & 10643.5601293142 & 65.4398706857501 \tabularnewline
24 & 10662 & 10623.3559070742 & 38.6440929257624 \tabularnewline
25 & 10570 & 11034.7163831580 & -464.71638315804 \tabularnewline
26 & 10297 & 10539.0955696924 & -242.095569692427 \tabularnewline
27 & 10635 & 9715.39511183796 & 919.604888162043 \tabularnewline
28 & 10872 & 10102.5457909711 & 769.454209028861 \tabularnewline
29 & 10296 & 10999.9731063343 & -703.973106334326 \tabularnewline
30 & 10383 & 10278.6055875396 & 104.394412460400 \tabularnewline
31 & 10431 & 10491.2814921564 & -60.2814921563568 \tabularnewline
32 & 10574 & 10927.3833455591 & -353.383345559088 \tabularnewline
33 & 10653 & 11087.6359689984 & -434.635968998438 \tabularnewline
34 & 10805 & 10189.0488585829 & 615.951141417059 \tabularnewline
35 & 10872 & 10996.4667312719 & -124.466731271887 \tabularnewline
36 & 10625 & 10802.3458574756 & -177.345857475637 \tabularnewline
37 & 10407 & 10968.3521319551 & -561.352131955147 \tabularnewline
38 & 10463 & 10395.5974743328 & 67.4025256671957 \tabularnewline
39 & 10556 & 9956.25410266609 & 599.745897333911 \tabularnewline
40 & 10646 & 10029.9239730652 & 616.076026934777 \tabularnewline
41 & 10702 & 10648.0358947517 & 53.9641052483403 \tabularnewline
42 & 11353 & 10699.8246351958 & 653.17536480418 \tabularnewline
43 & 11346 & 11428.4229118461 & -82.4229118460953 \tabularnewline
44 & 11451 & 11846.6928711565 & -395.692871156501 \tabularnewline
45 & 11964 & 11987.4668520811 & -23.4668520810756 \tabularnewline
46 & 12574 & 11593.8837879629 & 980.116212037108 \tabularnewline
47 & 13031 & 12721.5361353658 & 309.463864634223 \tabularnewline
48 & 13812 & 12983.9517719481 & 828.04822805195 \tabularnewline
49 & 14544 & 14132.3976601841 & 411.602339815858 \tabularnewline
50 & 14931 & 14629.7387399561 & 301.261260043888 \tabularnewline
51 & 14886 & 14583.7599439579 & 302.240056042145 \tabularnewline
52 & 16005 & 14511.3699600888 & 1493.63003991117 \tabularnewline
53 & 17064 & 16036.0786698120 & 1027.92133018804 \tabularnewline
54 & 15168 & 17212.6821902173 & -2044.68219021730 \tabularnewline
55 & 16050 & 15509.2634878286 & 540.736512171443 \tabularnewline
56 & 15839 & 16588.1180421682 & -749.118042168222 \tabularnewline
57 & 15137 & 16543.9857647608 & -1406.98576476078 \tabularnewline
58 & 14954 & 15033.9873988450 & -79.9873988449799 \tabularnewline
59 & 15648 & 15164.2942507298 & 483.705749270222 \tabularnewline
60 & 15305 & 15665.3396333509 & -360.339633350886 \tabularnewline
61 & 15579 & 15688.9339414398 & -109.933941439775 \tabularnewline
62 & 16348 & 15680.9728258988 & 667.027174101157 \tabularnewline
63 & 15928 & 15962.1151315066 & -34.1151315065963 \tabularnewline
64 & 16171 & 15666.077141574 & 504.922858425996 \tabularnewline
65 & 15937 & 16197.6555476122 & -260.655547612248 \tabularnewline
66 & 15713 & 15843.2409942166 & -130.240994216649 \tabularnewline
67 & 15594 & 16082.2224644933 & -488.222464493265 \tabularnewline
68 & 15683 & 16047.9145111236 & -364.914511123585 \tabularnewline
69 & 16438 & 16249.0398383683 & 188.960161631661 \tabularnewline
70 & 17032 & 16312.4833804945 & 719.516619505546 \tabularnewline
71 & 17696 & 17247.8157992586 & 448.184200741394 \tabularnewline
72 & 17745 & 17668.7332786633 & 76.2667213367349 \tabularnewline
73 & 19394 & 18151.3377547912 & 1242.66224520878 \tabularnewline
\hline
\end{tabular}
%Source: https://freestatistics.org/blog/index.php?pk=13764&T=2

[TABLE]
[ROW][C]Interpolation Forecasts of Exponential Smoothing[/C][/ROW]
[ROW][C]t[/C][C]Observed[/C][C]Fitted[/C][C]Residuals[/C][/ROW]
[ROW][C]13[/C][C]10812[/C][C]10914.545[/C][C]-102.545000000002[/C][/ROW]
[ROW][C]14[/C][C]10738[/C][C]10750.8917282676[/C][C]-12.8917282676284[/C][/ROW]
[ROW][C]15[/C][C]10171[/C][C]10149.5219889536[/C][C]21.4780110464035[/C][/ROW]
[ROW][C]16[/C][C]9721[/C][C]9703.09091042715[/C][C]17.9090895728496[/C][/ROW]
[ROW][C]17[/C][C]9897[/C][C]9876.7939082906[/C][C]20.2060917093950[/C][/ROW]
[ROW][C]18[/C][C]9828[/C][C]9803.8173135029[/C][C]24.1826864970917[/C][/ROW]
[ROW][C]19[/C][C]9924[/C][C]9929.69728157403[/C][C]-5.6972815740337[/C][/ROW]
[ROW][C]20[/C][C]10371[/C][C]10403.7413604695[/C][C]-32.7413604695084[/C][/ROW]
[ROW][C]21[/C][C]10846[/C][C]10850.6073532273[/C][C]-4.60735322731671[/C][/ROW]
[ROW][C]22[/C][C]10413[/C][C]10348.7213466474[/C][C]64.2786533526305[/C][/ROW]
[ROW][C]23[/C][C]10709[/C][C]10643.5601293142[/C][C]65.4398706857501[/C][/ROW]
[ROW][C]24[/C][C]10662[/C][C]10623.3559070742[/C][C]38.6440929257624[/C][/ROW]
[ROW][C]25[/C][C]10570[/C][C]11034.7163831580[/C][C]-464.71638315804[/C][/ROW]
[ROW][C]26[/C][C]10297[/C][C]10539.0955696924[/C][C]-242.095569692427[/C][/ROW]
[ROW][C]27[/C][C]10635[/C][C]9715.39511183796[/C][C]919.604888162043[/C][/ROW]
[ROW][C]28[/C][C]10872[/C][C]10102.5457909711[/C][C]769.454209028861[/C][/ROW]
[ROW][C]29[/C][C]10296[/C][C]10999.9731063343[/C][C]-703.973106334326[/C][/ROW]
[ROW][C]30[/C][C]10383[/C][C]10278.6055875396[/C][C]104.394412460400[/C][/ROW]
[ROW][C]31[/C][C]10431[/C][C]10491.2814921564[/C][C]-60.2814921563568[/C][/ROW]
[ROW][C]32[/C][C]10574[/C][C]10927.3833455591[/C][C]-353.383345559088[/C][/ROW]
[ROW][C]33[/C][C]10653[/C][C]11087.6359689984[/C][C]-434.635968998438[/C][/ROW]
[ROW][C]34[/C][C]10805[/C][C]10189.0488585829[/C][C]615.951141417059[/C][/ROW]
[ROW][C]35[/C][C]10872[/C][C]10996.4667312719[/C][C]-124.466731271887[/C][/ROW]
[ROW][C]36[/C][C]10625[/C][C]10802.3458574756[/C][C]-177.345857475637[/C][/ROW]
[ROW][C]37[/C][C]10407[/C][C]10968.3521319551[/C][C]-561.352131955147[/C][/ROW]
[ROW][C]38[/C][C]10463[/C][C]10395.5974743328[/C][C]67.4025256671957[/C][/ROW]
[ROW][C]39[/C][C]10556[/C][C]9956.25410266609[/C][C]599.745897333911[/C][/ROW]
[ROW][C]40[/C][C]10646[/C][C]10029.9239730652[/C][C]616.076026934777[/C][/ROW]
[ROW][C]41[/C][C]10702[/C][C]10648.0358947517[/C][C]53.9641052483403[/C][/ROW]
[ROW][C]42[/C][C]11353[/C][C]10699.8246351958[/C][C]653.17536480418[/C][/ROW]
[ROW][C]43[/C][C]11346[/C][C]11428.4229118461[/C][C]-82.4229118460953[/C][/ROW]
[ROW][C]44[/C][C]11451[/C][C]11846.6928711565[/C][C]-395.692871156501[/C][/ROW]
[ROW][C]45[/C][C]11964[/C][C]11987.4668520811[/C][C]-23.4668520810756[/C][/ROW]
[ROW][C]46[/C][C]12574[/C][C]11593.8837879629[/C][C]980.116212037108[/C][/ROW]
[ROW][C]47[/C][C]13031[/C][C]12721.5361353658[/C][C]309.463864634223[/C][/ROW]
[ROW][C]48[/C][C]13812[/C][C]12983.9517719481[/C][C]828.04822805195[/C][/ROW]
[ROW][C]49[/C][C]14544[/C][C]14132.3976601841[/C][C]411.602339815858[/C][/ROW]
[ROW][C]50[/C][C]14931[/C][C]14629.7387399561[/C][C]301.261260043888[/C][/ROW]
[ROW][C]51[/C][C]14886[/C][C]14583.7599439579[/C][C]302.240056042145[/C][/ROW]
[ROW][C]52[/C][C]16005[/C][C]14511.3699600888[/C][C]1493.63003991117[/C][/ROW]
[ROW][C]53[/C][C]17064[/C][C]16036.0786698120[/C][C]1027.92133018804[/C][/ROW]
[ROW][C]54[/C][C]15168[/C][C]17212.6821902173[/C][C]-2044.68219021730[/C][/ROW]
[ROW][C]55[/C][C]16050[/C][C]15509.2634878286[/C][C]540.736512171443[/C][/ROW]
[ROW][C]56[/C][C]15839[/C][C]16588.1180421682[/C][C]-749.118042168222[/C][/ROW]
[ROW][C]57[/C][C]15137[/C][C]16543.9857647608[/C][C]-1406.98576476078[/C][/ROW]
[ROW][C]58[/C][C]14954[/C][C]15033.9873988450[/C][C]-79.9873988449799[/C][/ROW]
[ROW][C]59[/C][C]15648[/C][C]15164.2942507298[/C][C]483.705749270222[/C][/ROW]
[ROW][C]60[/C][C]15305[/C][C]15665.3396333509[/C][C]-360.339633350886[/C][/ROW]
[ROW][C]61[/C][C]15579[/C][C]15688.9339414398[/C][C]-109.933941439775[/C][/ROW]
[ROW][C]62[/C][C]16348[/C][C]15680.9728258988[/C][C]667.027174101157[/C][/ROW]
[ROW][C]63[/C][C]15928[/C][C]15962.1151315066[/C][C]-34.1151315065963[/C][/ROW]
[ROW][C]64[/C][C]16171[/C][C]15666.077141574[/C][C]504.922858425996[/C][/ROW]
[ROW][C]65[/C][C]15937[/C][C]16197.6555476122[/C][C]-260.655547612248[/C][/ROW]
[ROW][C]66[/C][C]15713[/C][C]15843.2409942166[/C][C]-130.240994216649[/C][/ROW]
[ROW][C]67[/C][C]15594[/C][C]16082.2224644933[/C][C]-488.222464493265[/C][/ROW]
[ROW][C]68[/C][C]15683[/C][C]16047.9145111236[/C][C]-364.914511123585[/C][/ROW]
[ROW][C]69[/C][C]16438[/C][C]16249.0398383683[/C][C]188.960161631661[/C][/ROW]
[ROW][C]70[/C][C]17032[/C][C]16312.4833804945[/C][C]719.516619505546[/C][/ROW]
[ROW][C]71[/C][C]17696[/C][C]17247.8157992586[/C][C]448.184200741394[/C][/ROW]
[ROW][C]72[/C][C]17745[/C][C]17668.7332786633[/C][C]76.2667213367349[/C][/ROW]
[ROW][C]73[/C][C]19394[/C][C]18151.3377547912[/C][C]1242.66224520878[/C][/ROW]
[/TABLE]
Source: https://freestatistics.org/blog/index.php?pk=13764&T=2

Globally Unique Identifier (entire table): ba.freestatistics.org/blog/index.php?pk=13764&T=2

As an alternative you can also use a QR Code:  

The GUIDs for individual cells are displayed in the table below:

Interpolation Forecasts of Exponential Smoothing
tObservedFittedResiduals
131081210914.545-102.545000000002
141073810750.8917282676-12.8917282676284
151017110149.521988953621.4780110464035
1697219703.0909104271517.9090895728496
1798979876.793908290620.2060917093950
1898289803.817313502924.1826864970917
1999249929.69728157403-5.6972815740337
201037110403.7413604695-32.7413604695084
211084610850.6073532273-4.60735322731671
221041310348.721346647464.2786533526305
231070910643.560129314265.4398706857501
241066210623.355907074238.6440929257624
251057011034.7163831580-464.71638315804
261029710539.0955696924-242.095569692427
27106359715.39511183796919.604888162043
281087210102.5457909711769.454209028861
291029610999.9731063343-703.973106334326
301038310278.6055875396104.394412460400
311043110491.2814921564-60.2814921563568
321057410927.3833455591-353.383345559088
331065311087.6359689984-434.635968998438
341080510189.0488585829615.951141417059
351087210996.4667312719-124.466731271887
361062510802.3458574756-177.345857475637
371040710968.3521319551-561.352131955147
381046310395.597474332867.4025256671957
39105569956.25410266609599.745897333911
401064610029.9239730652616.076026934777
411070210648.035894751753.9641052483403
421135310699.8246351958653.17536480418
431134611428.4229118461-82.4229118460953
441145111846.6928711565-395.692871156501
451196411987.4668520811-23.4668520810756
461257411593.8837879629980.116212037108
471303112721.5361353658309.463864634223
481381212983.9517719481828.04822805195
491454414132.3976601841411.602339815858
501493114629.7387399561301.261260043888
511488614583.7599439579302.240056042145
521600514511.36996008881493.63003991117
531706416036.07866981201027.92133018804
541516817212.6821902173-2044.68219021730
551605015509.2634878286540.736512171443
561583916588.1180421682-749.118042168222
571513716543.9857647608-1406.98576476078
581495415033.9873988450-79.9873988449799
591564815164.2942507298483.705749270222
601530515665.3396333509-360.339633350886
611557915688.9339414398-109.933941439775
621634815680.9728258988667.027174101157
631592815962.1151315066-34.1151315065963
641617115666.077141574504.922858425996
651593716197.6555476122-260.655547612248
661571315843.2409942166-130.240994216649
671559416082.2224644933-488.222464493265
681568316047.9145111236-364.914511123585
691643816249.0398383683188.960161631661
701703216312.4833804945719.516619505546
711769617247.8157992586448.184200741394
721774517668.733278663376.2667213367349
731939418151.33775479121242.66224520878


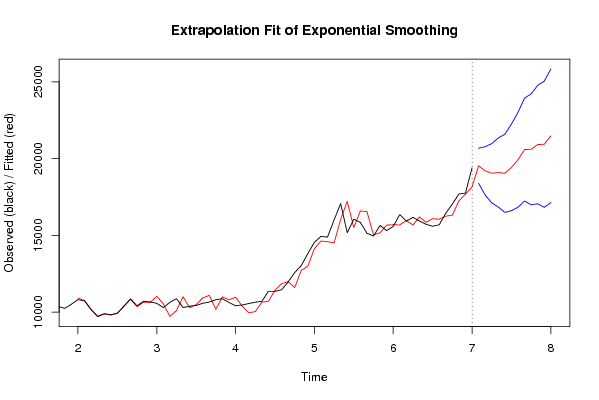
Extrapolation Forecasts of Exponential Smoothing
tForecast95% Lower Bound95% Upper Bound
7419527.667827297118384.671897144120670.6637574501
7519198.801391034417625.451304554420772.1514775144
7619041.098889913717111.437982088820970.7597977386
7719090.553409416116842.550818230521338.5560006017
7819038.965802053116495.779303397721582.1523007085
7919423.829643149916600.882468647122246.7768176526
8019919.319772856516827.425696534423011.2138491786
8120585.829265259717232.811813116323938.846717403
8220600.230004815916991.854235092324208.6057745394
8320910.074651897517050.624983538824769.5243202562
8420930.889775976716823.549035847725038.2305161057
8521482.718323770617129.827547026425835.6091005148

\begin{tabular}{lllllllll}
\hline
Extrapolation Forecasts of Exponential Smoothing \tabularnewline
t & Forecast & 95% Lower Bound & 95% Upper Bound \tabularnewline
74 & 19527.6678272971 & 18384.6718971441 & 20670.6637574501 \tabularnewline
75 & 19198.8013910344 & 17625.4513045544 & 20772.1514775144 \tabularnewline
76 & 19041.0988899137 & 17111.4379820888 & 20970.7597977386 \tabularnewline
77 & 19090.5534094161 & 16842.5508182305 & 21338.5560006017 \tabularnewline
78 & 19038.9658020531 & 16495.7793033977 & 21582.1523007085 \tabularnewline
79 & 19423.8296431499 & 16600.8824686471 & 22246.7768176526 \tabularnewline
80 & 19919.3197728565 & 16827.4256965344 & 23011.2138491786 \tabularnewline
81 & 20585.8292652597 & 17232.8118131163 & 23938.846717403 \tabularnewline
82 & 20600.2300048159 & 16991.8542350923 & 24208.6057745394 \tabularnewline
83 & 20910.0746518975 & 17050.6249835388 & 24769.5243202562 \tabularnewline
84 & 20930.8897759767 & 16823.5490358477 & 25038.2305161057 \tabularnewline
85 & 21482.7183237706 & 17129.8275470264 & 25835.6091005148 \tabularnewline
\hline
\end{tabular}
%Source: https://freestatistics.org/blog/index.php?pk=13764&T=3

[TABLE]
[ROW][C]Extrapolation Forecasts of Exponential Smoothing[/C][/ROW]
[ROW][C]t[/C][C]Forecast[/C][C]95% Lower Bound[/C][C]95% Upper Bound[/C][/ROW]
[ROW][C]74[/C][C]19527.6678272971[/C][C]18384.6718971441[/C][C]20670.6637574501[/C][/ROW]
[ROW][C]75[/C][C]19198.8013910344[/C][C]17625.4513045544[/C][C]20772.1514775144[/C][/ROW]
[ROW][C]76[/C][C]19041.0988899137[/C][C]17111.4379820888[/C][C]20970.7597977386[/C][/ROW]
[ROW][C]77[/C][C]19090.5534094161[/C][C]16842.5508182305[/C][C]21338.5560006017[/C][/ROW]
[ROW][C]78[/C][C]19038.9658020531[/C][C]16495.7793033977[/C][C]21582.1523007085[/C][/ROW]
[ROW][C]79[/C][C]19423.8296431499[/C][C]16600.8824686471[/C][C]22246.7768176526[/C][/ROW]
[ROW][C]80[/C][C]19919.3197728565[/C][C]16827.4256965344[/C][C]23011.2138491786[/C][/ROW]
[ROW][C]81[/C][C]20585.8292652597[/C][C]17232.8118131163[/C][C]23938.846717403[/C][/ROW]
[ROW][C]82[/C][C]20600.2300048159[/C][C]16991.8542350923[/C][C]24208.6057745394[/C][/ROW]
[ROW][C]83[/C][C]20910.0746518975[/C][C]17050.6249835388[/C][C]24769.5243202562[/C][/ROW]
[ROW][C]84[/C][C]20930.8897759767[/C][C]16823.5490358477[/C][C]25038.2305161057[/C][/ROW]
[ROW][C]85[/C][C]21482.7183237706[/C][C]17129.8275470264[/C][C]25835.6091005148[/C][/ROW]
[/TABLE]
Source: https://freestatistics.org/blog/index.php?pk=13764&T=3

Globally Unique Identifier (entire table): ba.freestatistics.org/blog/index.php?pk=13764&T=3

As an alternative you can also use a QR Code:  

The GUIDs for individual cells are displayed in the table below:

Extrapolation Forecasts of Exponential Smoothing
tForecast95% Lower Bound95% Upper Bound
7419527.667827297118384.671897144120670.6637574501
7519198.801391034417625.451304554420772.1514775144
7619041.098889913717111.437982088820970.7597977386
7719090.553409416116842.550818230521338.5560006017
7819038.965802053116495.779303397721582.1523007085
7919423.829643149916600.882468647122246.7768176526
8019919.319772856516827.425696534423011.2138491786
8120585.829265259717232.811813116323938.846717403
8220600.230004815916991.854235092324208.6057745394
8320910.074651897517050.624983538824769.5243202562
8420930.889775976716823.549035847725038.2305161057
8521482.718323770617129.827547026425835.6091005148


Parameters (Session):
par1 = 12 ; par2 = Triple ; par3 = additive ;
Parameters (R input):
par1 = 12 ; par2 = Triple ; par3 = additive ;
R code (references can be found in the software module):
par1 <- as.numeric(par1)
if (par2 == 'Single') K <- 1
if (par2 == 'Double') K <- 2
if (par2 == 'Triple') K <- par1
nx <- length(x)
nxmK <- nx - K
x <- ts(x, frequency = par1)
if (par2 == 'Single') fit <- HoltWinters(x, gamma=0, beta=0)
if (par2 == 'Double') fit <- HoltWinters(x, gamma=0)
if (par2 == 'Triple') fit <- HoltWinters(x, seasonal=par3)
fit
myresid <- x - fit$fitted[,'xhat']
bitmap(file='test1.png')
op <- par(mfrow=c(2,1))
plot(fit,ylab='Observed (black) / Fitted (red)',main='Interpolation Fit of Exponential Smoothing')
plot(myresid,ylab='Residuals',main='Interpolation Prediction Errors')
par(op)
dev.off()
bitmap(file='test2.png')
p <- predict(fit, par1, prediction.interval=TRUE)
np <- length(p[,1])
plot(fit,p,ylab='Observed (black) / Fitted (red)',main='Extrapolation Fit of Exponential Smoothing')
dev.off()
bitmap(file='test3.png')
op <- par(mfrow = c(2,2))
acf(as.numeric(myresid),lag.max = nx/2,main='Residual ACF')
spectrum(myresid,main='Residals Periodogram')
cpgram(myresid,main='Residal Cumulative Periodogram')
qqnorm(myresid,main='Residual Normal QQ Plot')
qqline(myresid)
par(op)
dev.off()
load(file='createtable')
a<-table.start()
a<-table.row.start(a)
a<-table.element(a,'Estimated Parameters of Exponential Smoothing',2,TRUE)
a<-table.row.end(a)
a<-table.row.start(a)
a<-table.element(a,'Parameter',header=TRUE)
a<-table.element(a,'Value',header=TRUE)
a<-table.row.end(a)
a<-table.row.start(a)
a<-table.element(a,'alpha',header=TRUE)
a<-table.element(a,fit$alpha)
a<-table.row.end(a)
a<-table.row.start(a)
a<-table.element(a,'beta',header=TRUE)
a<-table.element(a,fit$beta)
a<-table.row.end(a)
a<-table.row.start(a)
a<-table.element(a,'gamma',header=TRUE)
a<-table.element(a,fit$gamma)
a<-table.row.end(a)
a<-table.end(a)
table.save(a,file='mytable.tab')
a<-table.start()
a<-table.row.start(a)
a<-table.element(a,'Interpolation Forecasts of Exponential Smoothing',4,TRUE)
a<-table.row.end(a)
a<-table.row.start(a)
a<-table.element(a,'t',header=TRUE)
a<-table.element(a,'Observed',header=TRUE)
a<-table.element(a,'Fitted',header=TRUE)
a<-table.element(a,'Residuals',header=TRUE)
a<-table.row.end(a)
for (i in 1:nxmK) {
a<-table.row.start(a)
a<-table.element(a,i+K,header=TRUE)
a<-table.element(a,x[i+K])
a<-table.element(a,fit$fitted[i,'xhat'])
a<-table.element(a,myresid[i])
a<-table.row.end(a)
}
a<-table.end(a)
table.save(a,file='mytable1.tab')
a<-table.start()
a<-table.row.start(a)
a<-table.element(a,'Extrapolation Forecasts of Exponential Smoothing',4,TRUE)
a<-table.row.end(a)
a<-table.row.start(a)
a<-table.element(a,'t',header=TRUE)
a<-table.element(a,'Forecast',header=TRUE)
a<-table.element(a,'95% Lower Bound',header=TRUE)
a<-table.element(a,'95% Upper Bound',header=TRUE)
a<-table.row.end(a)
for (i in 1:np) {
a<-table.row.start(a)
a<-table.element(a,nx+i,header=TRUE)
a<-table.element(a,p[i,'fit'])
a<-table.element(a,p[i,'lwr'])
a<-table.element(a,p[i,'upr'])
a<-table.row.end(a)
}
a<-table.end(a)
table.save(a,file='mytable2.tab')