Free Statistics

of Irreproducible Research!

Author's title

Author*Unverified author*
R Software Modulerwasp_exponentialsmoothing.wasp
Title produced by softwareExponential Smoothing
Date of computationSun, 01 Jun 2008 06:20:41 -0600
Cite this page as followsStatistical Computations at FreeStatistics.org, Office for Research Development and Education, URL https://freestatistics.org/blog/index.php?v=date/2008/Jun/01/t1212323009lw3pul3su478icp.htm/, Retrieved Sat, 18 May 2024 16:46:11 +0000
Statistical Computations at FreeStatistics.org, Office for Research Development and Education, URL https://freestatistics.org/blog/index.php?pk=13658, Retrieved Sat, 18 May 2024 16:46:11 +0000
QR Codes:

Original text written by user:
IsPrivate?No (this computation is public)
User-defined keywords
Estimated Impact246
Family? (F = Feedback message, R = changed R code, M = changed R Module, P = changed Parameters, D = changed Data)
-       [Exponential Smoothing] [Exponential smoot...] [2008-06-01 12:20:41] [d41d8cd98f00b204e9800998ecf8427e] [Current]
Feedback Forum

Post a new message
Dataseries X:
1,1591
1,1203
1,0886
1,0701
1,0630
1,0377
1,0370
1,0606
1,0497
1,0706
1,0328
1,0110
1,0131
0,9834
0,9643
0,9449
0,9059
0,9505
0,9386
0,9045
0,8695
0,8525
0,8552
0,8983
0,9376
0,9205
0,9083
0,8925
0,8753
0,8530
0,8615
0,9014
0,9114
0,9050
0,8883
0,8912
0,8832
0,8706
0,8766
0,8860
0,9170
0,9561
0,9935
0,9781
0,9806
0,9812
1,0013
1,0194
1,0622
1,0785
1,0805
1,0862
1,1556
1,1674
1,1365
1,1155
1,1266
1,1714
1,1710
1,2298
1,2638
1,2640
1,2261
1,1989
1,2000
1,2146
1,2266
1,2191
1,2224
1,2507
1,2997
1,3406


Summary of computational transaction
Raw Inputview raw input (R code)
Raw Outputview raw output of R engine
Computing time3 seconds
R Server'Sir Ronald Aylmer Fisher' @ 193.190.124.24

\begin{tabular}{lllllllll}
\hline
Summary of computational transaction \tabularnewline
Raw Input & view raw input (R code)  \tabularnewline
Raw Output & view raw output of R engine  \tabularnewline
Computing time & 3 seconds \tabularnewline
R Server & 'Sir Ronald Aylmer Fisher' @ 193.190.124.24 \tabularnewline
\hline
\end{tabular}
%Source: https://freestatistics.org/blog/index.php?pk=13658&T=0

[TABLE]
[ROW][C]Summary of computational transaction[/C][/ROW]
[ROW][C]Raw Input[/C][C]view raw input (R code) [/C][/ROW]
[ROW][C]Raw Output[/C][C]view raw output of R engine [/C][/ROW]
[ROW][C]Computing time[/C][C]3 seconds[/C][/ROW]
[ROW][C]R Server[/C][C]'Sir Ronald Aylmer Fisher' @ 193.190.124.24[/C][/ROW]
[/TABLE]
Source: https://freestatistics.org/blog/index.php?pk=13658&T=0

Globally Unique Identifier (entire table): ba.freestatistics.org/blog/index.php?pk=13658&T=0

As an alternative you can also use a QR Code:  

The GUIDs for individual cells are displayed in the table below:

Summary of computational transaction
Raw Inputview raw input (R code)
Raw Outputview raw output of R engine
Computing time3 seconds
R Server'Sir Ronald Aylmer Fisher' @ 193.190.124.24


Estimated Parameters of Exponential Smoothing
ParameterValue
alpha0.926470202526935
beta0.0777052499017337
gamma1

\begin{tabular}{lllllllll}
\hline
Estimated Parameters of Exponential Smoothing \tabularnewline
Parameter & Value \tabularnewline
alpha & 0.926470202526935 \tabularnewline
beta & 0.0777052499017337 \tabularnewline
gamma & 1 \tabularnewline
\hline
\end{tabular}
%Source: https://freestatistics.org/blog/index.php?pk=13658&T=1

[TABLE]
[ROW][C]Estimated Parameters of Exponential Smoothing[/C][/ROW]
[ROW][C]Parameter[/C][C]Value[/C][/ROW]
[ROW][C]alpha[/C][C]0.926470202526935[/C][/ROW]
[ROW][C]beta[/C][C]0.0777052499017337[/C][/ROW]
[ROW][C]gamma[/C][C]1[/C][/ROW]
[/TABLE]
Source: https://freestatistics.org/blog/index.php?pk=13658&T=1

Globally Unique Identifier (entire table): ba.freestatistics.org/blog/index.php?pk=13658&T=1

As an alternative you can also use a QR Code:  

The GUIDs for individual cells are displayed in the table below:

Estimated Parameters of Exponential Smoothing
ParameterValue
alpha0.926470202526935
beta0.0777052499017337
gamma1


Interpolation Forecasts of Exponential Smoothing
tObservedFittedResiduals
131.01311.06825441666667-0.0551544166666673
140.98340.986105876504275-0.00270587650427467
150.96430.966362878926515-0.00206287892651502
160.94490.949350422826513-0.0044504228265132
170.90590.910097252058817-0.0041972520588166
180.95050.9499848029113760.000515197088624464
190.93860.9335212206753070.00507877932469325
200.90450.8973762908403290.00712370915967131
210.86950.8619262747741810.00757372522581912
220.85250.8450009297704460.00749907022955365
230.85520.8471879558578120.00801204414218792
240.89830.8927062035225350.00559379647746538
250.93760.8970228967137160.0405771032862837
260.92050.912358815404970.00814118459503088
270.90830.9084290011099-0.000129001109899551
280.89250.898888317425963-0.00638831742596302
290.87530.8635744963844220.0117255036155782
300.8530.925422951711084-0.0724229517110838
310.86150.8433314136983990.0181685863016013
320.90140.8220180258270020.0793819741729983
330.91140.8613020793496070.050097920650393
340.9050.8945858803122080.0104141196877923
350.88830.910538426185757-0.022238426185757
360.89120.936702015956785-0.0455020159567849
370.88320.901423122437301-0.0182231224373013
380.87060.860835100831860.0097648991681405
390.87660.8588561217043330.0177438782956674
400.8860.8677551962003070.0182448037996932
410.9170.8607098255764370.0562901744235625
420.95610.964981675521665-0.00888167552166552
430.99350.9603178259300850.0331821740699146
440.97810.9703933519144770.00770664808552346
450.98060.9489373438723190.0316626561276810
460.98120.9687145384037160.0124854615962839
471.00130.9908253636374660.0104746363625339
481.01941.05458130760473-0.0351813076047325
491.06221.040608302207470.0215916977925279
501.07851.051570059130420.0269299408695782
511.08051.079920991582230.000579008417773919
521.08621.085558751332960.000641248667040628
531.15561.076338964517640.0792610354823593
541.16741.21009155354270-0.0426915535427048
551.13651.18775377229719-0.0512537722971858
561.11551.12220698746692-0.00670698746691989
571.12661.092599283112460.0340007168875387
581.17141.116741473888850.0546585261111547
591.1711.18442158535483-0.0134215853548254
601.22981.227606046614510.00219395338549022
611.26381.260050046192340.00374995380766419
621.2641.261205454980160.00279454501983722
631.22611.26985151398983-0.0437515139898315
641.19891.23582494737013-0.0369249473701265
651.21.196279650989170.00372034901082663
661.21461.24433815565131-0.0297381556513099
671.22661.22756352908810-0.00096352908809516
681.21911.209696942864220.00940305713577927
691.22241.19698000264570.0254199973542999
701.25071.213045695863670.037654304136328
711.29971.257096143298560.0426038567014435
721.34061.35449823349823-0.0138982334982334

\begin{tabular}{lllllllll}
\hline
Interpolation Forecasts of Exponential Smoothing \tabularnewline
t & Observed & Fitted & Residuals \tabularnewline
13 & 1.0131 & 1.06825441666667 & -0.0551544166666673 \tabularnewline
14 & 0.9834 & 0.986105876504275 & -0.00270587650427467 \tabularnewline
15 & 0.9643 & 0.966362878926515 & -0.00206287892651502 \tabularnewline
16 & 0.9449 & 0.949350422826513 & -0.0044504228265132 \tabularnewline
17 & 0.9059 & 0.910097252058817 & -0.0041972520588166 \tabularnewline
18 & 0.9505 & 0.949984802911376 & 0.000515197088624464 \tabularnewline
19 & 0.9386 & 0.933521220675307 & 0.00507877932469325 \tabularnewline
20 & 0.9045 & 0.897376290840329 & 0.00712370915967131 \tabularnewline
21 & 0.8695 & 0.861926274774181 & 0.00757372522581912 \tabularnewline
22 & 0.8525 & 0.845000929770446 & 0.00749907022955365 \tabularnewline
23 & 0.8552 & 0.847187955857812 & 0.00801204414218792 \tabularnewline
24 & 0.8983 & 0.892706203522535 & 0.00559379647746538 \tabularnewline
25 & 0.9376 & 0.897022896713716 & 0.0405771032862837 \tabularnewline
26 & 0.9205 & 0.91235881540497 & 0.00814118459503088 \tabularnewline
27 & 0.9083 & 0.9084290011099 & -0.000129001109899551 \tabularnewline
28 & 0.8925 & 0.898888317425963 & -0.00638831742596302 \tabularnewline
29 & 0.8753 & 0.863574496384422 & 0.0117255036155782 \tabularnewline
30 & 0.853 & 0.925422951711084 & -0.0724229517110838 \tabularnewline
31 & 0.8615 & 0.843331413698399 & 0.0181685863016013 \tabularnewline
32 & 0.9014 & 0.822018025827002 & 0.0793819741729983 \tabularnewline
33 & 0.9114 & 0.861302079349607 & 0.050097920650393 \tabularnewline
34 & 0.905 & 0.894585880312208 & 0.0104141196877923 \tabularnewline
35 & 0.8883 & 0.910538426185757 & -0.022238426185757 \tabularnewline
36 & 0.8912 & 0.936702015956785 & -0.0455020159567849 \tabularnewline
37 & 0.8832 & 0.901423122437301 & -0.0182231224373013 \tabularnewline
38 & 0.8706 & 0.86083510083186 & 0.0097648991681405 \tabularnewline
39 & 0.8766 & 0.858856121704333 & 0.0177438782956674 \tabularnewline
40 & 0.886 & 0.867755196200307 & 0.0182448037996932 \tabularnewline
41 & 0.917 & 0.860709825576437 & 0.0562901744235625 \tabularnewline
42 & 0.9561 & 0.964981675521665 & -0.00888167552166552 \tabularnewline
43 & 0.9935 & 0.960317825930085 & 0.0331821740699146 \tabularnewline
44 & 0.9781 & 0.970393351914477 & 0.00770664808552346 \tabularnewline
45 & 0.9806 & 0.948937343872319 & 0.0316626561276810 \tabularnewline
46 & 0.9812 & 0.968714538403716 & 0.0124854615962839 \tabularnewline
47 & 1.0013 & 0.990825363637466 & 0.0104746363625339 \tabularnewline
48 & 1.0194 & 1.05458130760473 & -0.0351813076047325 \tabularnewline
49 & 1.0622 & 1.04060830220747 & 0.0215916977925279 \tabularnewline
50 & 1.0785 & 1.05157005913042 & 0.0269299408695782 \tabularnewline
51 & 1.0805 & 1.07992099158223 & 0.000579008417773919 \tabularnewline
52 & 1.0862 & 1.08555875133296 & 0.000641248667040628 \tabularnewline
53 & 1.1556 & 1.07633896451764 & 0.0792610354823593 \tabularnewline
54 & 1.1674 & 1.21009155354270 & -0.0426915535427048 \tabularnewline
55 & 1.1365 & 1.18775377229719 & -0.0512537722971858 \tabularnewline
56 & 1.1155 & 1.12220698746692 & -0.00670698746691989 \tabularnewline
57 & 1.1266 & 1.09259928311246 & 0.0340007168875387 \tabularnewline
58 & 1.1714 & 1.11674147388885 & 0.0546585261111547 \tabularnewline
59 & 1.171 & 1.18442158535483 & -0.0134215853548254 \tabularnewline
60 & 1.2298 & 1.22760604661451 & 0.00219395338549022 \tabularnewline
61 & 1.2638 & 1.26005004619234 & 0.00374995380766419 \tabularnewline
62 & 1.264 & 1.26120545498016 & 0.00279454501983722 \tabularnewline
63 & 1.2261 & 1.26985151398983 & -0.0437515139898315 \tabularnewline
64 & 1.1989 & 1.23582494737013 & -0.0369249473701265 \tabularnewline
65 & 1.2 & 1.19627965098917 & 0.00372034901082663 \tabularnewline
66 & 1.2146 & 1.24433815565131 & -0.0297381556513099 \tabularnewline
67 & 1.2266 & 1.22756352908810 & -0.00096352908809516 \tabularnewline
68 & 1.2191 & 1.20969694286422 & 0.00940305713577927 \tabularnewline
69 & 1.2224 & 1.1969800026457 & 0.0254199973542999 \tabularnewline
70 & 1.2507 & 1.21304569586367 & 0.037654304136328 \tabularnewline
71 & 1.2997 & 1.25709614329856 & 0.0426038567014435 \tabularnewline
72 & 1.3406 & 1.35449823349823 & -0.0138982334982334 \tabularnewline
\hline
\end{tabular}
%Source: https://freestatistics.org/blog/index.php?pk=13658&T=2

[TABLE]
[ROW][C]Interpolation Forecasts of Exponential Smoothing[/C][/ROW]
[ROW][C]t[/C][C]Observed[/C][C]Fitted[/C][C]Residuals[/C][/ROW]
[ROW][C]13[/C][C]1.0131[/C][C]1.06825441666667[/C][C]-0.0551544166666673[/C][/ROW]
[ROW][C]14[/C][C]0.9834[/C][C]0.986105876504275[/C][C]-0.00270587650427467[/C][/ROW]
[ROW][C]15[/C][C]0.9643[/C][C]0.966362878926515[/C][C]-0.00206287892651502[/C][/ROW]
[ROW][C]16[/C][C]0.9449[/C][C]0.949350422826513[/C][C]-0.0044504228265132[/C][/ROW]
[ROW][C]17[/C][C]0.9059[/C][C]0.910097252058817[/C][C]-0.0041972520588166[/C][/ROW]
[ROW][C]18[/C][C]0.9505[/C][C]0.949984802911376[/C][C]0.000515197088624464[/C][/ROW]
[ROW][C]19[/C][C]0.9386[/C][C]0.933521220675307[/C][C]0.00507877932469325[/C][/ROW]
[ROW][C]20[/C][C]0.9045[/C][C]0.897376290840329[/C][C]0.00712370915967131[/C][/ROW]
[ROW][C]21[/C][C]0.8695[/C][C]0.861926274774181[/C][C]0.00757372522581912[/C][/ROW]
[ROW][C]22[/C][C]0.8525[/C][C]0.845000929770446[/C][C]0.00749907022955365[/C][/ROW]
[ROW][C]23[/C][C]0.8552[/C][C]0.847187955857812[/C][C]0.00801204414218792[/C][/ROW]
[ROW][C]24[/C][C]0.8983[/C][C]0.892706203522535[/C][C]0.00559379647746538[/C][/ROW]
[ROW][C]25[/C][C]0.9376[/C][C]0.897022896713716[/C][C]0.0405771032862837[/C][/ROW]
[ROW][C]26[/C][C]0.9205[/C][C]0.91235881540497[/C][C]0.00814118459503088[/C][/ROW]
[ROW][C]27[/C][C]0.9083[/C][C]0.9084290011099[/C][C]-0.000129001109899551[/C][/ROW]
[ROW][C]28[/C][C]0.8925[/C][C]0.898888317425963[/C][C]-0.00638831742596302[/C][/ROW]
[ROW][C]29[/C][C]0.8753[/C][C]0.863574496384422[/C][C]0.0117255036155782[/C][/ROW]
[ROW][C]30[/C][C]0.853[/C][C]0.925422951711084[/C][C]-0.0724229517110838[/C][/ROW]
[ROW][C]31[/C][C]0.8615[/C][C]0.843331413698399[/C][C]0.0181685863016013[/C][/ROW]
[ROW][C]32[/C][C]0.9014[/C][C]0.822018025827002[/C][C]0.0793819741729983[/C][/ROW]
[ROW][C]33[/C][C]0.9114[/C][C]0.861302079349607[/C][C]0.050097920650393[/C][/ROW]
[ROW][C]34[/C][C]0.905[/C][C]0.894585880312208[/C][C]0.0104141196877923[/C][/ROW]
[ROW][C]35[/C][C]0.8883[/C][C]0.910538426185757[/C][C]-0.022238426185757[/C][/ROW]
[ROW][C]36[/C][C]0.8912[/C][C]0.936702015956785[/C][C]-0.0455020159567849[/C][/ROW]
[ROW][C]37[/C][C]0.8832[/C][C]0.901423122437301[/C][C]-0.0182231224373013[/C][/ROW]
[ROW][C]38[/C][C]0.8706[/C][C]0.86083510083186[/C][C]0.0097648991681405[/C][/ROW]
[ROW][C]39[/C][C]0.8766[/C][C]0.858856121704333[/C][C]0.0177438782956674[/C][/ROW]
[ROW][C]40[/C][C]0.886[/C][C]0.867755196200307[/C][C]0.0182448037996932[/C][/ROW]
[ROW][C]41[/C][C]0.917[/C][C]0.860709825576437[/C][C]0.0562901744235625[/C][/ROW]
[ROW][C]42[/C][C]0.9561[/C][C]0.964981675521665[/C][C]-0.00888167552166552[/C][/ROW]
[ROW][C]43[/C][C]0.9935[/C][C]0.960317825930085[/C][C]0.0331821740699146[/C][/ROW]
[ROW][C]44[/C][C]0.9781[/C][C]0.970393351914477[/C][C]0.00770664808552346[/C][/ROW]
[ROW][C]45[/C][C]0.9806[/C][C]0.948937343872319[/C][C]0.0316626561276810[/C][/ROW]
[ROW][C]46[/C][C]0.9812[/C][C]0.968714538403716[/C][C]0.0124854615962839[/C][/ROW]
[ROW][C]47[/C][C]1.0013[/C][C]0.990825363637466[/C][C]0.0104746363625339[/C][/ROW]
[ROW][C]48[/C][C]1.0194[/C][C]1.05458130760473[/C][C]-0.0351813076047325[/C][/ROW]
[ROW][C]49[/C][C]1.0622[/C][C]1.04060830220747[/C][C]0.0215916977925279[/C][/ROW]
[ROW][C]50[/C][C]1.0785[/C][C]1.05157005913042[/C][C]0.0269299408695782[/C][/ROW]
[ROW][C]51[/C][C]1.0805[/C][C]1.07992099158223[/C][C]0.000579008417773919[/C][/ROW]
[ROW][C]52[/C][C]1.0862[/C][C]1.08555875133296[/C][C]0.000641248667040628[/C][/ROW]
[ROW][C]53[/C][C]1.1556[/C][C]1.07633896451764[/C][C]0.0792610354823593[/C][/ROW]
[ROW][C]54[/C][C]1.1674[/C][C]1.21009155354270[/C][C]-0.0426915535427048[/C][/ROW]
[ROW][C]55[/C][C]1.1365[/C][C]1.18775377229719[/C][C]-0.0512537722971858[/C][/ROW]
[ROW][C]56[/C][C]1.1155[/C][C]1.12220698746692[/C][C]-0.00670698746691989[/C][/ROW]
[ROW][C]57[/C][C]1.1266[/C][C]1.09259928311246[/C][C]0.0340007168875387[/C][/ROW]
[ROW][C]58[/C][C]1.1714[/C][C]1.11674147388885[/C][C]0.0546585261111547[/C][/ROW]
[ROW][C]59[/C][C]1.171[/C][C]1.18442158535483[/C][C]-0.0134215853548254[/C][/ROW]
[ROW][C]60[/C][C]1.2298[/C][C]1.22760604661451[/C][C]0.00219395338549022[/C][/ROW]
[ROW][C]61[/C][C]1.2638[/C][C]1.26005004619234[/C][C]0.00374995380766419[/C][/ROW]
[ROW][C]62[/C][C]1.264[/C][C]1.26120545498016[/C][C]0.00279454501983722[/C][/ROW]
[ROW][C]63[/C][C]1.2261[/C][C]1.26985151398983[/C][C]-0.0437515139898315[/C][/ROW]
[ROW][C]64[/C][C]1.1989[/C][C]1.23582494737013[/C][C]-0.0369249473701265[/C][/ROW]
[ROW][C]65[/C][C]1.2[/C][C]1.19627965098917[/C][C]0.00372034901082663[/C][/ROW]
[ROW][C]66[/C][C]1.2146[/C][C]1.24433815565131[/C][C]-0.0297381556513099[/C][/ROW]
[ROW][C]67[/C][C]1.2266[/C][C]1.22756352908810[/C][C]-0.00096352908809516[/C][/ROW]
[ROW][C]68[/C][C]1.2191[/C][C]1.20969694286422[/C][C]0.00940305713577927[/C][/ROW]
[ROW][C]69[/C][C]1.2224[/C][C]1.1969800026457[/C][C]0.0254199973542999[/C][/ROW]
[ROW][C]70[/C][C]1.2507[/C][C]1.21304569586367[/C][C]0.037654304136328[/C][/ROW]
[ROW][C]71[/C][C]1.2997[/C][C]1.25709614329856[/C][C]0.0426038567014435[/C][/ROW]
[ROW][C]72[/C][C]1.3406[/C][C]1.35449823349823[/C][C]-0.0138982334982334[/C][/ROW]
[/TABLE]
Source: https://freestatistics.org/blog/index.php?pk=13658&T=2

Globally Unique Identifier (entire table): ba.freestatistics.org/blog/index.php?pk=13658&T=2

As an alternative you can also use a QR Code:  

The GUIDs for individual cells are displayed in the table below:

Interpolation Forecasts of Exponential Smoothing
tObservedFittedResiduals
131.01311.06825441666667-0.0551544166666673
140.98340.986105876504275-0.00270587650427467
150.96430.966362878926515-0.00206287892651502
160.94490.949350422826513-0.0044504228265132
170.90590.910097252058817-0.0041972520588166
180.95050.9499848029113760.000515197088624464
190.93860.9335212206753070.00507877932469325
200.90450.8973762908403290.00712370915967131
210.86950.8619262747741810.00757372522581912
220.85250.8450009297704460.00749907022955365
230.85520.8471879558578120.00801204414218792
240.89830.8927062035225350.00559379647746538
250.93760.8970228967137160.0405771032862837
260.92050.912358815404970.00814118459503088
270.90830.9084290011099-0.000129001109899551
280.89250.898888317425963-0.00638831742596302
290.87530.8635744963844220.0117255036155782
300.8530.925422951711084-0.0724229517110838
310.86150.8433314136983990.0181685863016013
320.90140.8220180258270020.0793819741729983
330.91140.8613020793496070.050097920650393
340.9050.8945858803122080.0104141196877923
350.88830.910538426185757-0.022238426185757
360.89120.936702015956785-0.0455020159567849
370.88320.901423122437301-0.0182231224373013
380.87060.860835100831860.0097648991681405
390.87660.8588561217043330.0177438782956674
400.8860.8677551962003070.0182448037996932
410.9170.8607098255764370.0562901744235625
420.95610.964981675521665-0.00888167552166552
430.99350.9603178259300850.0331821740699146
440.97810.9703933519144770.00770664808552346
450.98060.9489373438723190.0316626561276810
460.98120.9687145384037160.0124854615962839
471.00130.9908253636374660.0104746363625339
481.01941.05458130760473-0.0351813076047325
491.06221.040608302207470.0215916977925279
501.07851.051570059130420.0269299408695782
511.08051.079920991582230.000579008417773919
521.08621.085558751332960.000641248667040628
531.15561.076338964517640.0792610354823593
541.16741.21009155354270-0.0426915535427048
551.13651.18775377229719-0.0512537722971858
561.11551.12220698746692-0.00670698746691989
571.12661.092599283112460.0340007168875387
581.17141.116741473888850.0546585261111547
591.1711.18442158535483-0.0134215853548254
601.22981.227606046614510.00219395338549022
611.26381.260050046192340.00374995380766419
621.2641.261205454980160.00279454501983722
631.22611.26985151398983-0.0437515139898315
641.19891.23582494737013-0.0369249473701265
651.21.196279650989170.00372034901082663
661.21461.24433815565131-0.0297381556513099
671.22661.22756352908810-0.00096352908809516
681.21911.209696942864220.00940305713577927
691.22241.19698000264570.0254199973542999
701.25071.213045695863670.037654304136328
711.29971.257096143298560.0426038567014435
721.34061.35449823349823-0.0138982334982334


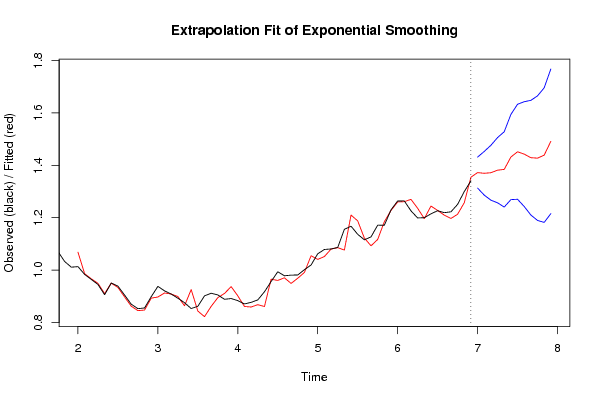
Extrapolation Forecasts of Exponential Smoothing
tForecast95% Lower Bound95% Upper Bound
731.372152730462201.313070680346521.43123478057789
741.369498719233861.286008319759891.45298911870783
751.371667060959661.266926792284471.47640732963486
761.381360533560651.256755144858291.505965922263
771.384355636181711.240568408469481.52814286389393
781.431581212520661.268942045113281.59422037992804
791.451688852125121.2703249040171.63305280023323
801.442761524490591.242673797324061.64284925165712
811.429118037892891.210224610725261.64801146506051
821.427309804366771.189472115235661.66514749349787
831.438905164323761.181944888562921.69586544008459
841.491680907480191.215391265410361.76797054955001

\begin{tabular}{lllllllll}
\hline
Extrapolation Forecasts of Exponential Smoothing \tabularnewline
t & Forecast & 95% Lower Bound & 95% Upper Bound \tabularnewline
73 & 1.37215273046220 & 1.31307068034652 & 1.43123478057789 \tabularnewline
74 & 1.36949871923386 & 1.28600831975989 & 1.45298911870783 \tabularnewline
75 & 1.37166706095966 & 1.26692679228447 & 1.47640732963486 \tabularnewline
76 & 1.38136053356065 & 1.25675514485829 & 1.505965922263 \tabularnewline
77 & 1.38435563618171 & 1.24056840846948 & 1.52814286389393 \tabularnewline
78 & 1.43158121252066 & 1.26894204511328 & 1.59422037992804 \tabularnewline
79 & 1.45168885212512 & 1.270324904017 & 1.63305280023323 \tabularnewline
80 & 1.44276152449059 & 1.24267379732406 & 1.64284925165712 \tabularnewline
81 & 1.42911803789289 & 1.21022461072526 & 1.64801146506051 \tabularnewline
82 & 1.42730980436677 & 1.18947211523566 & 1.66514749349787 \tabularnewline
83 & 1.43890516432376 & 1.18194488856292 & 1.69586544008459 \tabularnewline
84 & 1.49168090748019 & 1.21539126541036 & 1.76797054955001 \tabularnewline
\hline
\end{tabular}
%Source: https://freestatistics.org/blog/index.php?pk=13658&T=3

[TABLE]
[ROW][C]Extrapolation Forecasts of Exponential Smoothing[/C][/ROW]
[ROW][C]t[/C][C]Forecast[/C][C]95% Lower Bound[/C][C]95% Upper Bound[/C][/ROW]
[ROW][C]73[/C][C]1.37215273046220[/C][C]1.31307068034652[/C][C]1.43123478057789[/C][/ROW]
[ROW][C]74[/C][C]1.36949871923386[/C][C]1.28600831975989[/C][C]1.45298911870783[/C][/ROW]
[ROW][C]75[/C][C]1.37166706095966[/C][C]1.26692679228447[/C][C]1.47640732963486[/C][/ROW]
[ROW][C]76[/C][C]1.38136053356065[/C][C]1.25675514485829[/C][C]1.505965922263[/C][/ROW]
[ROW][C]77[/C][C]1.38435563618171[/C][C]1.24056840846948[/C][C]1.52814286389393[/C][/ROW]
[ROW][C]78[/C][C]1.43158121252066[/C][C]1.26894204511328[/C][C]1.59422037992804[/C][/ROW]
[ROW][C]79[/C][C]1.45168885212512[/C][C]1.270324904017[/C][C]1.63305280023323[/C][/ROW]
[ROW][C]80[/C][C]1.44276152449059[/C][C]1.24267379732406[/C][C]1.64284925165712[/C][/ROW]
[ROW][C]81[/C][C]1.42911803789289[/C][C]1.21022461072526[/C][C]1.64801146506051[/C][/ROW]
[ROW][C]82[/C][C]1.42730980436677[/C][C]1.18947211523566[/C][C]1.66514749349787[/C][/ROW]
[ROW][C]83[/C][C]1.43890516432376[/C][C]1.18194488856292[/C][C]1.69586544008459[/C][/ROW]
[ROW][C]84[/C][C]1.49168090748019[/C][C]1.21539126541036[/C][C]1.76797054955001[/C][/ROW]
[/TABLE]
Source: https://freestatistics.org/blog/index.php?pk=13658&T=3

Globally Unique Identifier (entire table): ba.freestatistics.org/blog/index.php?pk=13658&T=3

As an alternative you can also use a QR Code:  

The GUIDs for individual cells are displayed in the table below:

Extrapolation Forecasts of Exponential Smoothing
tForecast95% Lower Bound95% Upper Bound
731.372152730462201.313070680346521.43123478057789
741.369498719233861.286008319759891.45298911870783
751.371667060959661.266926792284471.47640732963486
761.381360533560651.256755144858291.505965922263
771.384355636181711.240568408469481.52814286389393
781.431581212520661.268942045113281.59422037992804
791.451688852125121.2703249040171.63305280023323
801.442761524490591.242673797324061.64284925165712
811.429118037892891.210224610725261.64801146506051
821.427309804366771.189472115235661.66514749349787
831.438905164323761.181944888562921.69586544008459
841.491680907480191.215391265410361.76797054955001


Parameters (Session):
par1 = 12 ; par2 = Triple ; par3 = additive ;
Parameters (R input):
par1 = 12 ; par2 = Triple ; par3 = additive ;
R code (references can be found in the software module):
par1 <- as.numeric(par1)
if (par2 == 'Single') K <- 1
if (par2 == 'Double') K <- 2
if (par2 == 'Triple') K <- par1
nx <- length(x)
nxmK <- nx - K
x <- ts(x, frequency = par1)
if (par2 == 'Single') fit <- HoltWinters(x, gamma=0, beta=0)
if (par2 == 'Double') fit <- HoltWinters(x, gamma=0)
if (par2 == 'Triple') fit <- HoltWinters(x, seasonal=par3)
fit
myresid <- x - fit$fitted[,'xhat']
bitmap(file='test1.png')
op <- par(mfrow=c(2,1))
plot(fit,ylab='Observed (black) / Fitted (red)',main='Interpolation Fit of Exponential Smoothing')
plot(myresid,ylab='Residuals',main='Interpolation Prediction Errors')
par(op)
dev.off()
bitmap(file='test2.png')
p <- predict(fit, par1, prediction.interval=TRUE)
np <- length(p[,1])
plot(fit,p,ylab='Observed (black) / Fitted (red)',main='Extrapolation Fit of Exponential Smoothing')
dev.off()
bitmap(file='test3.png')
op <- par(mfrow = c(2,2))
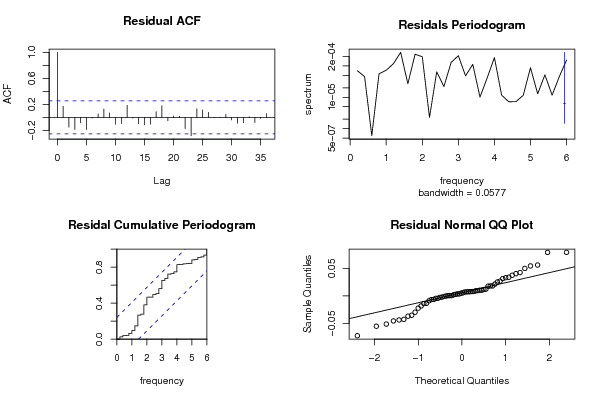
acf(as.numeric(myresid),lag.max = nx/2,main='Residual ACF')
spectrum(myresid,main='Residals Periodogram')
cpgram(myresid,main='Residal Cumulative Periodogram')
qqnorm(myresid,main='Residual Normal QQ Plot')
qqline(myresid)
par(op)
dev.off()
load(file='createtable')
a<-table.start()
a<-table.row.start(a)
a<-table.element(a,'Estimated Parameters of Exponential Smoothing',2,TRUE)
a<-table.row.end(a)
a<-table.row.start(a)
a<-table.element(a,'Parameter',header=TRUE)
a<-table.element(a,'Value',header=TRUE)
a<-table.row.end(a)
a<-table.row.start(a)
a<-table.element(a,'alpha',header=TRUE)
a<-table.element(a,fit$alpha)
a<-table.row.end(a)
a<-table.row.start(a)
a<-table.element(a,'beta',header=TRUE)
a<-table.element(a,fit$beta)
a<-table.row.end(a)
a<-table.row.start(a)
a<-table.element(a,'gamma',header=TRUE)
a<-table.element(a,fit$gamma)
a<-table.row.end(a)
a<-table.end(a)
table.save(a,file='mytable.tab')
a<-table.start()
a<-table.row.start(a)
a<-table.element(a,'Interpolation Forecasts of Exponential Smoothing',4,TRUE)
a<-table.row.end(a)
a<-table.row.start(a)
a<-table.element(a,'t',header=TRUE)
a<-table.element(a,'Observed',header=TRUE)
a<-table.element(a,'Fitted',header=TRUE)
a<-table.element(a,'Residuals',header=TRUE)
a<-table.row.end(a)
for (i in 1:nxmK) {
a<-table.row.start(a)
a<-table.element(a,i+K,header=TRUE)
a<-table.element(a,x[i+K])
a<-table.element(a,fit$fitted[i,'xhat'])
a<-table.element(a,myresid[i])
a<-table.row.end(a)
}
a<-table.end(a)
table.save(a,file='mytable1.tab')
a<-table.start()
a<-table.row.start(a)
a<-table.element(a,'Extrapolation Forecasts of Exponential Smoothing',4,TRUE)
a<-table.row.end(a)
a<-table.row.start(a)
a<-table.element(a,'t',header=TRUE)
a<-table.element(a,'Forecast',header=TRUE)
a<-table.element(a,'95% Lower Bound',header=TRUE)
a<-table.element(a,'95% Upper Bound',header=TRUE)
a<-table.row.end(a)
for (i in 1:np) {
a<-table.row.start(a)
a<-table.element(a,nx+i,header=TRUE)
a<-table.element(a,p[i,'fit'])
a<-table.element(a,p[i,'lwr'])
a<-table.element(a,p[i,'upr'])
a<-table.row.end(a)
}
a<-table.end(a)
table.save(a,file='mytable2.tab')