Free Statistics

of Irreproducible Research!

Author's title

Author*Unverified author*
R Software Modulerwasp_harrell_davis.wasp
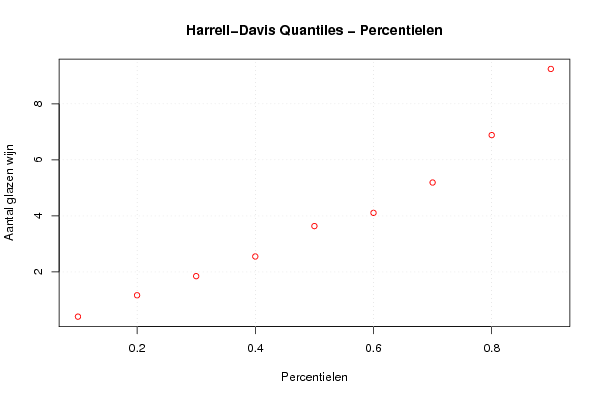
Title produced by softwareHarrell-Davis Quantiles
Date of computationSun, 20 Jan 2008 12:29:49 -0700
Cite this page as followsStatistical Computations at FreeStatistics.org, Office for Research Development and Education, URL https://freestatistics.org/blog/index.php?v=date/2008/Jan/20/t1200857155fg6q22wsctn8s56.htm/, Retrieved Wed, 15 May 2024 04:14:37 +0000
Statistical Computations at FreeStatistics.org, Office for Research Development and Education, URL https://freestatistics.org/blog/index.php?pk=8035, Retrieved Wed, 15 May 2024 04:14:37 +0000
QR Codes:

Original text written by user:Berekening van de Harrel Davies Percentielen voor het aantal glazen witte wijn per week.
IsPrivate?No (this computation is public)
User-defined keywords
Estimated Impact306
Family? (F = Feedback message, R = changed R code, M = changed R Module, P = changed Parameters, D = changed Data)
-       [Harrell-Davis Quantiles] [Harrell Davies Pe...] [2008-01-20 19:29:49] [d41d8cd98f00b204e9800998ecf8427e] [Current]
Feedback Forum

Post a new message
Dataseries X:
10
4
2
2
0
0
10
12
0
0
8
6
1
4
10
2
12
6
4
5
1
7
2
4
0
4
2
1
4
2
2
4
3
7
4
7
2
7
8
0
7
1
5
1
1
1
30
4
2
4
7
3
4
1
2
4
4


Summary of compuational transaction
Raw Inputview raw input (R code)
Raw Outputview raw output of R engine
Computing time3 seconds
R Server'Herman Ole Andreas Wold' @ 193.190.124.10:1001

\begin{tabular}{lllllllll}
\hline
Summary of compuational transaction \tabularnewline
Raw Input & view raw input (R code)  \tabularnewline
Raw Output & view raw output of R engine  \tabularnewline
Computing time & 3 seconds \tabularnewline
R Server & 'Herman Ole Andreas Wold' @ 193.190.124.10:1001 \tabularnewline
\hline
\end{tabular}
%Source: https://freestatistics.org/blog/index.php?pk=8035&T=0

[TABLE]
[ROW][C]Summary of compuational transaction[/C][/ROW]
[ROW][C]Raw Input[/C][C]view raw input (R code) [/C][/ROW]
[ROW][C]Raw Output[/C][C]view raw output of R engine [/C][/ROW]
[ROW][C]Computing time[/C][C]3 seconds[/C][/ROW]
[ROW][C]R Server[/C][C]'Herman Ole Andreas Wold' @ 193.190.124.10:1001[/C][/ROW]
[/TABLE]
Source: https://freestatistics.org/blog/index.php?pk=8035&T=0

Globally Unique Identifier (entire table): ba.freestatistics.org/blog/index.php?pk=8035&T=0

As an alternative you can also use a QR Code:  

The GUIDs for individual cells are displayed in the table below:

Summary of compuational transaction
Raw Inputview raw input (R code)
Raw Outputview raw output of R engine
Computing time3 seconds
R Server'Herman Ole Andreas Wold' @ 193.190.124.10:1001


Harrell-Davis Quantiles
quantilesvaluestandard error
0.10.4038324174517480.416738047096946
0.21.167285616402620.312295453010936
0.31.849047386401740.319446416807753
0.42.551332453152830.656951676698461
0.53.635436261365170.509000491735163
0.64.107616821484080.255406345905555
0.75.190166509041230.997543187349192
0.86.883126385976470.673183003559311
0.99.244234868555551.26588879273836

\begin{tabular}{lllllllll}
\hline
Harrell-Davis Quantiles \tabularnewline
quantiles & value & standard error \tabularnewline
0.1 & 0.403832417451748 & 0.416738047096946 \tabularnewline
0.2 & 1.16728561640262 & 0.312295453010936 \tabularnewline
0.3 & 1.84904738640174 & 0.319446416807753 \tabularnewline
0.4 & 2.55133245315283 & 0.656951676698461 \tabularnewline
0.5 & 3.63543626136517 & 0.509000491735163 \tabularnewline
0.6 & 4.10761682148408 & 0.255406345905555 \tabularnewline
0.7 & 5.19016650904123 & 0.997543187349192 \tabularnewline
0.8 & 6.88312638597647 & 0.673183003559311 \tabularnewline
0.9 & 9.24423486855555 & 1.26588879273836 \tabularnewline
\hline
\end{tabular}
%Source: https://freestatistics.org/blog/index.php?pk=8035&T=1

[TABLE]
[ROW][C]Harrell-Davis Quantiles[/C][/ROW]
[ROW][C]quantiles[/C][C]value[/C][C]standard error[/C][/ROW]
[ROW][C]0.1[/C][C]0.403832417451748[/C][C]0.416738047096946[/C][/ROW]
[ROW][C]0.2[/C][C]1.16728561640262[/C][C]0.312295453010936[/C][/ROW]
[ROW][C]0.3[/C][C]1.84904738640174[/C][C]0.319446416807753[/C][/ROW]
[ROW][C]0.4[/C][C]2.55133245315283[/C][C]0.656951676698461[/C][/ROW]
[ROW][C]0.5[/C][C]3.63543626136517[/C][C]0.509000491735163[/C][/ROW]
[ROW][C]0.6[/C][C]4.10761682148408[/C][C]0.255406345905555[/C][/ROW]
[ROW][C]0.7[/C][C]5.19016650904123[/C][C]0.997543187349192[/C][/ROW]
[ROW][C]0.8[/C][C]6.88312638597647[/C][C]0.673183003559311[/C][/ROW]
[ROW][C]0.9[/C][C]9.24423486855555[/C][C]1.26588879273836[/C][/ROW]
[/TABLE]
Source: https://freestatistics.org/blog/index.php?pk=8035&T=1

Globally Unique Identifier (entire table): ba.freestatistics.org/blog/index.php?pk=8035&T=1

As an alternative you can also use a QR Code:  

The GUIDs for individual cells are displayed in the table below:

Harrell-Davis Quantiles
quantilesvaluestandard error
0.10.4038324174517480.416738047096946
0.21.167285616402620.312295453010936
0.31.849047386401740.319446416807753
0.42.551332453152830.656951676698461
0.53.635436261365170.509000491735163
0.64.107616821484080.255406345905555
0.75.190166509041230.997543187349192
0.86.883126385976470.673183003559311
0.99.244234868555551.26588879273836


Parameters (Session):
par1 = 0.1 ; par2 = 0.9 ; par3 = 0.1 ;
Parameters (R input):
par1 = 0.1 ; par2 = 0.9 ; par3 = 0.1 ;
R code (references can be found in the software module):
par1 <- as(par1,'numeric')
par2 <- as(par2,'numeric')
par3 <- as(par3,'numeric')
library(Hmisc)
myseq <- seq(par1, par2, par3)
hd <- hdquantile(x, probs = myseq, se = TRUE, na.rm = FALSE, names = TRUE, weights=FALSE)
bitmap(file='test1.png')
plot(myseq,hd,col=2,main=main,xlab=xlab,ylab=ylab)
grid()
dev.off()
load(file='createtable')
a<-table.start()
a<-table.row.start(a)
a<-table.element(a,'Harrell-Davis Quantiles',3,TRUE)
a<-table.row.end(a)
a<-table.row.start(a)
a<-table.element(a,'quantiles',header=TRUE)
a<-table.element(a,'value',header=TRUE)
a<-table.element(a,'standard error',header=TRUE)
a<-table.row.end(a)
length(hd)
for (i in 1:length(hd))
{
a<-table.row.start(a)
a<-table.element(a,as(labels(hd)[i],'numeric'),header=TRUE)
a<-table.element(a,as.matrix(hd[i])[1,1])
a<-table.element(a,as.matrix(attr(hd,'se')[i])[1,1])
a<-table.row.end(a)
}
a<-table.end(a)
table.save(a,file='mytable.tab')