Free Statistics

of Irreproducible Research!

Author's title

Author*Unverified author*
R Software Modulerwasp_multipleregression.wasp
Title produced by softwareMultiple Regression
Date of computationWed, 16 Jan 2008 14:48:26 -0700
Cite this page as followsStatistical Computations at FreeStatistics.org, Office for Research Development and Education, URL https://freestatistics.org/blog/index.php?v=date/2008/Jan/16/t12005199411kdlxxb6i7osqy2.htm/, Retrieved Wed, 15 May 2024 09:06:54 +0000
Statistical Computations at FreeStatistics.org, Office for Research Development and Education, URL https://freestatistics.org/blog/index.php?pk=14674, Retrieved Wed, 15 May 2024 09:06:54 +0000
QR Codes:

Original text written by user:
IsPrivate?No (this computation is public)
User-defined keywords
Estimated Impact274
Family? (F = Feedback message, R = changed R code, M = changed R Module, P = changed Parameters, D = changed Data)
-       [Multiple Regression] [] [2008-01-16 21:48:26] [b7d6b479aed54886d3f0f0e1b7f692db] [Current]
Feedback Forum

Post a new message
Dataseries X:
281	0.88
295	0.87
294	0.88
302	0.89
314	0.92
321	0.96
313	0.99
310	0.98
319	0.98
316	0.98
319	1.00
333	1.02
356	1.06
358	1.08
340	1.08
328	1.08
355	1.16
356	1.17
351	1.14
359	1.11
378	1.12
378	1.17
389.	1.17
407	1.23
413	1.26
404	1.26
406	1.23
402	1.20
383	1.20
392	1.21
398	1.23
400	1.22
405	1.22
420	1.25
439	1.30
441	1.34
424	1.31
423	1.30
434	1.32
429	1.29
421	1.27
430	1.22
424	1.20
437	1.23
456	1.23
469	1.20
476	1.18
510	1.19
549	1.21
554	1.19
557	1.20
610	1.23
675	1.28
596	1.27
633	1.27
632	1.28
596	1.27
585	1.26
627	1.29
629	1.32


Summary of compuational transaction
Raw Inputview raw input (R code)
Raw Outputview raw output of R engine
Computing time6 seconds
R Server'Herman Ole Andreas Wold' @ 193.190.124.10:1001

\begin{tabular}{lllllllll}
\hline
Summary of compuational transaction \tabularnewline
Raw Input & view raw input (R code)  \tabularnewline
Raw Output & view raw output of R engine  \tabularnewline
Computing time & 6 seconds \tabularnewline
R Server & 'Herman Ole Andreas Wold' @ 193.190.124.10:1001 \tabularnewline
\hline
\end{tabular}
%Source: https://freestatistics.org/blog/index.php?pk=14674&T=0

[TABLE]
[ROW][C]Summary of compuational transaction[/C][/ROW]
[ROW][C]Raw Input[/C][C]view raw input (R code) [/C][/ROW]
[ROW][C]Raw Output[/C][C]view raw output of R engine [/C][/ROW]
[ROW][C]Computing time[/C][C]6 seconds[/C][/ROW]
[ROW][C]R Server[/C][C]'Herman Ole Andreas Wold' @ 193.190.124.10:1001[/C][/ROW]
[/TABLE]
Source: https://freestatistics.org/blog/index.php?pk=14674&T=0

Globally Unique Identifier (entire table): ba.freestatistics.org/blog/index.php?pk=14674&T=0

As an alternative you can also use a QR Code:  

The GUIDs for individual cells are displayed in the table below:

Summary of compuational transaction
Raw Inputview raw input (R code)
Raw Outputview raw output of R engine
Computing time6 seconds
R Server'Herman Ole Andreas Wold' @ 193.190.124.10:1001


Multiple Linear Regression - Estimated Regression Equation
Goud[t] = + 464.535125285788 -201.335459150576Dollar[t] + 0.188379650585503M1[t] -5.22513259929208M2[t] -12.2306320942663M3[t] -11.8441443441440M4[t] + 2.38507809879669M5[t] -15.0230923144787M6[t] -17.0312627277541M7[t] -20.4421040593307M8[t] -24.0502744726061M9[t] -26.4477612126768M10[t] -13.6345642795430M11[t] + 6.8081704132754t + e[t]

\begin{tabular}{lllllllll}
\hline
Multiple Linear Regression - Estimated Regression Equation \tabularnewline
Goud[t] =  +  464.535125285788 -201.335459150576Dollar[t] +  0.188379650585503M1[t] -5.22513259929208M2[t] -12.2306320942663M3[t] -11.8441443441440M4[t] +  2.38507809879669M5[t] -15.0230923144787M6[t] -17.0312627277541M7[t] -20.4421040593307M8[t] -24.0502744726061M9[t] -26.4477612126768M10[t] -13.6345642795430M11[t] +  6.8081704132754t  + e[t] \tabularnewline
\hline
\end{tabular}
%Source: https://freestatistics.org/blog/index.php?pk=14674&T=1

[TABLE]
[ROW][C]Multiple Linear Regression - Estimated Regression Equation[/C][/ROW]
[ROW][C]Goud[t] =  +  464.535125285788 -201.335459150576Dollar[t] +  0.188379650585503M1[t] -5.22513259929208M2[t] -12.2306320942663M3[t] -11.8441443441440M4[t] +  2.38507809879669M5[t] -15.0230923144787M6[t] -17.0312627277541M7[t] -20.4421040593307M8[t] -24.0502744726061M9[t] -26.4477612126768M10[t] -13.6345642795430M11[t] +  6.8081704132754t  + e[t][/C][/ROW]
[/TABLE]
Source: https://freestatistics.org/blog/index.php?pk=14674&T=1

Globally Unique Identifier (entire table): ba.freestatistics.org/blog/index.php?pk=14674&T=1

As an alternative you can also use a QR Code:  

The GUIDs for individual cells are displayed in the table below:

Multiple Linear Regression - Estimated Regression Equation
Goud[t] = + 464.535125285788 -201.335459150576Dollar[t] + 0.188379650585503M1[t] -5.22513259929208M2[t] -12.2306320942663M3[t] -11.8441443441440M4[t] + 2.38507809879669M5[t] -15.0230923144787M6[t] -17.0312627277541M7[t] -20.4421040593307M8[t] -24.0502744726061M9[t] -26.4477612126768M10[t] -13.6345642795430M11[t] + 6.8081704132754t + e[t]


Multiple Linear Regression - Ordinary Least Squares
VariableParameterS.D.T-STATH0: parameter = 02-tail p-value1-tail p-value
(Intercept)464.53512528578872.4470086.412100
Dollar-201.33545915057669.74492-2.88670.0059110.002956
M10.18837965058550323.929250.00790.9937530.496876
M2-5.2251325992920823.921849-0.21840.8280640.414032
M3-12.230632094266323.907015-0.51160.6113840.305692
M4-11.844144344144023.935706-0.49480.6230740.311537
M52.3850780987966923.8115460.10020.9206490.460324
M6-15.023092314478723.807123-0.6310.5311420.265571
M7-17.031262727754123.813765-0.71520.4781090.239054
M8-20.442104059330723.84392-0.85730.3957070.197854
M9-24.050274472606123.875125-1.00730.3190430.159521
M10-26.447761212676823.852521-1.10880.2732790.136639
M11-13.634564279543023.785193-0.57320.5692760.284638
t6.80817041327540.51326513.264400

\begin{tabular}{lllllllll}
\hline
Multiple Linear Regression - Ordinary Least Squares \tabularnewline
Variable & Parameter & S.D. & T-STATH0: parameter = 0 & 2-tail p-value & 1-tail p-value \tabularnewline
(Intercept) & 464.535125285788 & 72.447008 & 6.4121 & 0 & 0 \tabularnewline
Dollar & -201.335459150576 & 69.74492 & -2.8867 & 0.005911 & 0.002956 \tabularnewline
M1 & 0.188379650585503 & 23.92925 & 0.0079 & 0.993753 & 0.496876 \tabularnewline
M2 & -5.22513259929208 & 23.921849 & -0.2184 & 0.828064 & 0.414032 \tabularnewline
M3 & -12.2306320942663 & 23.907015 & -0.5116 & 0.611384 & 0.305692 \tabularnewline
M4 & -11.8441443441440 & 23.935706 & -0.4948 & 0.623074 & 0.311537 \tabularnewline
M5 & 2.38507809879669 & 23.811546 & 0.1002 & 0.920649 & 0.460324 \tabularnewline
M6 & -15.0230923144787 & 23.807123 & -0.631 & 0.531142 & 0.265571 \tabularnewline
M7 & -17.0312627277541 & 23.813765 & -0.7152 & 0.478109 & 0.239054 \tabularnewline
M8 & -20.4421040593307 & 23.84392 & -0.8573 & 0.395707 & 0.197854 \tabularnewline
M9 & -24.0502744726061 & 23.875125 & -1.0073 & 0.319043 & 0.159521 \tabularnewline
M10 & -26.4477612126768 & 23.852521 & -1.1088 & 0.273279 & 0.136639 \tabularnewline
M11 & -13.6345642795430 & 23.785193 & -0.5732 & 0.569276 & 0.284638 \tabularnewline
t & 6.8081704132754 & 0.513265 & 13.2644 & 0 & 0 \tabularnewline
\hline
\end{tabular}
%Source: https://freestatistics.org/blog/index.php?pk=14674&T=2

[TABLE]
[ROW][C]Multiple Linear Regression - Ordinary Least Squares[/C][/ROW]
[ROW][C]Variable[/C][C]Parameter[/C][C]S.D.[/C][C]T-STATH0: parameter = 0[/C][C]2-tail p-value[/C][C]1-tail p-value[/C][/ROW]
[ROW][C](Intercept)[/C][C]464.535125285788[/C][C]72.447008[/C][C]6.4121[/C][C]0[/C][C]0[/C][/ROW]
[ROW][C]Dollar[/C][C]-201.335459150576[/C][C]69.74492[/C][C]-2.8867[/C][C]0.005911[/C][C]0.002956[/C][/ROW]
[ROW][C]M1[/C][C]0.188379650585503[/C][C]23.92925[/C][C]0.0079[/C][C]0.993753[/C][C]0.496876[/C][/ROW]
[ROW][C]M2[/C][C]-5.22513259929208[/C][C]23.921849[/C][C]-0.2184[/C][C]0.828064[/C][C]0.414032[/C][/ROW]
[ROW][C]M3[/C][C]-12.2306320942663[/C][C]23.907015[/C][C]-0.5116[/C][C]0.611384[/C][C]0.305692[/C][/ROW]
[ROW][C]M4[/C][C]-11.8441443441440[/C][C]23.935706[/C][C]-0.4948[/C][C]0.623074[/C][C]0.311537[/C][/ROW]
[ROW][C]M5[/C][C]2.38507809879669[/C][C]23.811546[/C][C]0.1002[/C][C]0.920649[/C][C]0.460324[/C][/ROW]
[ROW][C]M6[/C][C]-15.0230923144787[/C][C]23.807123[/C][C]-0.631[/C][C]0.531142[/C][C]0.265571[/C][/ROW]
[ROW][C]M7[/C][C]-17.0312627277541[/C][C]23.813765[/C][C]-0.7152[/C][C]0.478109[/C][C]0.239054[/C][/ROW]
[ROW][C]M8[/C][C]-20.4421040593307[/C][C]23.84392[/C][C]-0.8573[/C][C]0.395707[/C][C]0.197854[/C][/ROW]
[ROW][C]M9[/C][C]-24.0502744726061[/C][C]23.875125[/C][C]-1.0073[/C][C]0.319043[/C][C]0.159521[/C][/ROW]
[ROW][C]M10[/C][C]-26.4477612126768[/C][C]23.852521[/C][C]-1.1088[/C][C]0.273279[/C][C]0.136639[/C][/ROW]
[ROW][C]M11[/C][C]-13.6345642795430[/C][C]23.785193[/C][C]-0.5732[/C][C]0.569276[/C][C]0.284638[/C][/ROW]
[ROW][C]t[/C][C]6.8081704132754[/C][C]0.513265[/C][C]13.2644[/C][C]0[/C][C]0[/C][/ROW]
[/TABLE]
Source: https://freestatistics.org/blog/index.php?pk=14674&T=2

Globally Unique Identifier (entire table): ba.freestatistics.org/blog/index.php?pk=14674&T=2

As an alternative you can also use a QR Code:  

The GUIDs for individual cells are displayed in the table below:

Multiple Linear Regression - Ordinary Least Squares
VariableParameterS.D.T-STATH0: parameter = 02-tail p-value1-tail p-value
(Intercept)464.53512528578872.4470086.412100
Dollar-201.33545915057669.74492-2.88670.0059110.002956
M10.18837965058550323.929250.00790.9937530.496876
M2-5.2251325992920823.921849-0.21840.8280640.414032
M3-12.230632094266323.907015-0.51160.6113840.305692
M4-11.844144344144023.935706-0.49480.6230740.311537
M52.3850780987966923.8115460.10020.9206490.460324
M6-15.023092314478723.807123-0.6310.5311420.265571
M7-17.031262727754123.813765-0.71520.4781090.239054
M8-20.442104059330723.84392-0.85730.3957070.197854
M9-24.050274472606123.875125-1.00730.3190430.159521
M10-26.447761212676823.852521-1.10880.2732790.136639
M11-13.634564279543023.785193-0.57320.5692760.284638
t6.80817041327540.51326513.264400


Multiple Linear Regression - Regression Statistics
Multiple R0.947398294138828
R-squared0.897563527737161
Adjusted R-squared0.86861408992375
F-TEST (value)31.0045235946295
F-TEST (DF numerator)13
F-TEST (DF denominator)46
p-value0
Multiple Linear Regression - Residual Statistics
Residual Standard Deviation37.4965170883353
Sum Squared Residuals64675.4845127679

\begin{tabular}{lllllllll}
\hline
Multiple Linear Regression - Regression Statistics \tabularnewline
Multiple R & 0.947398294138828 \tabularnewline
R-squared & 0.897563527737161 \tabularnewline
Adjusted R-squared & 0.86861408992375 \tabularnewline
F-TEST (value) & 31.0045235946295 \tabularnewline
F-TEST (DF numerator) & 13 \tabularnewline
F-TEST (DF denominator) & 46 \tabularnewline
p-value & 0 \tabularnewline
Multiple Linear Regression - Residual Statistics \tabularnewline
Residual Standard Deviation & 37.4965170883353 \tabularnewline
Sum Squared Residuals & 64675.4845127679 \tabularnewline
\hline
\end{tabular}
%Source: https://freestatistics.org/blog/index.php?pk=14674&T=3

[TABLE]
[ROW][C]Multiple Linear Regression - Regression Statistics[/C][/ROW]
[ROW][C]Multiple R[/C][C]0.947398294138828[/C][/ROW]
[ROW][C]R-squared[/C][C]0.897563527737161[/C][/ROW]
[ROW][C]Adjusted R-squared[/C][C]0.86861408992375[/C][/ROW]
[ROW][C]F-TEST (value)[/C][C]31.0045235946295[/C][/ROW]
[ROW][C]F-TEST (DF numerator)[/C][C]13[/C][/ROW]
[ROW][C]F-TEST (DF denominator)[/C][C]46[/C][/ROW]
[ROW][C]p-value[/C][C]0[/C][/ROW]
[ROW][C]Multiple Linear Regression - Residual Statistics[/C][/ROW]
[ROW][C]Residual Standard Deviation[/C][C]37.4965170883353[/C][/ROW]
[ROW][C]Sum Squared Residuals[/C][C]64675.4845127679[/C][/ROW]
[/TABLE]
Source: https://freestatistics.org/blog/index.php?pk=14674&T=3

Globally Unique Identifier (entire table): ba.freestatistics.org/blog/index.php?pk=14674&T=3

As an alternative you can also use a QR Code:  

The GUIDs for individual cells are displayed in the table below:

Multiple Linear Regression - Regression Statistics
Multiple R0.947398294138828
R-squared0.897563527737161
Adjusted R-squared0.86861408992375
F-TEST (value)31.0045235946295
F-TEST (DF numerator)13
F-TEST (DF denominator)46
p-value0
Multiple Linear Regression - Residual Statistics
Residual Standard Deviation37.4965170883353
Sum Squared Residuals64675.4845127679


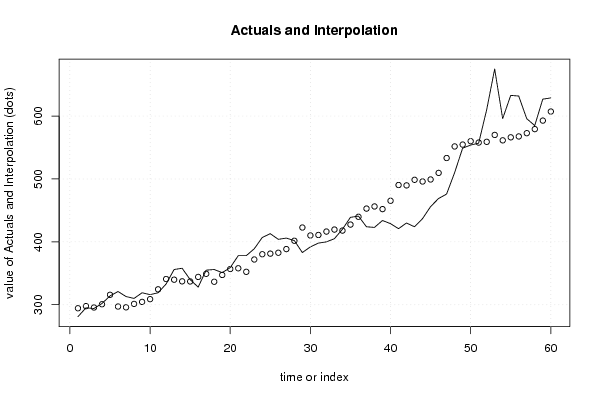
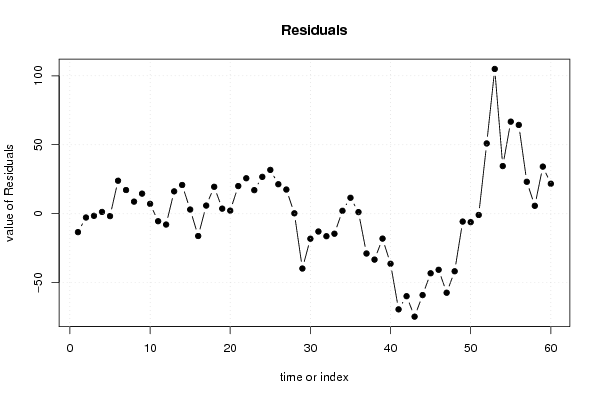
Multiple Linear Regression - Actuals, Interpolation, and Residuals
Time or IndexActualsInterpolationForecastResidualsPrediction Error
1281294.356471297143-13.356471297143
2295297.764484052046-2.76448405204596
3294295.553800378841-1.55380037884134
4302300.7351039507331.26489604926680
5314315.732433032432-1.73243303243211
6321297.07901466640923.9209853335909
7313295.83895089189217.1610491081082
8310301.2496345650968.75036543490361
9319304.44963456509614.5503654349036
10316308.8603182383017.139681761699
11319324.454976401699-5.4549764016987
12333340.871001911506-7.87100191150561
13356339.81413360934316.1858663906565
14358337.18208258973020.8179174102703
15340336.9847535080313.01524649196910
16328344.179411671429-16.1794116714286
17355349.1099677955995.89003220440132
18356336.49661320409319.5033867959071
19351347.336676978613.6633230213898
20359356.7740698348262.2259301651737
21378357.96071524332120.0392847566795
22378352.30462595899625.6953740410036
23389371.92599330540617.0740066945944
24407380.28860044918926.7113995508106
25413381.24508673853331.754913261467
26404382.63974490193121.3602550980691
27406388.48247959474917.5175204052507
28402401.7172015326640.282798467335687
29383422.75459438888-39.7545943888804
30392410.141239797375-18.1412397973747
31398410.914530614363-12.9145306143631
32400416.325214287568-16.3252142875677
33405419.525214287568-14.5252142875677
34420417.8958341862552.10416581374494
35439427.45042857513511.5495714248645
36441439.8397449019311.16025509806913
37424452.876358740309-28.876358740309
38423456.284371495213-33.2843714952126
39434452.060333230502-18.0603332305022
40429465.295055168417-36.2950551684173
41421490.359157207645-69.3591572076449
42430489.825930165174-59.8259301651737
43424498.652639348185-74.6526393481852
44437496.009904655367-59.0099046553668
45456499.209904655367-43.2099046553668
46469509.660652103089-40.6606521030887
47476533.308728632509-57.3087286325095
48510551.738108733822-41.7381087338221
49549554.707949614672-5.7079496146715
50554560.129316961081-6.12931696108084
51557557.918633287876-0.9186332878762
52610559.07322767675750.9267723232434
53675570.043847575444104.956152424556
54596561.4572021669534.5427978330503
55633566.2572021669566.7427978330503
56632567.64117665714364.3588233428572
57596572.85453124864923.1454687513515
58585579.2785695133595.7214304866411
59627592.85987308525134.1401269147492
60629607.26254400355221.737455996448

\begin{tabular}{lllllllll}
\hline
Multiple Linear Regression - Actuals, Interpolation, and Residuals \tabularnewline
Time or Index & Actuals & InterpolationForecast & ResidualsPrediction Error \tabularnewline
1 & 281 & 294.356471297143 & -13.356471297143 \tabularnewline
2 & 295 & 297.764484052046 & -2.76448405204596 \tabularnewline
3 & 294 & 295.553800378841 & -1.55380037884134 \tabularnewline
4 & 302 & 300.735103950733 & 1.26489604926680 \tabularnewline
5 & 314 & 315.732433032432 & -1.73243303243211 \tabularnewline
6 & 321 & 297.079014666409 & 23.9209853335909 \tabularnewline
7 & 313 & 295.838950891892 & 17.1610491081082 \tabularnewline
8 & 310 & 301.249634565096 & 8.75036543490361 \tabularnewline
9 & 319 & 304.449634565096 & 14.5503654349036 \tabularnewline
10 & 316 & 308.860318238301 & 7.139681761699 \tabularnewline
11 & 319 & 324.454976401699 & -5.4549764016987 \tabularnewline
12 & 333 & 340.871001911506 & -7.87100191150561 \tabularnewline
13 & 356 & 339.814133609343 & 16.1858663906565 \tabularnewline
14 & 358 & 337.182082589730 & 20.8179174102703 \tabularnewline
15 & 340 & 336.984753508031 & 3.01524649196910 \tabularnewline
16 & 328 & 344.179411671429 & -16.1794116714286 \tabularnewline
17 & 355 & 349.109967795599 & 5.89003220440132 \tabularnewline
18 & 356 & 336.496613204093 & 19.5033867959071 \tabularnewline
19 & 351 & 347.33667697861 & 3.6633230213898 \tabularnewline
20 & 359 & 356.774069834826 & 2.2259301651737 \tabularnewline
21 & 378 & 357.960715243321 & 20.0392847566795 \tabularnewline
22 & 378 & 352.304625958996 & 25.6953740410036 \tabularnewline
23 & 389 & 371.925993305406 & 17.0740066945944 \tabularnewline
24 & 407 & 380.288600449189 & 26.7113995508106 \tabularnewline
25 & 413 & 381.245086738533 & 31.754913261467 \tabularnewline
26 & 404 & 382.639744901931 & 21.3602550980691 \tabularnewline
27 & 406 & 388.482479594749 & 17.5175204052507 \tabularnewline
28 & 402 & 401.717201532664 & 0.282798467335687 \tabularnewline
29 & 383 & 422.75459438888 & -39.7545943888804 \tabularnewline
30 & 392 & 410.141239797375 & -18.1412397973747 \tabularnewline
31 & 398 & 410.914530614363 & -12.9145306143631 \tabularnewline
32 & 400 & 416.325214287568 & -16.3252142875677 \tabularnewline
33 & 405 & 419.525214287568 & -14.5252142875677 \tabularnewline
34 & 420 & 417.895834186255 & 2.10416581374494 \tabularnewline
35 & 439 & 427.450428575135 & 11.5495714248645 \tabularnewline
36 & 441 & 439.839744901931 & 1.16025509806913 \tabularnewline
37 & 424 & 452.876358740309 & -28.876358740309 \tabularnewline
38 & 423 & 456.284371495213 & -33.2843714952126 \tabularnewline
39 & 434 & 452.060333230502 & -18.0603332305022 \tabularnewline
40 & 429 & 465.295055168417 & -36.2950551684173 \tabularnewline
41 & 421 & 490.359157207645 & -69.3591572076449 \tabularnewline
42 & 430 & 489.825930165174 & -59.8259301651737 \tabularnewline
43 & 424 & 498.652639348185 & -74.6526393481852 \tabularnewline
44 & 437 & 496.009904655367 & -59.0099046553668 \tabularnewline
45 & 456 & 499.209904655367 & -43.2099046553668 \tabularnewline
46 & 469 & 509.660652103089 & -40.6606521030887 \tabularnewline
47 & 476 & 533.308728632509 & -57.3087286325095 \tabularnewline
48 & 510 & 551.738108733822 & -41.7381087338221 \tabularnewline
49 & 549 & 554.707949614672 & -5.7079496146715 \tabularnewline
50 & 554 & 560.129316961081 & -6.12931696108084 \tabularnewline
51 & 557 & 557.918633287876 & -0.9186332878762 \tabularnewline
52 & 610 & 559.073227676757 & 50.9267723232434 \tabularnewline
53 & 675 & 570.043847575444 & 104.956152424556 \tabularnewline
54 & 596 & 561.45720216695 & 34.5427978330503 \tabularnewline
55 & 633 & 566.25720216695 & 66.7427978330503 \tabularnewline
56 & 632 & 567.641176657143 & 64.3588233428572 \tabularnewline
57 & 596 & 572.854531248649 & 23.1454687513515 \tabularnewline
58 & 585 & 579.278569513359 & 5.7214304866411 \tabularnewline
59 & 627 & 592.859873085251 & 34.1401269147492 \tabularnewline
60 & 629 & 607.262544003552 & 21.737455996448 \tabularnewline
\hline
\end{tabular}
%Source: https://freestatistics.org/blog/index.php?pk=14674&T=4

[TABLE]
[ROW][C]Multiple Linear Regression - Actuals, Interpolation, and Residuals[/C][/ROW]
[ROW][C]Time or Index[/C][C]Actuals[/C][C]InterpolationForecast[/C][C]ResidualsPrediction Error[/C][/ROW]
[ROW][C]1[/C][C]281[/C][C]294.356471297143[/C][C]-13.356471297143[/C][/ROW]
[ROW][C]2[/C][C]295[/C][C]297.764484052046[/C][C]-2.76448405204596[/C][/ROW]
[ROW][C]3[/C][C]294[/C][C]295.553800378841[/C][C]-1.55380037884134[/C][/ROW]
[ROW][C]4[/C][C]302[/C][C]300.735103950733[/C][C]1.26489604926680[/C][/ROW]
[ROW][C]5[/C][C]314[/C][C]315.732433032432[/C][C]-1.73243303243211[/C][/ROW]
[ROW][C]6[/C][C]321[/C][C]297.079014666409[/C][C]23.9209853335909[/C][/ROW]
[ROW][C]7[/C][C]313[/C][C]295.838950891892[/C][C]17.1610491081082[/C][/ROW]
[ROW][C]8[/C][C]310[/C][C]301.249634565096[/C][C]8.75036543490361[/C][/ROW]
[ROW][C]9[/C][C]319[/C][C]304.449634565096[/C][C]14.5503654349036[/C][/ROW]
[ROW][C]10[/C][C]316[/C][C]308.860318238301[/C][C]7.139681761699[/C][/ROW]
[ROW][C]11[/C][C]319[/C][C]324.454976401699[/C][C]-5.4549764016987[/C][/ROW]
[ROW][C]12[/C][C]333[/C][C]340.871001911506[/C][C]-7.87100191150561[/C][/ROW]
[ROW][C]13[/C][C]356[/C][C]339.814133609343[/C][C]16.1858663906565[/C][/ROW]
[ROW][C]14[/C][C]358[/C][C]337.182082589730[/C][C]20.8179174102703[/C][/ROW]
[ROW][C]15[/C][C]340[/C][C]336.984753508031[/C][C]3.01524649196910[/C][/ROW]
[ROW][C]16[/C][C]328[/C][C]344.179411671429[/C][C]-16.1794116714286[/C][/ROW]
[ROW][C]17[/C][C]355[/C][C]349.109967795599[/C][C]5.89003220440132[/C][/ROW]
[ROW][C]18[/C][C]356[/C][C]336.496613204093[/C][C]19.5033867959071[/C][/ROW]
[ROW][C]19[/C][C]351[/C][C]347.33667697861[/C][C]3.6633230213898[/C][/ROW]
[ROW][C]20[/C][C]359[/C][C]356.774069834826[/C][C]2.2259301651737[/C][/ROW]
[ROW][C]21[/C][C]378[/C][C]357.960715243321[/C][C]20.0392847566795[/C][/ROW]
[ROW][C]22[/C][C]378[/C][C]352.304625958996[/C][C]25.6953740410036[/C][/ROW]
[ROW][C]23[/C][C]389[/C][C]371.925993305406[/C][C]17.0740066945944[/C][/ROW]
[ROW][C]24[/C][C]407[/C][C]380.288600449189[/C][C]26.7113995508106[/C][/ROW]
[ROW][C]25[/C][C]413[/C][C]381.245086738533[/C][C]31.754913261467[/C][/ROW]
[ROW][C]26[/C][C]404[/C][C]382.639744901931[/C][C]21.3602550980691[/C][/ROW]
[ROW][C]27[/C][C]406[/C][C]388.482479594749[/C][C]17.5175204052507[/C][/ROW]
[ROW][C]28[/C][C]402[/C][C]401.717201532664[/C][C]0.282798467335687[/C][/ROW]
[ROW][C]29[/C][C]383[/C][C]422.75459438888[/C][C]-39.7545943888804[/C][/ROW]
[ROW][C]30[/C][C]392[/C][C]410.141239797375[/C][C]-18.1412397973747[/C][/ROW]
[ROW][C]31[/C][C]398[/C][C]410.914530614363[/C][C]-12.9145306143631[/C][/ROW]
[ROW][C]32[/C][C]400[/C][C]416.325214287568[/C][C]-16.3252142875677[/C][/ROW]
[ROW][C]33[/C][C]405[/C][C]419.525214287568[/C][C]-14.5252142875677[/C][/ROW]
[ROW][C]34[/C][C]420[/C][C]417.895834186255[/C][C]2.10416581374494[/C][/ROW]
[ROW][C]35[/C][C]439[/C][C]427.450428575135[/C][C]11.5495714248645[/C][/ROW]
[ROW][C]36[/C][C]441[/C][C]439.839744901931[/C][C]1.16025509806913[/C][/ROW]
[ROW][C]37[/C][C]424[/C][C]452.876358740309[/C][C]-28.876358740309[/C][/ROW]
[ROW][C]38[/C][C]423[/C][C]456.284371495213[/C][C]-33.2843714952126[/C][/ROW]
[ROW][C]39[/C][C]434[/C][C]452.060333230502[/C][C]-18.0603332305022[/C][/ROW]
[ROW][C]40[/C][C]429[/C][C]465.295055168417[/C][C]-36.2950551684173[/C][/ROW]
[ROW][C]41[/C][C]421[/C][C]490.359157207645[/C][C]-69.3591572076449[/C][/ROW]
[ROW][C]42[/C][C]430[/C][C]489.825930165174[/C][C]-59.8259301651737[/C][/ROW]
[ROW][C]43[/C][C]424[/C][C]498.652639348185[/C][C]-74.6526393481852[/C][/ROW]
[ROW][C]44[/C][C]437[/C][C]496.009904655367[/C][C]-59.0099046553668[/C][/ROW]
[ROW][C]45[/C][C]456[/C][C]499.209904655367[/C][C]-43.2099046553668[/C][/ROW]
[ROW][C]46[/C][C]469[/C][C]509.660652103089[/C][C]-40.6606521030887[/C][/ROW]
[ROW][C]47[/C][C]476[/C][C]533.308728632509[/C][C]-57.3087286325095[/C][/ROW]
[ROW][C]48[/C][C]510[/C][C]551.738108733822[/C][C]-41.7381087338221[/C][/ROW]
[ROW][C]49[/C][C]549[/C][C]554.707949614672[/C][C]-5.7079496146715[/C][/ROW]
[ROW][C]50[/C][C]554[/C][C]560.129316961081[/C][C]-6.12931696108084[/C][/ROW]
[ROW][C]51[/C][C]557[/C][C]557.918633287876[/C][C]-0.9186332878762[/C][/ROW]
[ROW][C]52[/C][C]610[/C][C]559.073227676757[/C][C]50.9267723232434[/C][/ROW]
[ROW][C]53[/C][C]675[/C][C]570.043847575444[/C][C]104.956152424556[/C][/ROW]
[ROW][C]54[/C][C]596[/C][C]561.45720216695[/C][C]34.5427978330503[/C][/ROW]
[ROW][C]55[/C][C]633[/C][C]566.25720216695[/C][C]66.7427978330503[/C][/ROW]
[ROW][C]56[/C][C]632[/C][C]567.641176657143[/C][C]64.3588233428572[/C][/ROW]
[ROW][C]57[/C][C]596[/C][C]572.854531248649[/C][C]23.1454687513515[/C][/ROW]
[ROW][C]58[/C][C]585[/C][C]579.278569513359[/C][C]5.7214304866411[/C][/ROW]
[ROW][C]59[/C][C]627[/C][C]592.859873085251[/C][C]34.1401269147492[/C][/ROW]
[ROW][C]60[/C][C]629[/C][C]607.262544003552[/C][C]21.737455996448[/C][/ROW]
[/TABLE]
Source: https://freestatistics.org/blog/index.php?pk=14674&T=4

Globally Unique Identifier (entire table): ba.freestatistics.org/blog/index.php?pk=14674&T=4

As an alternative you can also use a QR Code:  

The GUIDs for individual cells are displayed in the table below:

Multiple Linear Regression - Actuals, Interpolation, and Residuals
Time or IndexActualsInterpolationForecastResidualsPrediction Error
1281294.356471297143-13.356471297143
2295297.764484052046-2.76448405204596
3294295.553800378841-1.55380037884134
4302300.7351039507331.26489604926680
5314315.732433032432-1.73243303243211
6321297.07901466640923.9209853335909
7313295.83895089189217.1610491081082
8310301.2496345650968.75036543490361
9319304.44963456509614.5503654349036
10316308.8603182383017.139681761699
11319324.454976401699-5.4549764016987
12333340.871001911506-7.87100191150561
13356339.81413360934316.1858663906565
14358337.18208258973020.8179174102703
15340336.9847535080313.01524649196910
16328344.179411671429-16.1794116714286
17355349.1099677955995.89003220440132
18356336.49661320409319.5033867959071
19351347.336676978613.6633230213898
20359356.7740698348262.2259301651737
21378357.96071524332120.0392847566795
22378352.30462595899625.6953740410036
23389371.92599330540617.0740066945944
24407380.28860044918926.7113995508106
25413381.24508673853331.754913261467
26404382.63974490193121.3602550980691
27406388.48247959474917.5175204052507
28402401.7172015326640.282798467335687
29383422.75459438888-39.7545943888804
30392410.141239797375-18.1412397973747
31398410.914530614363-12.9145306143631
32400416.325214287568-16.3252142875677
33405419.525214287568-14.5252142875677
34420417.8958341862552.10416581374494
35439427.45042857513511.5495714248645
36441439.8397449019311.16025509806913
37424452.876358740309-28.876358740309
38423456.284371495213-33.2843714952126
39434452.060333230502-18.0603332305022
40429465.295055168417-36.2950551684173
41421490.359157207645-69.3591572076449
42430489.825930165174-59.8259301651737
43424498.652639348185-74.6526393481852
44437496.009904655367-59.0099046553668
45456499.209904655367-43.2099046553668
46469509.660652103089-40.6606521030887
47476533.308728632509-57.3087286325095
48510551.738108733822-41.7381087338221
49549554.707949614672-5.7079496146715
50554560.129316961081-6.12931696108084
51557557.918633287876-0.9186332878762
52610559.07322767675750.9267723232434
53675570.043847575444104.956152424556
54596561.4572021669534.5427978330503
55633566.2572021669566.7427978330503
56632567.64117665714364.3588233428572
57596572.85453124864923.1454687513515
58585579.2785695133595.7214304866411
59627592.85987308525134.1401269147492
60629607.26254400355221.737455996448


Parameters (Session):
par1 = 1 ; par2 = Do not include Seasonal Dummies ; par3 = No Linear Trend ;
Parameters (R input):
par1 = 1 ; par2 = Include Monthly Dummies ; par3 = Linear Trend ;
R code (references can be found in the software module):
library(lattice)
par1 <- as.numeric(par1)
x <- t(y)
k <- length(x[1,])
n <- length(x[,1])
x1 <- cbind(x[,par1], x[,1:k!=par1])
mycolnames <- c(colnames(x)[par1], colnames(x)[1:k!=par1])
colnames(x1) <- mycolnames #colnames(x)[par1]
x <- x1
if (par3 == 'First Differences'){
x2 <- array(0, dim=c(n-1,k), dimnames=list(1:(n-1), paste('(1-B)',colnames(x),sep='')))
for (i in 1:n-1) {
for (j in 1:k) {
x2[i,j] <- x[i+1,j] - x[i,j]
}
}
x <- x2
}
if (par2 == 'Include Monthly Dummies'){
x2 <- array(0, dim=c(n,11), dimnames=list(1:n, paste('M', seq(1:11), sep ='')))
for (i in 1:11){
x2[seq(i,n,12),i] <- 1
}
x <- cbind(x, x2)
}
if (par2 == 'Include Quarterly Dummies'){
x2 <- array(0, dim=c(n,3), dimnames=list(1:n, paste('Q', seq(1:3), sep ='')))
for (i in 1:3){
x2[seq(i,n,4),i] <- 1
}
x <- cbind(x, x2)
}
k <- length(x[1,])
if (par3 == 'Linear Trend'){
x <- cbind(x, c(1:n))
colnames(x)[k+1] <- 't'
}
x
k <- length(x[1,])
df <- as.data.frame(x)
(mylm <- lm(df))
(mysum <- summary(mylm))
bitmap(file='test0.png')
plot(x[,1], type='l', main='Actuals and Interpolation', ylab='value of Actuals and Interpolation (dots)', xlab='time or index')
points(x[,1]-mysum$resid)
grid()
dev.off()
bitmap(file='test1.png')
plot(mysum$resid, type='b', pch=19, main='Residuals', ylab='value of Residuals', xlab='time or index')
grid()
dev.off()
bitmap(file='test2.png')
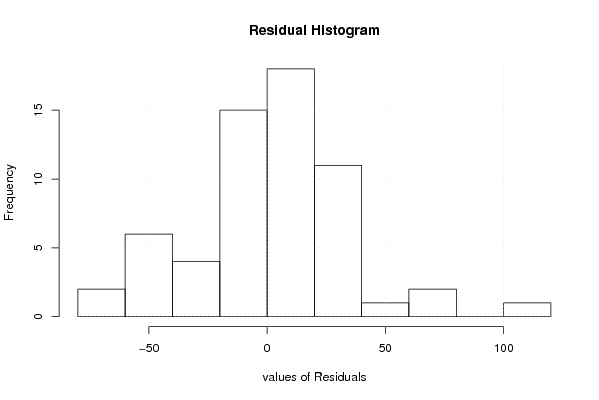
hist(mysum$resid, main='Residual Histogram', xlab='values of Residuals')
grid()
dev.off()
bitmap(file='test3.png')
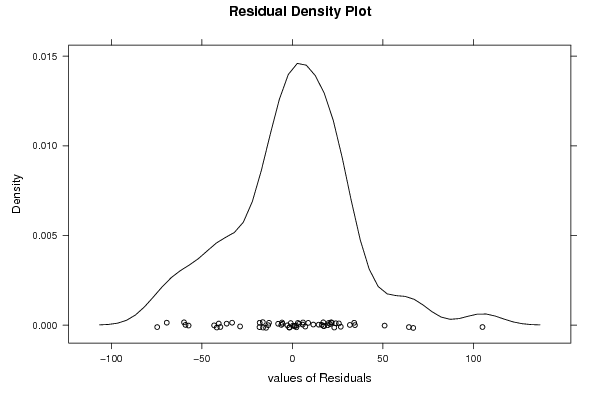
densityplot(~mysum$resid,col='black',main='Residual Density Plot', xlab='values of Residuals')
dev.off()
bitmap(file='test4.png')
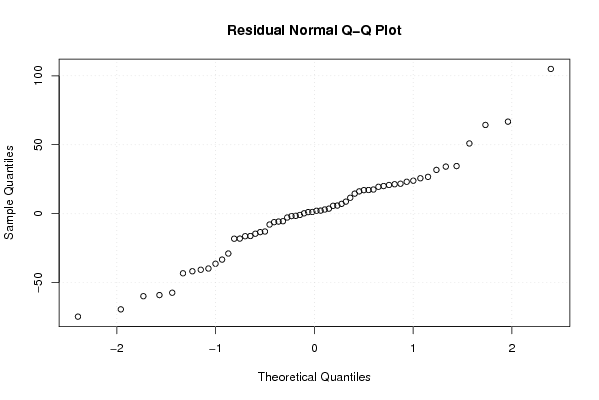
qqnorm(mysum$resid, main='Residual Normal Q-Q Plot')
grid()
dev.off()
(myerror <- as.ts(mysum$resid))
bitmap(file='test5.png')
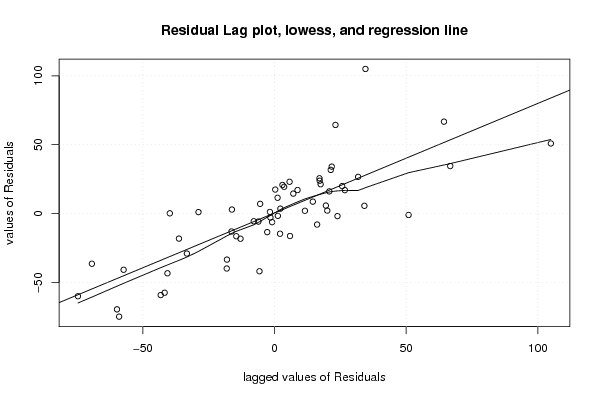
dum <- cbind(lag(myerror,k=1),myerror)
dum
dum1 <- dum[2:length(myerror),]
dum1
z <- as.data.frame(dum1)
z
plot(z,main=paste('Residual Lag plot, lowess, and regression line'), ylab='values of Residuals', xlab='lagged values of Residuals')
lines(lowess(z))
abline(lm(z))
grid()
dev.off()
bitmap(file='test6.png')
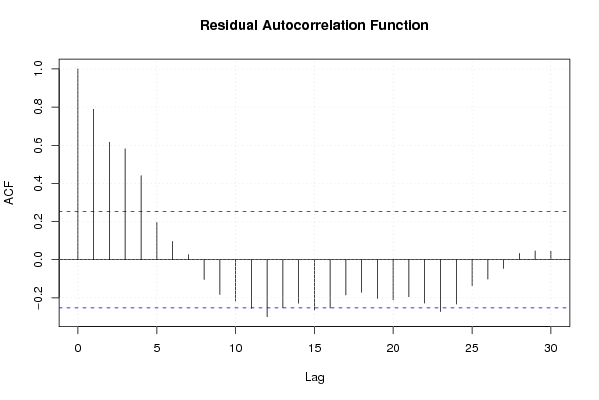
acf(mysum$resid, lag.max=length(mysum$resid)/2, main='Residual Autocorrelation Function')
grid()
dev.off()
bitmap(file='test7.png')
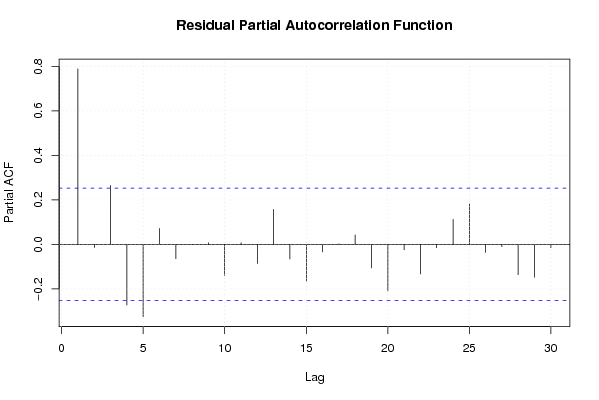
pacf(mysum$resid, lag.max=length(mysum$resid)/2, main='Residual Partial Autocorrelation Function')
grid()
dev.off()
bitmap(file='test8.png')
opar <- par(mfrow = c(2,2), oma = c(0, 0, 1.1, 0))
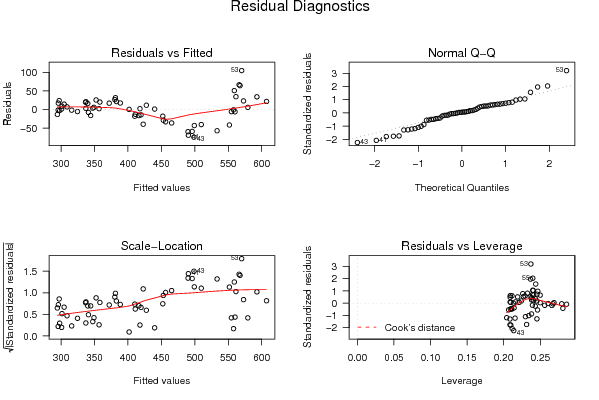
plot(mylm, las = 1, sub='Residual Diagnostics')
par(opar)
dev.off()
load(file='createtable')
a<-table.start()
a<-table.row.start(a)
a<-table.element(a, 'Multiple Linear Regression - Estimated Regression Equation', 1, TRUE)
a<-table.row.end(a)
myeq <- colnames(x)[1]
myeq <- paste(myeq, '[t] = ', sep='')
for (i in 1:k){
if (mysum$coefficients[i,1] > 0) myeq <- paste(myeq, '+', '')
myeq <- paste(myeq, mysum$coefficients[i,1], sep=' ')
if (rownames(mysum$coefficients)[i] != '(Intercept)') {
myeq <- paste(myeq, rownames(mysum$coefficients)[i], sep='')
if (rownames(mysum$coefficients)[i] != 't') myeq <- paste(myeq, '[t]', sep='')
}
}
myeq <- paste(myeq, ' + e[t]')
a<-table.row.start(a)
a<-table.element(a, myeq)
a<-table.row.end(a)
a<-table.end(a)
table.save(a,file='mytable1.tab')
a<-table.start()
a<-table.row.start(a)
a<-table.element(a,hyperlink('ols1.htm','Multiple Linear Regression - Ordinary Least Squares',''), 6, TRUE)
a<-table.row.end(a)
a<-table.row.start(a)
a<-table.element(a,'Variable',header=TRUE)
a<-table.element(a,'Parameter',header=TRUE)
a<-table.element(a,'S.D.',header=TRUE)
a<-table.element(a,'T-STAT
H0: parameter = 0',header=TRUE)
a<-table.element(a,'2-tail p-value',header=TRUE)
a<-table.element(a,'1-tail p-value',header=TRUE)
a<-table.row.end(a)
for (i in 1:k){
a<-table.row.start(a)
a<-table.element(a,rownames(mysum$coefficients)[i],header=TRUE)
a<-table.element(a,mysum$coefficients[i,1])
a<-table.element(a, round(mysum$coefficients[i,2],6))
a<-table.element(a, round(mysum$coefficients[i,3],4))
a<-table.element(a, round(mysum$coefficients[i,4],6))
a<-table.element(a, round(mysum$coefficients[i,4]/2,6))
a<-table.row.end(a)
}
a<-table.end(a)
table.save(a,file='mytable2.tab')
a<-table.start()
a<-table.row.start(a)
a<-table.element(a, 'Multiple Linear Regression - Regression Statistics', 2, TRUE)
a<-table.row.end(a)
a<-table.row.start(a)
a<-table.element(a, 'Multiple R',1,TRUE)
a<-table.element(a, sqrt(mysum$r.squared))
a<-table.row.end(a)
a<-table.row.start(a)
a<-table.element(a, 'R-squared',1,TRUE)
a<-table.element(a, mysum$r.squared)
a<-table.row.end(a)
a<-table.row.start(a)
a<-table.element(a, 'Adjusted R-squared',1,TRUE)
a<-table.element(a, mysum$adj.r.squared)
a<-table.row.end(a)
a<-table.row.start(a)
a<-table.element(a, 'F-TEST (value)',1,TRUE)
a<-table.element(a, mysum$fstatistic[1])
a<-table.row.end(a)
a<-table.row.start(a)
a<-table.element(a, 'F-TEST (DF numerator)',1,TRUE)
a<-table.element(a, mysum$fstatistic[2])
a<-table.row.end(a)
a<-table.row.start(a)
a<-table.element(a, 'F-TEST (DF denominator)',1,TRUE)
a<-table.element(a, mysum$fstatistic[3])
a<-table.row.end(a)
a<-table.row.start(a)
a<-table.element(a, 'p-value',1,TRUE)
a<-table.element(a, 1-pf(mysum$fstatistic[1],mysum$fstatistic[2],mysum$fstatistic[3]))
a<-table.row.end(a)
a<-table.row.start(a)
a<-table.element(a, 'Multiple Linear Regression - Residual Statistics', 2, TRUE)
a<-table.row.end(a)
a<-table.row.start(a)
a<-table.element(a, 'Residual Standard Deviation',1,TRUE)
a<-table.element(a, mysum$sigma)
a<-table.row.end(a)
a<-table.row.start(a)
a<-table.element(a, 'Sum Squared Residuals',1,TRUE)
a<-table.element(a, sum(myerror*myerror))
a<-table.row.end(a)
a<-table.end(a)
table.save(a,file='mytable3.tab')
a<-table.start()
a<-table.row.start(a)
a<-table.element(a, 'Multiple Linear Regression - Actuals, Interpolation, and Residuals', 4, TRUE)
a<-table.row.end(a)
a<-table.row.start(a)
a<-table.element(a, 'Time or Index', 1, TRUE)
a<-table.element(a, 'Actuals', 1, TRUE)
a<-table.element(a, 'Interpolation
Forecast', 1, TRUE)
a<-table.element(a, 'Residuals
Prediction Error', 1, TRUE)
a<-table.row.end(a)
for (i in 1:n) {
a<-table.row.start(a)
a<-table.element(a,i, 1, TRUE)
a<-table.element(a,x[i])
a<-table.element(a,x[i]-mysum$resid[i])
a<-table.element(a,mysum$resid[i])
a<-table.row.end(a)
}
a<-table.end(a)
table.save(a,file='mytable4.tab')