Free Statistics

of Irreproducible Research!

Author's title

Author*Unverified author*
R Software Modulerwasp_pairs.wasp
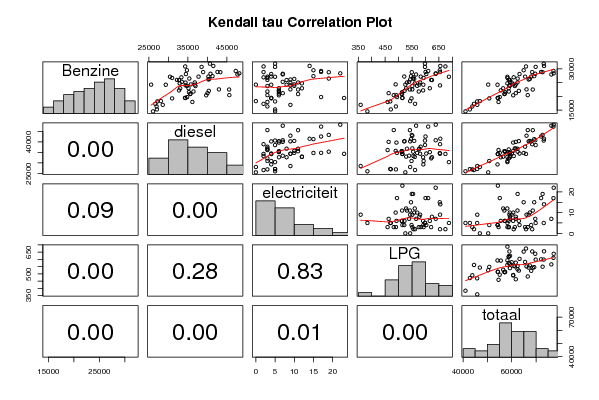
Title produced by softwareKendall tau Correlation Matrix
Date of computationWed, 16 Jan 2008 11:46:03 -0700
Cite this page as followsStatistical Computations at FreeStatistics.org, Office for Research Development and Education, URL https://freestatistics.org/blog/index.php?v=date/2008/Jan/16/t1200508900725k3cjzgxwo3hn.htm/, Retrieved Wed, 15 May 2024 14:11:07 +0000
Statistical Computations at FreeStatistics.org, Office for Research Development and Education, URL https://freestatistics.org/blog/index.php?pk=8001, Retrieved Wed, 15 May 2024 14:11:07 +0000
QR Codes:

Original text written by user:
IsPrivate?No (this computation is public)
User-defined keywords
Estimated Impact276
Family? (F = Feedback message, R = changed R code, M = changed R Module, P = changed Parameters, D = changed Data)
-       [Kendall tau Correlation Matrix] [correlation matrix] [2008-01-16 18:46:03] [d02236afd58a58d13a748bbf41a37c2e] [Current]
Feedback Forum

Post a new message
Dataseries X:
21797	36429	3	575	58804
22209	32720	6	591	55526
28135	34490	4	603	63232
29512	34749	15	653	64929
26714	30945	3	593	58255
30899	34302	2	674	65877
27148	30400	5	687	58240
24288	25543	0	525	50356
26019	32188	3	621	58831
24007	34395	9	654	59065
18195	27148	5	469	45817
17323	26634	2	561	44520
19504	34257	4	514	54279
23859	34794	10	569	59232
28852	38927	2	654	68435
30746	38512	5	598	69861
26956	33325	2	555	60838
31905	40658	5	598	73166
25956	32719	8	624	59307
24255	29323	4	592	54174
25045	34384	9	580	60018
22982	35153	6	616	58757
19304	30937	4	548	50793
18294	28079	0	543	46916
20417	39703	6	492	60618
21558	35245	6	513	57322
27369	41324	15	546	69254
28240	40802	7	638	69687
27201	37732	3	582	65518
31084	41527	14	655	73280
25306	33441	7	539	59293
24759	32885	12	560	58216
24276	36804	8	577	61665
20862	35593	11	513	56979
19437	34355	23	514	54329
15291	27045	5	471	42812
22515	45587	11	542	68655
22040	40370	6	522	62938
28398	48209	22	638	77267
26158	40275	9	543	66985
25081	36760	11	531	62383
28893	42588	17	600	72098
26504	35365	19	554	62442
22960	33014	12	528	56514
23792	36944	3	551	61290
20995	35649	6	511	57161
19765	34814	17	494	55090
14585	26041	5	384	41015
20480	45636	3	482	66601
21188	40040	7	463	61698
27994	47725	7	565	76291
27229	40263	4	521	68017
28804	43339	19	549	72711
29257	47283	17	610	77167
26377	40492	10	558	67437
24392	35768	10	489	60659
16949	28539	9	359	45856
22566	42971	9	551	66097
18000	36144	3	459	54606
16373	26950	3	490	43816


Summary of compuational transaction
Raw Inputview raw input (R code)
Raw Outputview raw output of R engine
Computing time3 seconds
R Server'Gwilym Jenkins' @ 72.249.127.135

\begin{tabular}{lllllllll}
\hline
Summary of compuational transaction \tabularnewline
Raw Input & view raw input (R code)  \tabularnewline
Raw Output & view raw output of R engine  \tabularnewline
Computing time & 3 seconds \tabularnewline
R Server & 'Gwilym Jenkins' @ 72.249.127.135 \tabularnewline
\hline
\end{tabular}
%Source: https://freestatistics.org/blog/index.php?pk=8001&T=0

[TABLE]
[ROW][C]Summary of compuational transaction[/C][/ROW]
[ROW][C]Raw Input[/C][C]view raw input (R code) [/C][/ROW]
[ROW][C]Raw Output[/C][C]view raw output of R engine [/C][/ROW]
[ROW][C]Computing time[/C][C]3 seconds[/C][/ROW]
[ROW][C]R Server[/C][C]'Gwilym Jenkins' @ 72.249.127.135[/C][/ROW]
[/TABLE]
Source: https://freestatistics.org/blog/index.php?pk=8001&T=0

Globally Unique Identifier (entire table): ba.freestatistics.org/blog/index.php?pk=8001&T=0

As an alternative you can also use a QR Code:  

The GUIDs for individual cells are displayed in the table below:

Summary of compuational transaction
Raw Inputview raw input (R code)
Raw Outputview raw output of R engine
Computing time3 seconds
R Server'Gwilym Jenkins' @ 72.249.127.135


Kendall tau rank correlations for all pairs of data series
pairtaup-value
tau( Benzine , diesel )0.3378531073446330.000136734931062144
tau( Benzine , electriciteit )0.1537374931452440.0909760145264333
tau( Benzine , LPG )0.5542043145197124.24123625109019e-10
tau( Benzine , totaal )0.6406779661016954.73843186910017e-13
tau( diesel , electriciteit )0.2981575624635030.00104507473381488
tau( diesel , LPG )0.09566959055549670.281023344265606
tau( diesel , totaal )0.6971751412429383.5527136788005e-15
tau( electriciteit , LPG )0.01983879374838710.827650481250404
tau( electriciteit , totaal )0.2434176974799690.00744481334641622
tau( LPG , totaal )0.3232386757821810.000270196610456130

\begin{tabular}{lllllllll}
\hline
Kendall tau rank correlations for all pairs of data series \tabularnewline
pair & tau & p-value \tabularnewline
tau( Benzine , diesel ) & 0.337853107344633 & 0.000136734931062144 \tabularnewline
tau( Benzine , electriciteit ) & 0.153737493145244 & 0.0909760145264333 \tabularnewline
tau( Benzine , LPG ) & 0.554204314519712 & 4.24123625109019e-10 \tabularnewline
tau( Benzine , totaal
 ) & 0.640677966101695 & 4.73843186910017e-13 \tabularnewline
tau( diesel , electriciteit ) & 0.298157562463503 & 0.00104507473381488 \tabularnewline
tau( diesel , LPG ) & 0.0956695905554967 & 0.281023344265606 \tabularnewline
tau( diesel , totaal
 ) & 0.697175141242938 & 3.5527136788005e-15 \tabularnewline
tau( electriciteit , LPG ) & 0.0198387937483871 & 0.827650481250404 \tabularnewline
tau( electriciteit , totaal
 ) & 0.243417697479969 & 0.00744481334641622 \tabularnewline
tau( LPG , totaal
 ) & 0.323238675782181 & 0.000270196610456130 \tabularnewline
\hline
\end{tabular}
%Source: https://freestatistics.org/blog/index.php?pk=8001&T=1

[TABLE]
[ROW][C]Kendall tau rank correlations for all pairs of data series[/C][/ROW]
[ROW][C]pair[/C][C]tau[/C][C]p-value[/C][/ROW]
[ROW][C]tau( Benzine , diesel )[/C][C]0.337853107344633[/C][C]0.000136734931062144[/C][/ROW]
[ROW][C]tau( Benzine , electriciteit )[/C][C]0.153737493145244[/C][C]0.0909760145264333[/C][/ROW]
[ROW][C]tau( Benzine , LPG )[/C][C]0.554204314519712[/C][C]4.24123625109019e-10[/C][/ROW]
[ROW][C]tau( Benzine , totaal
 )[/C][C]0.640677966101695[/C][C]4.73843186910017e-13[/C][/ROW]
[ROW][C]tau( diesel , electriciteit )[/C][C]0.298157562463503[/C][C]0.00104507473381488[/C][/ROW]
[ROW][C]tau( diesel , LPG )[/C][C]0.0956695905554967[/C][C]0.281023344265606[/C][/ROW]
[ROW][C]tau( diesel , totaal
 )[/C][C]0.697175141242938[/C][C]3.5527136788005e-15[/C][/ROW]
[ROW][C]tau( electriciteit , LPG )[/C][C]0.0198387937483871[/C][C]0.827650481250404[/C][/ROW]
[ROW][C]tau( electriciteit , totaal
 )[/C][C]0.243417697479969[/C][C]0.00744481334641622[/C][/ROW]
[ROW][C]tau( LPG , totaal
 )[/C][C]0.323238675782181[/C][C]0.000270196610456130[/C][/ROW]
[/TABLE]
Source: https://freestatistics.org/blog/index.php?pk=8001&T=1

Globally Unique Identifier (entire table): ba.freestatistics.org/blog/index.php?pk=8001&T=1

As an alternative you can also use a QR Code:  

The GUIDs for individual cells are displayed in the table below:

Kendall tau rank correlations for all pairs of data series
pairtaup-value
tau( Benzine , diesel )0.3378531073446330.000136734931062144
tau( Benzine , electriciteit )0.1537374931452440.0909760145264333
tau( Benzine , LPG )0.5542043145197124.24123625109019e-10
tau( Benzine , totaal )0.6406779661016954.73843186910017e-13
tau( diesel , electriciteit )0.2981575624635030.00104507473381488
tau( diesel , LPG )0.09566959055549670.281023344265606
tau( diesel , totaal )0.6971751412429383.5527136788005e-15
tau( electriciteit , LPG )0.01983879374838710.827650481250404
tau( electriciteit , totaal )0.2434176974799690.00744481334641622
tau( LPG , totaal )0.3232386757821810.000270196610456130


Parameters (Session):
Parameters (R input):
R code (references can be found in the software module):
panel.tau <- function(x, y, digits=2, prefix='', cex.cor)
{
usr <- par('usr'); on.exit(par(usr))
par(usr = c(0, 1, 0, 1))
rr <- cor.test(x, y, method='kendall')
r <- round(rr$p.value,2)
txt <- format(c(r, 0.123456789), digits=digits)[1]
txt <- paste(prefix, txt, sep='')
if(missing(cex.cor)) cex <- 0.5/strwidth(txt)
text(0.5, 0.5, txt, cex = cex)
}
panel.hist <- function(x, ...)
{
usr <- par('usr'); on.exit(par(usr))
par(usr = c(usr[1:2], 0, 1.5) )
h <- hist(x, plot = FALSE)
breaks <- h$breaks; nB <- length(breaks)
y <- h$counts; y <- y/max(y)
rect(breaks[-nB], 0, breaks[-1], y, col='grey', ...)
}
bitmap(file='test1.png')
pairs(t(y),diag.panel=panel.hist, upper.panel=panel.smooth, lower.panel=panel.tau, main=main)
dev.off()
load(file='createtable')
a<-table.start()
a<-table.row.start(a)
a<-table.element(a,'Kendall tau rank correlations for all pairs of data series',3,TRUE)
a<-table.row.end(a)
a<-table.row.start(a)
a<-table.element(a,'pair',1,TRUE)
a<-table.element(a,'tau',1,TRUE)
a<-table.element(a,'p-value',1,TRUE)
a<-table.row.end(a)
n <- length(y[,1])
n
cor.test(y[1,],y[2,],method='kendall')
for (i in 1:(n-1))
{
for (j in (i+1):n)
{
a<-table.row.start(a)
dum <- paste('tau(',dimnames(t(x))[[2]][i])
dum <- paste(dum,',')
dum <- paste(dum,dimnames(t(x))[[2]][j])
dum <- paste(dum,')')
a<-table.element(a,dum,header=TRUE)
r <- cor.test(y[i,],y[j,],method='kendall')
a<-table.element(a,r$estimate)
a<-table.element(a,r$p.value)
a<-table.row.end(a)
}
}
a<-table.end(a)
table.save(a,file='mytable.tab')