Free Statistics

of Irreproducible Research!

Author's title

Author*Unverified author*
R Software Modulerwasp_autocorrelation.wasp
Title produced by software(Partial) Autocorrelation Function
Date of computationWed, 16 Jan 2008 10:13:52 -0700
Cite this page as followsStatistical Computations at FreeStatistics.org, Office for Research Development and Education, URL https://freestatistics.org/blog/index.php?v=date/2008/Jan/16/t12005034258yruudjrkim75i7.htm/, Retrieved Wed, 15 May 2024 15:10:30 +0000
Statistical Computations at FreeStatistics.org, Office for Research Development and Education, URL https://freestatistics.org/blog/index.php?pk=7996, Retrieved Wed, 15 May 2024 15:10:30 +0000
QR Codes:

Original text written by user:
IsPrivate?No (this computation is public)
User-defined keywords
Estimated Impact283
Family? (F = Feedback message, R = changed R code, M = changed R Module, P = changed Parameters, D = changed Data)
-     [Hierarchical Clustering] [paper] [2007-12-05 22:51:14] [8d3192ea84fef628e5e980e3df2ac42d]
- RMPD    [(Partial) Autocorrelation Function] [] [2008-01-16 17:13:52] [d41d8cd98f00b204e9800998ecf8427e] [Current]
Feedback Forum

Post a new message
Dataseries X:
0.88
0.87
0.88
0.89
0.92
0.96
0.99
0.98
0.98
0.98
1.00
1.02
1.06
1.08
1.08
1.08
1.16
1.17
1.14
1.11
1.12
1.17
1.17
1.23
1.26
1.26
1.23
1.20
1.20
1.21
1.23
1.22
1.22
1.25
1.30
1.34
1.31
1.30
1.32
1.29
1.27
1.22
1.20
1.23
1.23
1.20
1.18
1.19
1.21
1.19
1.20
1.23
1.28
1.27
1.27
1.28
1.27
1.26
1.29
1.32


Summary of compuational transaction
Raw Inputview raw input (R code)
Raw Outputview raw output of R engine
Computing time1 seconds
R Server'Gwilym Jenkins' @ 72.249.127.135

\begin{tabular}{lllllllll}
\hline
Summary of compuational transaction \tabularnewline
Raw Input & view raw input (R code)  \tabularnewline
Raw Output & view raw output of R engine  \tabularnewline
Computing time & 1 seconds \tabularnewline
R Server & 'Gwilym Jenkins' @ 72.249.127.135 \tabularnewline
\hline
\end{tabular}
%Source: https://freestatistics.org/blog/index.php?pk=7996&T=0

[TABLE]
[ROW][C]Summary of compuational transaction[/C][/ROW]
[ROW][C]Raw Input[/C][C]view raw input (R code) [/C][/ROW]
[ROW][C]Raw Output[/C][C]view raw output of R engine [/C][/ROW]
[ROW][C]Computing time[/C][C]1 seconds[/C][/ROW]
[ROW][C]R Server[/C][C]'Gwilym Jenkins' @ 72.249.127.135[/C][/ROW]
[/TABLE]
Source: https://freestatistics.org/blog/index.php?pk=7996&T=0

Globally Unique Identifier (entire table): ba.freestatistics.org/blog/index.php?pk=7996&T=0

As an alternative you can also use a QR Code:  

The GUIDs for individual cells are displayed in the table below:

Summary of compuational transaction
Raw Inputview raw input (R code)
Raw Outputview raw output of R engine
Computing time1 seconds
R Server'Gwilym Jenkins' @ 72.249.127.135


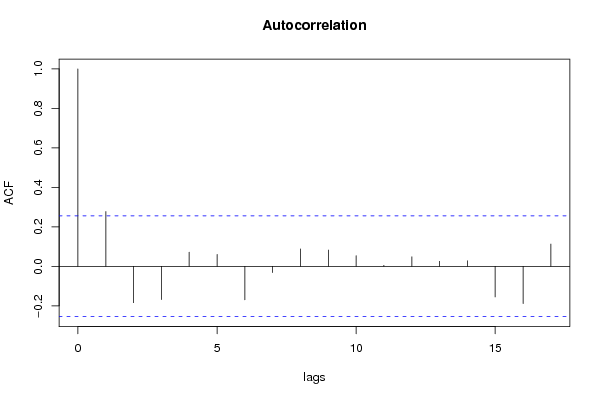
Autocorrelation Function
Time lag kACF(k)T-STATP-value
017.68110
10.277672.13280.018555
2-0.184611-1.4180.919278
3-0.168479-1.29410.899665
40.0715630.54970.292306
50.0600950.46160.323034
6-0.169933-1.30530.901567
7-0.031657-0.24320.595639
80.0878910.67510.251124
90.0824650.63340.264452
100.0537650.4130.340559
110.0050110.03850.484715
120.0481320.36970.356463
130.0253420.19470.423165
140.0279140.21440.415481
15-0.155555-1.19480.881535
16-0.189079-1.45230.924149

\begin{tabular}{lllllllll}
\hline
Autocorrelation Function \tabularnewline
Time lag k & ACF(k) & T-STAT & P-value \tabularnewline
0 & 1 & 7.6811 & 0 \tabularnewline
1 & 0.27767 & 2.1328 & 0.018555 \tabularnewline
2 & -0.184611 & -1.418 & 0.919278 \tabularnewline
3 & -0.168479 & -1.2941 & 0.899665 \tabularnewline
4 & 0.071563 & 0.5497 & 0.292306 \tabularnewline
5 & 0.060095 & 0.4616 & 0.323034 \tabularnewline
6 & -0.169933 & -1.3053 & 0.901567 \tabularnewline
7 & -0.031657 & -0.2432 & 0.595639 \tabularnewline
8 & 0.087891 & 0.6751 & 0.251124 \tabularnewline
9 & 0.082465 & 0.6334 & 0.264452 \tabularnewline
10 & 0.053765 & 0.413 & 0.340559 \tabularnewline
11 & 0.005011 & 0.0385 & 0.484715 \tabularnewline
12 & 0.048132 & 0.3697 & 0.356463 \tabularnewline
13 & 0.025342 & 0.1947 & 0.423165 \tabularnewline
14 & 0.027914 & 0.2144 & 0.415481 \tabularnewline
15 & -0.155555 & -1.1948 & 0.881535 \tabularnewline
16 & -0.189079 & -1.4523 & 0.924149 \tabularnewline
\hline
\end{tabular}
%Source: https://freestatistics.org/blog/index.php?pk=7996&T=1

[TABLE]
[ROW][C]Autocorrelation Function[/C][/ROW]
[ROW][C]Time lag k[/C][C]ACF(k)[/C][C]T-STAT[/C][C]P-value[/C][/ROW]
[ROW][C]0[/C][C]1[/C][C]7.6811[/C][C]0[/C][/ROW]
[ROW][C]1[/C][C]0.27767[/C][C]2.1328[/C][C]0.018555[/C][/ROW]
[ROW][C]2[/C][C]-0.184611[/C][C]-1.418[/C][C]0.919278[/C][/ROW]
[ROW][C]3[/C][C]-0.168479[/C][C]-1.2941[/C][C]0.899665[/C][/ROW]
[ROW][C]4[/C][C]0.071563[/C][C]0.5497[/C][C]0.292306[/C][/ROW]
[ROW][C]5[/C][C]0.060095[/C][C]0.4616[/C][C]0.323034[/C][/ROW]
[ROW][C]6[/C][C]-0.169933[/C][C]-1.3053[/C][C]0.901567[/C][/ROW]
[ROW][C]7[/C][C]-0.031657[/C][C]-0.2432[/C][C]0.595639[/C][/ROW]
[ROW][C]8[/C][C]0.087891[/C][C]0.6751[/C][C]0.251124[/C][/ROW]
[ROW][C]9[/C][C]0.082465[/C][C]0.6334[/C][C]0.264452[/C][/ROW]
[ROW][C]10[/C][C]0.053765[/C][C]0.413[/C][C]0.340559[/C][/ROW]
[ROW][C]11[/C][C]0.005011[/C][C]0.0385[/C][C]0.484715[/C][/ROW]
[ROW][C]12[/C][C]0.048132[/C][C]0.3697[/C][C]0.356463[/C][/ROW]
[ROW][C]13[/C][C]0.025342[/C][C]0.1947[/C][C]0.423165[/C][/ROW]
[ROW][C]14[/C][C]0.027914[/C][C]0.2144[/C][C]0.415481[/C][/ROW]
[ROW][C]15[/C][C]-0.155555[/C][C]-1.1948[/C][C]0.881535[/C][/ROW]
[ROW][C]16[/C][C]-0.189079[/C][C]-1.4523[/C][C]0.924149[/C][/ROW]
[/TABLE]
Source: https://freestatistics.org/blog/index.php?pk=7996&T=1

Globally Unique Identifier (entire table): ba.freestatistics.org/blog/index.php?pk=7996&T=1

As an alternative you can also use a QR Code:  

The GUIDs for individual cells are displayed in the table below:

Autocorrelation Function
Time lag kACF(k)T-STATP-value
017.68110
10.277672.13280.018555
2-0.184611-1.4180.919278
3-0.168479-1.29410.899665
40.0715630.54970.292306
50.0600950.46160.323034
6-0.169933-1.30530.901567
7-0.031657-0.24320.595639
80.0878910.67510.251124
90.0824650.63340.264452
100.0537650.4130.340559
110.0050110.03850.484715
120.0481320.36970.356463
130.0253420.19470.423165
140.0279140.21440.415481
15-0.155555-1.19480.881535
16-0.189079-1.45230.924149


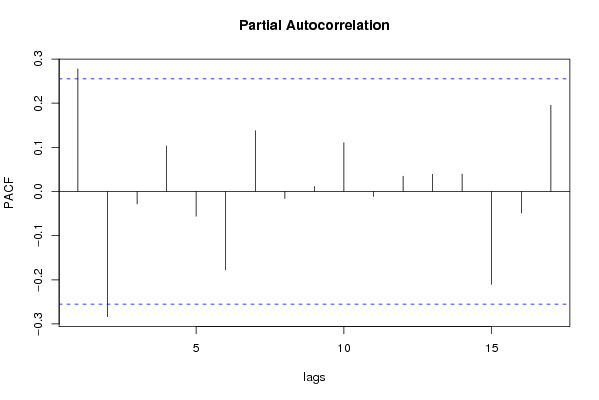
Partial Autocorrelation Function
Time lag kPACF(k)T-STATP-value
00.277672.13280.018555
1-0.283575-2.17820.9833
2-0.028209-0.21670.585398
30.1033010.79350.215341
4-0.055908-0.42940.665416
5-0.177548-1.36380.911089
60.1376591.05740.147324
7-0.016071-0.12340.548912
80.0114650.08810.465062
90.1105810.84940.199549
10-0.011352-0.08720.534596
110.0348050.26730.395068
120.0393250.30210.381835
130.0394290.30290.38153
14-0.210527-1.61710.944403
15-0.048899-0.37560.645719
160.1954621.50140.069297

\begin{tabular}{lllllllll}
\hline
Partial Autocorrelation Function \tabularnewline
Time lag k & PACF(k) & T-STAT & P-value \tabularnewline
0 & 0.27767 & 2.1328 & 0.018555 \tabularnewline
1 & -0.283575 & -2.1782 & 0.9833 \tabularnewline
2 & -0.028209 & -0.2167 & 0.585398 \tabularnewline
3 & 0.103301 & 0.7935 & 0.215341 \tabularnewline
4 & -0.055908 & -0.4294 & 0.665416 \tabularnewline
5 & -0.177548 & -1.3638 & 0.911089 \tabularnewline
6 & 0.137659 & 1.0574 & 0.147324 \tabularnewline
7 & -0.016071 & -0.1234 & 0.548912 \tabularnewline
8 & 0.011465 & 0.0881 & 0.465062 \tabularnewline
9 & 0.110581 & 0.8494 & 0.199549 \tabularnewline
10 & -0.011352 & -0.0872 & 0.534596 \tabularnewline
11 & 0.034805 & 0.2673 & 0.395068 \tabularnewline
12 & 0.039325 & 0.3021 & 0.381835 \tabularnewline
13 & 0.039429 & 0.3029 & 0.38153 \tabularnewline
14 & -0.210527 & -1.6171 & 0.944403 \tabularnewline
15 & -0.048899 & -0.3756 & 0.645719 \tabularnewline
16 & 0.195462 & 1.5014 & 0.069297 \tabularnewline
\hline
\end{tabular}
%Source: https://freestatistics.org/blog/index.php?pk=7996&T=2

[TABLE]
[ROW][C]Partial Autocorrelation Function[/C][/ROW]
[ROW][C]Time lag k[/C][C]PACF(k)[/C][C]T-STAT[/C][C]P-value[/C][/ROW]
[ROW][C]0[/C][C]0.27767[/C][C]2.1328[/C][C]0.018555[/C][/ROW]
[ROW][C]1[/C][C]-0.283575[/C][C]-2.1782[/C][C]0.9833[/C][/ROW]
[ROW][C]2[/C][C]-0.028209[/C][C]-0.2167[/C][C]0.585398[/C][/ROW]
[ROW][C]3[/C][C]0.103301[/C][C]0.7935[/C][C]0.215341[/C][/ROW]
[ROW][C]4[/C][C]-0.055908[/C][C]-0.4294[/C][C]0.665416[/C][/ROW]
[ROW][C]5[/C][C]-0.177548[/C][C]-1.3638[/C][C]0.911089[/C][/ROW]
[ROW][C]6[/C][C]0.137659[/C][C]1.0574[/C][C]0.147324[/C][/ROW]
[ROW][C]7[/C][C]-0.016071[/C][C]-0.1234[/C][C]0.548912[/C][/ROW]
[ROW][C]8[/C][C]0.011465[/C][C]0.0881[/C][C]0.465062[/C][/ROW]
[ROW][C]9[/C][C]0.110581[/C][C]0.8494[/C][C]0.199549[/C][/ROW]
[ROW][C]10[/C][C]-0.011352[/C][C]-0.0872[/C][C]0.534596[/C][/ROW]
[ROW][C]11[/C][C]0.034805[/C][C]0.2673[/C][C]0.395068[/C][/ROW]
[ROW][C]12[/C][C]0.039325[/C][C]0.3021[/C][C]0.381835[/C][/ROW]
[ROW][C]13[/C][C]0.039429[/C][C]0.3029[/C][C]0.38153[/C][/ROW]
[ROW][C]14[/C][C]-0.210527[/C][C]-1.6171[/C][C]0.944403[/C][/ROW]
[ROW][C]15[/C][C]-0.048899[/C][C]-0.3756[/C][C]0.645719[/C][/ROW]
[ROW][C]16[/C][C]0.195462[/C][C]1.5014[/C][C]0.069297[/C][/ROW]
[/TABLE]
Source: https://freestatistics.org/blog/index.php?pk=7996&T=2

Globally Unique Identifier (entire table): ba.freestatistics.org/blog/index.php?pk=7996&T=2

As an alternative you can also use a QR Code:  

The GUIDs for individual cells are displayed in the table below:

Partial Autocorrelation Function
Time lag kPACF(k)T-STATP-value
00.277672.13280.018555
1-0.283575-2.17820.9833
2-0.028209-0.21670.585398
30.1033010.79350.215341
4-0.055908-0.42940.665416
5-0.177548-1.36380.911089
60.1376591.05740.147324
7-0.016071-0.12340.548912
80.0114650.08810.465062
90.1105810.84940.199549
10-0.011352-0.08720.534596
110.0348050.26730.395068
120.0393250.30210.381835
130.0394290.30290.38153
14-0.210527-1.61710.944403
15-0.048899-0.37560.645719
160.1954621.50140.069297


Parameters (Session):
par1 = Default ; par2 = 1 ; par3 = 0 ; par4 = 0 ; par5 = 12 ;
Parameters (R input):
par1 = Default ; par2 = 0.9 ; par3 = 1 ; par4 = 0 ; par5 = 12 ;
R code (references can be found in the software module):
if (par1 == 'Default') {
par1 = 10*log10(length(x))
} else {
par1 <- as.numeric(par1)
}
par2 <- as.numeric(par2)
par3 <- as.numeric(par3)
par4 <- as.numeric(par4)
par5 <- as.numeric(par5)
if (par2 == 0) {
x <- log(x)
} else {
x <- (x ^ par2 - 1) / par2
}
if (par3 > 0) x <- diff(x,lag=1,difference=par3)
if (par4 > 0) x <- diff(x,lag=par5,difference=par4)
bitmap(file='pic1.png')
racf <- acf(x,par1,main='Autocorrelation',xlab='lags',ylab='ACF')
dev.off()
bitmap(file='pic2.png')
rpacf <- pacf(x,par1,main='Partial Autocorrelation',xlab='lags',ylab='PACF')
dev.off()
(myacf <- c(racf$acf))
(mypacf <- c(rpacf$acf))
lengthx <- length(x)
sqrtn <- sqrt(lengthx)
load(file='createtable')
a<-table.start()
a<-table.row.start(a)
a<-table.element(a,'Autocorrelation Function',4,TRUE)
a<-table.row.end(a)
a<-table.row.start(a)
a<-table.element(a,'Time lag k',header=TRUE)
a<-table.element(a,hyperlink('basics.htm','ACF(k)','click here for more information about the Autocorrelation Function'),header=TRUE)
a<-table.element(a,'T-STAT',header=TRUE)
a<-table.element(a,'P-value',header=TRUE)
a<-table.row.end(a)
for (i in 1:par1) {
a<-table.row.start(a)
a<-table.element(a,i-1,header=TRUE)
a<-table.element(a,round(myacf[i],6))
mytstat <- myacf[i]*sqrtn
a<-table.element(a,round(mytstat,4))
a<-table.element(a,round(1-pt(mytstat,lengthx),6))
a<-table.row.end(a)
}
a<-table.end(a)
table.save(a,file='mytable.tab')
a<-table.start()
a<-table.row.start(a)
a<-table.element(a,'Partial Autocorrelation Function',4,TRUE)
a<-table.row.end(a)
a<-table.row.start(a)
a<-table.element(a,'Time lag k',header=TRUE)
a<-table.element(a,hyperlink('basics.htm','PACF(k)','click here for more information about the Partial Autocorrelation Function'),header=TRUE)
a<-table.element(a,'T-STAT',header=TRUE)
a<-table.element(a,'P-value',header=TRUE)
a<-table.row.end(a)
for (i in 1:par1) {
a<-table.row.start(a)
a<-table.element(a,i-1,header=TRUE)
a<-table.element(a,round(mypacf[i],6))
mytstat <- mypacf[i]*sqrtn
a<-table.element(a,round(mytstat,4))
a<-table.element(a,round(1-pt(mytstat,lengthx),6))
a<-table.row.end(a)
}
a<-table.end(a)
table.save(a,file='mytable1.tab')