Free Statistics

of Irreproducible Research!

Author's title

Author*Unverified author*
R Software Modulerwasp_hierarchicalclustering.wasp
Title produced by softwareHierarchical Clustering
Date of computationWed, 16 Jan 2008 06:07:11 -0700
Cite this page as followsStatistical Computations at FreeStatistics.org, Office for Research Development and Education, URL https://freestatistics.org/blog/index.php?v=date/2008/Jan/16/t1200489743bajs9lvauztr3z6.htm/, Retrieved Wed, 15 May 2024 06:02:50 +0000
Statistical Computations at FreeStatistics.org, Office for Research Development and Education, URL https://freestatistics.org/blog/index.php?pk=7987, Retrieved Wed, 15 May 2024 06:02:50 +0000
QR Codes:

Original text written by user:
IsPrivate?No (this computation is public)
User-defined keywords
Estimated Impact321
Family? (F = Feedback message, R = changed R code, M = changed R Module, P = changed Parameters, D = changed Data)
-     [Box-Cox Linearity Plot] [Paper] [2007-11-28 16:33:19] [8d3192ea84fef628e5e980e3df2ac42d]
- RMPD    [Hierarchical Clustering] [] [2008-01-16 13:07:11] [d41d8cd98f00b204e9800998ecf8427e] [Current]
Feedback Forum

Post a new message
Dataseries X:
281	0.88
295	0.87
294	0.88
302	0.89
314	0.92
321	0.96
313	0.99
310	0.98
319	0.98
316	0.98
319	1.00
333	1.02
356	1.06
358	1.08
340	1.08
328	1.08
355	1.16
356	1.17
351	1.14
359	1.11
378	1.12
378	1.17
389.	1.17
407	1.23
413	1.26
404	1.26
406	1.23
402	1.20
383	1.20
392	1.21
398	1.23
400	1.22
405	1.22
420	1.25
439	1.30
441	1.34
424	1.31
423	1.30
434	1.32
429	1.29
421	1.27
430	1.22
424	1.20
437	1.23
456	1.23
469	1.20
476	1.18
510	1.19
549	1.21
554	1.19
557	1.20
610	1.23
675	1.28
596	1.27
633	1.27
632	1.28
596	1.27
585	1.26
627	1.29
629	1.32


Summary of compuational transaction
Raw Inputview raw input (R code)
Raw Outputview raw output of R engine
Computing time1 seconds
R Server'George Udny Yule' @ 72.249.76.132

\begin{tabular}{lllllllll}
\hline
Summary of compuational transaction \tabularnewline
Raw Input & view raw input (R code)  \tabularnewline
Raw Output & view raw output of R engine  \tabularnewline
Computing time & 1 seconds \tabularnewline
R Server & 'George Udny Yule' @ 72.249.76.132 \tabularnewline
\hline
\end{tabular}
%Source: https://freestatistics.org/blog/index.php?pk=7987&T=0

[TABLE]
[ROW][C]Summary of compuational transaction[/C][/ROW]
[ROW][C]Raw Input[/C][C]view raw input (R code) [/C][/ROW]
[ROW][C]Raw Output[/C][C]view raw output of R engine [/C][/ROW]
[ROW][C]Computing time[/C][C]1 seconds[/C][/ROW]
[ROW][C]R Server[/C][C]'George Udny Yule' @ 72.249.76.132[/C][/ROW]
[/TABLE]
Source: https://freestatistics.org/blog/index.php?pk=7987&T=0

Globally Unique Identifier (entire table): ba.freestatistics.org/blog/index.php?pk=7987&T=0

As an alternative you can also use a QR Code:  

The GUIDs for individual cells are displayed in the table below:

Summary of compuational transaction
Raw Inputview raw input (R code)
Raw Outputview raw output of R engine
Computing time1 seconds
R Server'George Udny Yule' @ 72.249.76.132


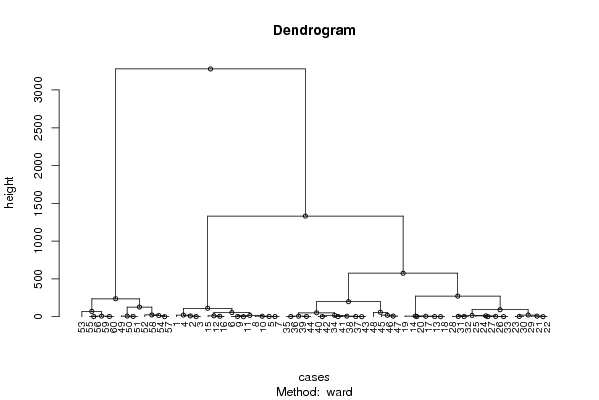
Summary of Dendrogram
LabelHeight
10
20.02
30.0499999999999998
40.110000000000000
50.11
61
71.00004999875006
81.00004999875006
91.000199980004
101.00044989879554
111.00079968025574
121.00244700608062
131.00244700608062
141.30002504057477
151.30002504057477
162.00002499984375
172.00022498734517
182.000399960008
192.66033330500541
202.99979530744742
212.99982515096672
223.00001666662037
233.00026665481587
243.00134969638661
253.33346666399751
265.00035998704093
275.49967274227335
285.63752785090332
296.43686491493582
306.50052787702003
316.6504866388235
327.00002857137026
337.50017374487265
347.66669194435158
358.3256973169075
369.66667321466186
3710.9999707474857
3811.0000514297425
3914.6666727272715
4016.3965128638217
4116.9167748051145
4217.0426040046246
4319.6667218863705
4421.3333221728372
4521.5198615981122
4622.8333979609194
4750.7206108995615
4854.4273224239328
4957.8333211380214
5069.499918103184
5191.460687775007
52110.571181186238
53126.690581559483
54198.669835433516
55236.642774938659
56272.187850846271
57574.654049587391
581331.26332721840
593278.54594038263

\begin{tabular}{lllllllll}
\hline
Summary of Dendrogram \tabularnewline
Label & Height \tabularnewline
1 & 0 \tabularnewline
2 & 0.02 \tabularnewline
3 & 0.0499999999999998 \tabularnewline
4 & 0.110000000000000 \tabularnewline
5 & 0.11 \tabularnewline
6 & 1 \tabularnewline
7 & 1.00004999875006 \tabularnewline
8 & 1.00004999875006 \tabularnewline
9 & 1.000199980004 \tabularnewline
10 & 1.00044989879554 \tabularnewline
11 & 1.00079968025574 \tabularnewline
12 & 1.00244700608062 \tabularnewline
13 & 1.00244700608062 \tabularnewline
14 & 1.30002504057477 \tabularnewline
15 & 1.30002504057477 \tabularnewline
16 & 2.00002499984375 \tabularnewline
17 & 2.00022498734517 \tabularnewline
18 & 2.000399960008 \tabularnewline
19 & 2.66033330500541 \tabularnewline
20 & 2.99979530744742 \tabularnewline
21 & 2.99982515096672 \tabularnewline
22 & 3.00001666662037 \tabularnewline
23 & 3.00026665481587 \tabularnewline
24 & 3.00134969638661 \tabularnewline
25 & 3.33346666399751 \tabularnewline
26 & 5.00035998704093 \tabularnewline
27 & 5.49967274227335 \tabularnewline
28 & 5.63752785090332 \tabularnewline
29 & 6.43686491493582 \tabularnewline
30 & 6.50052787702003 \tabularnewline
31 & 6.6504866388235 \tabularnewline
32 & 7.00002857137026 \tabularnewline
33 & 7.50017374487265 \tabularnewline
34 & 7.66669194435158 \tabularnewline
35 & 8.3256973169075 \tabularnewline
36 & 9.66667321466186 \tabularnewline
37 & 10.9999707474857 \tabularnewline
38 & 11.0000514297425 \tabularnewline
39 & 14.6666727272715 \tabularnewline
40 & 16.3965128638217 \tabularnewline
41 & 16.9167748051145 \tabularnewline
42 & 17.0426040046246 \tabularnewline
43 & 19.6667218863705 \tabularnewline
44 & 21.3333221728372 \tabularnewline
45 & 21.5198615981122 \tabularnewline
46 & 22.8333979609194 \tabularnewline
47 & 50.7206108995615 \tabularnewline
48 & 54.4273224239328 \tabularnewline
49 & 57.8333211380214 \tabularnewline
50 & 69.499918103184 \tabularnewline
51 & 91.460687775007 \tabularnewline
52 & 110.571181186238 \tabularnewline
53 & 126.690581559483 \tabularnewline
54 & 198.669835433516 \tabularnewline
55 & 236.642774938659 \tabularnewline
56 & 272.187850846271 \tabularnewline
57 & 574.654049587391 \tabularnewline
58 & 1331.26332721840 \tabularnewline
59 & 3278.54594038263 \tabularnewline
\hline
\end{tabular}
%Source: https://freestatistics.org/blog/index.php?pk=7987&T=1

[TABLE]
[ROW][C]Summary of Dendrogram[/C][/ROW]
[ROW][C]Label[/C][C]Height[/C][/ROW]
[ROW][C]1[/C][C]0[/C][/ROW]
[ROW][C]2[/C][C]0.02[/C][/ROW]
[ROW][C]3[/C][C]0.0499999999999998[/C][/ROW]
[ROW][C]4[/C][C]0.110000000000000[/C][/ROW]
[ROW][C]5[/C][C]0.11[/C][/ROW]
[ROW][C]6[/C][C]1[/C][/ROW]
[ROW][C]7[/C][C]1.00004999875006[/C][/ROW]
[ROW][C]8[/C][C]1.00004999875006[/C][/ROW]
[ROW][C]9[/C][C]1.000199980004[/C][/ROW]
[ROW][C]10[/C][C]1.00044989879554[/C][/ROW]
[ROW][C]11[/C][C]1.00079968025574[/C][/ROW]
[ROW][C]12[/C][C]1.00244700608062[/C][/ROW]
[ROW][C]13[/C][C]1.00244700608062[/C][/ROW]
[ROW][C]14[/C][C]1.30002504057477[/C][/ROW]
[ROW][C]15[/C][C]1.30002504057477[/C][/ROW]
[ROW][C]16[/C][C]2.00002499984375[/C][/ROW]
[ROW][C]17[/C][C]2.00022498734517[/C][/ROW]
[ROW][C]18[/C][C]2.000399960008[/C][/ROW]
[ROW][C]19[/C][C]2.66033330500541[/C][/ROW]
[ROW][C]20[/C][C]2.99979530744742[/C][/ROW]
[ROW][C]21[/C][C]2.99982515096672[/C][/ROW]
[ROW][C]22[/C][C]3.00001666662037[/C][/ROW]
[ROW][C]23[/C][C]3.00026665481587[/C][/ROW]
[ROW][C]24[/C][C]3.00134969638661[/C][/ROW]
[ROW][C]25[/C][C]3.33346666399751[/C][/ROW]
[ROW][C]26[/C][C]5.00035998704093[/C][/ROW]
[ROW][C]27[/C][C]5.49967274227335[/C][/ROW]
[ROW][C]28[/C][C]5.63752785090332[/C][/ROW]
[ROW][C]29[/C][C]6.43686491493582[/C][/ROW]
[ROW][C]30[/C][C]6.50052787702003[/C][/ROW]
[ROW][C]31[/C][C]6.6504866388235[/C][/ROW]
[ROW][C]32[/C][C]7.00002857137026[/C][/ROW]
[ROW][C]33[/C][C]7.50017374487265[/C][/ROW]
[ROW][C]34[/C][C]7.66669194435158[/C][/ROW]
[ROW][C]35[/C][C]8.3256973169075[/C][/ROW]
[ROW][C]36[/C][C]9.66667321466186[/C][/ROW]
[ROW][C]37[/C][C]10.9999707474857[/C][/ROW]
[ROW][C]38[/C][C]11.0000514297425[/C][/ROW]
[ROW][C]39[/C][C]14.6666727272715[/C][/ROW]
[ROW][C]40[/C][C]16.3965128638217[/C][/ROW]
[ROW][C]41[/C][C]16.9167748051145[/C][/ROW]
[ROW][C]42[/C][C]17.0426040046246[/C][/ROW]
[ROW][C]43[/C][C]19.6667218863705[/C][/ROW]
[ROW][C]44[/C][C]21.3333221728372[/C][/ROW]
[ROW][C]45[/C][C]21.5198615981122[/C][/ROW]
[ROW][C]46[/C][C]22.8333979609194[/C][/ROW]
[ROW][C]47[/C][C]50.7206108995615[/C][/ROW]
[ROW][C]48[/C][C]54.4273224239328[/C][/ROW]
[ROW][C]49[/C][C]57.8333211380214[/C][/ROW]
[ROW][C]50[/C][C]69.499918103184[/C][/ROW]
[ROW][C]51[/C][C]91.460687775007[/C][/ROW]
[ROW][C]52[/C][C]110.571181186238[/C][/ROW]
[ROW][C]53[/C][C]126.690581559483[/C][/ROW]
[ROW][C]54[/C][C]198.669835433516[/C][/ROW]
[ROW][C]55[/C][C]236.642774938659[/C][/ROW]
[ROW][C]56[/C][C]272.187850846271[/C][/ROW]
[ROW][C]57[/C][C]574.654049587391[/C][/ROW]
[ROW][C]58[/C][C]1331.26332721840[/C][/ROW]
[ROW][C]59[/C][C]3278.54594038263[/C][/ROW]
[/TABLE]
Source: https://freestatistics.org/blog/index.php?pk=7987&T=1

Globally Unique Identifier (entire table): ba.freestatistics.org/blog/index.php?pk=7987&T=1

As an alternative you can also use a QR Code:  

The GUIDs for individual cells are displayed in the table below:

Summary of Dendrogram
LabelHeight
10
20.02
30.0499999999999998
40.110000000000000
50.11
61
71.00004999875006
81.00004999875006
91.000199980004
101.00044989879554
111.00079968025574
121.00244700608062
131.00244700608062
141.30002504057477
151.30002504057477
162.00002499984375
172.00022498734517
182.000399960008
192.66033330500541
202.99979530744742
212.99982515096672
223.00001666662037
233.00026665481587
243.00134969638661
253.33346666399751
265.00035998704093
275.49967274227335
285.63752785090332
296.43686491493582
306.50052787702003
316.6504866388235
327.00002857137026
337.50017374487265
347.66669194435158
358.3256973169075
369.66667321466186
3710.9999707474857
3811.0000514297425
3914.6666727272715
4016.3965128638217
4116.9167748051145
4217.0426040046246
4319.6667218863705
4421.3333221728372
4521.5198615981122
4622.8333979609194
4750.7206108995615
4854.4273224239328
4957.8333211380214
5069.499918103184
5191.460687775007
52110.571181186238
53126.690581559483
54198.669835433516
55236.642774938659
56272.187850846271
57574.654049587391
581331.26332721840
593278.54594038263


Parameters (Session):
par1 = ward ; par2 = ALL ; par3 = FALSE ; par4 = FALSE ;
Parameters (R input):
par1 = ward ; par2 = ALL ; par3 = FALSE ; par4 = FALSE ;
R code (references can be found in the software module):
par3 <- as.logical(par3)
par4 <- as.logical(par4)
if (par3 == 'TRUE'){
dum = xlab
xlab = ylab
ylab = dum
}
x <- t(y)
hc <- hclust(dist(x),method=par1)
d <- as.dendrogram(hc)
str(d)
mysub <- paste('Method: ',par1)
bitmap(file='test1.png')
if (par4 == 'TRUE'){
plot(d,main=main,ylab=ylab,xlab=xlab,horiz=par3, nodePar=list(pch = c(1,NA), cex=0.8, lab.cex = 0.8),type='t',center=T, sub=mysub)
} else {
plot(d,main=main,ylab=ylab,xlab=xlab,horiz=par3, nodePar=list(pch = c(1,NA), cex=0.8, lab.cex = 0.8), sub=mysub)
}
dev.off()
if (par2 != 'ALL'){
if (par3 == 'TRUE'){
ylab = 'cluster'
} else {
xlab = 'cluster'
}
par2 <- as.numeric(par2)
memb <- cutree(hc, k = par2)
cent <- NULL
for(k in 1:par2){
cent <- rbind(cent, colMeans(x[memb == k, , drop = FALSE]))
}
hc1 <- hclust(dist(cent),method=par1, members = table(memb))
de <- as.dendrogram(hc1)
bitmap(file='test2.png')
if (par4 == 'TRUE'){
plot(de,main=main,ylab=ylab,xlab=xlab,horiz=par3, nodePar=list(pch = c(1,NA), cex=0.8, lab.cex = 0.8),type='t',center=T, sub=mysub)
} else {
plot(de,main=main,ylab=ylab,xlab=xlab,horiz=par3, nodePar=list(pch = c(1,NA), cex=0.8, lab.cex = 0.8), sub=mysub)
}
dev.off()
str(de)
}
load(file='createtable')
a<-table.start()
a<-table.row.start(a)
a<-table.element(a,'Summary of Dendrogram',2,TRUE)
a<-table.row.end(a)
a<-table.row.start(a)
a<-table.element(a,'Label',header=TRUE)
a<-table.element(a,'Height',header=TRUE)
a<-table.row.end(a)
num <- length(x[,1])-1
for (i in 1:num)
{
a<-table.row.start(a)
a<-table.element(a,hc$labels[i])
a<-table.element(a,hc$height[i])
a<-table.row.end(a)
}
a<-table.end(a)
table.save(a,file='mytable1.tab')
if (par2 != 'ALL'){
a<-table.start()
a<-table.row.start(a)
a<-table.element(a,'Summary of Cut Dendrogram',2,TRUE)
a<-table.row.end(a)
a<-table.row.start(a)
a<-table.element(a,'Label',header=TRUE)
a<-table.element(a,'Height',header=TRUE)
a<-table.row.end(a)
num <- par2-1
for (i in 1:num)
{
a<-table.row.start(a)
a<-table.element(a,i)
a<-table.element(a,hc1$height[i])
a<-table.row.end(a)
}
a<-table.end(a)
table.save(a,file='mytable2.tab')
}