Free Statistics

of Irreproducible Research!

Author's title

Author*Unverified author*
R Software Modulerwasp_autocorrelation.wasp
Title produced by software(Partial) Autocorrelation Function
Date of computationTue, 15 Jan 2008 09:51:07 -0700
Cite this page as followsStatistical Computations at FreeStatistics.org, Office for Research Development and Education, URL https://freestatistics.org/blog/index.php?v=date/2008/Jan/15/t1200415637pi2i9ocvwmqgcko.htm/, Retrieved Wed, 15 May 2024 10:15:42 +0000
Statistical Computations at FreeStatistics.org, Office for Research Development and Education, URL https://freestatistics.org/blog/index.php?pk=7963, Retrieved Wed, 15 May 2024 10:15:42 +0000
QR Codes:

Original text written by user:
IsPrivate?No (this computation is public)
User-defined keywordsauto cor diesel
Estimated Impact323
Family? (F = Feedback message, R = changed R code, M = changed R Module, P = changed Parameters, D = changed Data)
-       [(Partial) Autocorrelation Function] [s 0650692 paper] [2008-01-15 16:51:07] [011cc8cdd02d5893b5258ac3f5e21d83] [Current]
-  MPD    [(Partial) Autocorrelation Function] [b-r0245787] [2010-12-21 13:15:12] [ebb35fb07def4d07c0eb7ec8d2fd3b0e]
-           [(Partial) Autocorrelation Function] [b-r0245095] [2010-12-21 13:17:58] [ec8d68d52c1e9c5e97bb689b42436a8c]
-   P         [(Partial) Autocorrelation Function] [b-r0245095] [2010-12-22 13:10:30] [ec8d68d52c1e9c5e97bb689b42436a8c]
-   P       [(Partial) Autocorrelation Function] [b-r0245787] [2010-12-22 13:10:36] [ebb35fb07def4d07c0eb7ec8d2fd3b0e]
Feedback Forum

Post a new message
Dataseries X:
0.73
0.74
0.75
0.74
0.76
0.76
0.78
0.79
0.89
0.88
0.88
0.84
0.76
0.77
0.76
0.77
0.78
0.79
0.78
0.76
0.78
0.76
0.74
0.73
0.72
0.71
0.73
0.75
0.75
0.72
0.72
0.72
0.74
0.78
0.74
0.74
0.75
0.78
0.81
0.75
0.7
0.71
0.71
0.73
0.74
0.74
0.75
0.74
0.74
0.73
0.76
0.8
0.83
0.81
0.83
0.88
0.89
0.93
0.91
0.9
0.86
0.88
0.93
0.98
0.97
1.03
1.06
1.06
1.08
1.09
1.04
1


Summary of compuational transaction
Raw Inputview raw input (R code)
Raw Outputview raw output of R engine
Computing time2 seconds
R Server'Herman Ole Andreas Wold' @ 193.190.124.10:1001

\begin{tabular}{lllllllll}
\hline
Summary of compuational transaction \tabularnewline
Raw Input & view raw input (R code)  \tabularnewline
Raw Output & view raw output of R engine  \tabularnewline
Computing time & 2 seconds \tabularnewline
R Server & 'Herman Ole Andreas Wold' @ 193.190.124.10:1001 \tabularnewline
\hline
\end{tabular}
%Source: https://freestatistics.org/blog/index.php?pk=7963&T=0

[TABLE]
[ROW][C]Summary of compuational transaction[/C][/ROW]
[ROW][C]Raw Input[/C][C]view raw input (R code) [/C][/ROW]
[ROW][C]Raw Output[/C][C]view raw output of R engine [/C][/ROW]
[ROW][C]Computing time[/C][C]2 seconds[/C][/ROW]
[ROW][C]R Server[/C][C]'Herman Ole Andreas Wold' @ 193.190.124.10:1001[/C][/ROW]
[/TABLE]
Source: https://freestatistics.org/blog/index.php?pk=7963&T=0

Globally Unique Identifier (entire table): ba.freestatistics.org/blog/index.php?pk=7963&T=0

As an alternative you can also use a QR Code:  

The GUIDs for individual cells are displayed in the table below:

Summary of compuational transaction
Raw Inputview raw input (R code)
Raw Outputview raw output of R engine
Computing time2 seconds
R Server'Herman Ole Andreas Wold' @ 193.190.124.10:1001


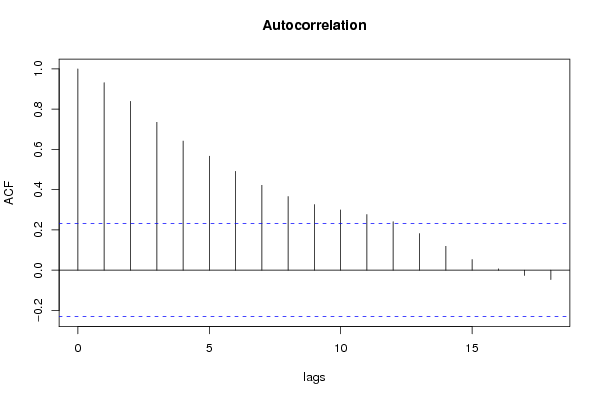
Autocorrelation Function
Time lag kACF(k)T-STATP-value
018.48530
10.9316847.90560
20.8388627.1180
30.7349246.2360
40.6415285.44350
50.5663974.8064e-06
60.4910014.16634.2e-05
70.421673.5780.000312
80.3659933.10560.001358
90.3261762.76770.003586
100.2995932.54210.006585
110.2766052.34710.010838
120.2409122.04420.022295
130.1819711.54410.063477
140.1188391.00840.158325
150.0526840.4470.328093
160.0064480.05470.478259
17-0.025892-0.21970.586637

\begin{tabular}{lllllllll}
\hline
Autocorrelation Function \tabularnewline
Time lag k & ACF(k) & T-STAT & P-value \tabularnewline
0 & 1 & 8.4853 & 0 \tabularnewline
1 & 0.931684 & 7.9056 & 0 \tabularnewline
2 & 0.838862 & 7.118 & 0 \tabularnewline
3 & 0.734924 & 6.236 & 0 \tabularnewline
4 & 0.641528 & 5.4435 & 0 \tabularnewline
5 & 0.566397 & 4.806 & 4e-06 \tabularnewline
6 & 0.491001 & 4.1663 & 4.2e-05 \tabularnewline
7 & 0.42167 & 3.578 & 0.000312 \tabularnewline
8 & 0.365993 & 3.1056 & 0.001358 \tabularnewline
9 & 0.326176 & 2.7677 & 0.003586 \tabularnewline
10 & 0.299593 & 2.5421 & 0.006585 \tabularnewline
11 & 0.276605 & 2.3471 & 0.010838 \tabularnewline
12 & 0.240912 & 2.0442 & 0.022295 \tabularnewline
13 & 0.181971 & 1.5441 & 0.063477 \tabularnewline
14 & 0.118839 & 1.0084 & 0.158325 \tabularnewline
15 & 0.052684 & 0.447 & 0.328093 \tabularnewline
16 & 0.006448 & 0.0547 & 0.478259 \tabularnewline
17 & -0.025892 & -0.2197 & 0.586637 \tabularnewline
\hline
\end{tabular}
%Source: https://freestatistics.org/blog/index.php?pk=7963&T=1

[TABLE]
[ROW][C]Autocorrelation Function[/C][/ROW]
[ROW][C]Time lag k[/C][C]ACF(k)[/C][C]T-STAT[/C][C]P-value[/C][/ROW]
[ROW][C]0[/C][C]1[/C][C]8.4853[/C][C]0[/C][/ROW]
[ROW][C]1[/C][C]0.931684[/C][C]7.9056[/C][C]0[/C][/ROW]
[ROW][C]2[/C][C]0.838862[/C][C]7.118[/C][C]0[/C][/ROW]
[ROW][C]3[/C][C]0.734924[/C][C]6.236[/C][C]0[/C][/ROW]
[ROW][C]4[/C][C]0.641528[/C][C]5.4435[/C][C]0[/C][/ROW]
[ROW][C]5[/C][C]0.566397[/C][C]4.806[/C][C]4e-06[/C][/ROW]
[ROW][C]6[/C][C]0.491001[/C][C]4.1663[/C][C]4.2e-05[/C][/ROW]
[ROW][C]7[/C][C]0.42167[/C][C]3.578[/C][C]0.000312[/C][/ROW]
[ROW][C]8[/C][C]0.365993[/C][C]3.1056[/C][C]0.001358[/C][/ROW]
[ROW][C]9[/C][C]0.326176[/C][C]2.7677[/C][C]0.003586[/C][/ROW]
[ROW][C]10[/C][C]0.299593[/C][C]2.5421[/C][C]0.006585[/C][/ROW]
[ROW][C]11[/C][C]0.276605[/C][C]2.3471[/C][C]0.010838[/C][/ROW]
[ROW][C]12[/C][C]0.240912[/C][C]2.0442[/C][C]0.022295[/C][/ROW]
[ROW][C]13[/C][C]0.181971[/C][C]1.5441[/C][C]0.063477[/C][/ROW]
[ROW][C]14[/C][C]0.118839[/C][C]1.0084[/C][C]0.158325[/C][/ROW]
[ROW][C]15[/C][C]0.052684[/C][C]0.447[/C][C]0.328093[/C][/ROW]
[ROW][C]16[/C][C]0.006448[/C][C]0.0547[/C][C]0.478259[/C][/ROW]
[ROW][C]17[/C][C]-0.025892[/C][C]-0.2197[/C][C]0.586637[/C][/ROW]
[/TABLE]
Source: https://freestatistics.org/blog/index.php?pk=7963&T=1

Globally Unique Identifier (entire table): ba.freestatistics.org/blog/index.php?pk=7963&T=1

As an alternative you can also use a QR Code:  

The GUIDs for individual cells are displayed in the table below:

Autocorrelation Function
Time lag kACF(k)T-STATP-value
018.48530
10.9316847.90560
20.8388627.1180
30.7349246.2360
40.6415285.44350
50.5663974.8064e-06
60.4910014.16634.2e-05
70.421673.5780.000312
80.3659933.10560.001358
90.3261762.76770.003586
100.2995932.54210.006585
110.2766052.34710.010838
120.2409122.04420.022295
130.1819711.54410.063477
140.1188391.00840.158325
150.0526840.4470.328093
160.0064480.05470.478259
17-0.025892-0.21970.586637


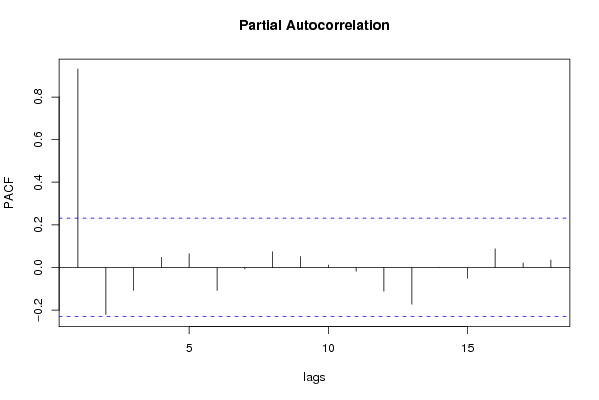
Partial Autocorrelation Function
Time lag kPACF(k)T-STATP-value
00.9316847.90560
1-0.221067-1.87580.967632
2-0.107099-0.90880.816747
30.0472520.40090.344824
40.0642640.54530.293618
5-0.107801-0.91470.818304
6-0.006858-0.05820.52312
70.0735370.6240.267305
80.0519030.44040.330479
90.0112270.09530.462186
10-0.018301-0.15530.561486
11-0.111345-0.94480.826037
12-0.172187-1.46110.925824
130.0004020.00340.498645
14-0.050521-0.42870.665285
150.0873940.74160.230381
160.0212030.17990.428864
170.0345380.29310.385159

\begin{tabular}{lllllllll}
\hline
Partial Autocorrelation Function \tabularnewline
Time lag k & PACF(k) & T-STAT & P-value \tabularnewline
0 & 0.931684 & 7.9056 & 0 \tabularnewline
1 & -0.221067 & -1.8758 & 0.967632 \tabularnewline
2 & -0.107099 & -0.9088 & 0.816747 \tabularnewline
3 & 0.047252 & 0.4009 & 0.344824 \tabularnewline
4 & 0.064264 & 0.5453 & 0.293618 \tabularnewline
5 & -0.107801 & -0.9147 & 0.818304 \tabularnewline
6 & -0.006858 & -0.0582 & 0.52312 \tabularnewline
7 & 0.073537 & 0.624 & 0.267305 \tabularnewline
8 & 0.051903 & 0.4404 & 0.330479 \tabularnewline
9 & 0.011227 & 0.0953 & 0.462186 \tabularnewline
10 & -0.018301 & -0.1553 & 0.561486 \tabularnewline
11 & -0.111345 & -0.9448 & 0.826037 \tabularnewline
12 & -0.172187 & -1.4611 & 0.925824 \tabularnewline
13 & 0.000402 & 0.0034 & 0.498645 \tabularnewline
14 & -0.050521 & -0.4287 & 0.665285 \tabularnewline
15 & 0.087394 & 0.7416 & 0.230381 \tabularnewline
16 & 0.021203 & 0.1799 & 0.428864 \tabularnewline
17 & 0.034538 & 0.2931 & 0.385159 \tabularnewline
\hline
\end{tabular}
%Source: https://freestatistics.org/blog/index.php?pk=7963&T=2

[TABLE]
[ROW][C]Partial Autocorrelation Function[/C][/ROW]
[ROW][C]Time lag k[/C][C]PACF(k)[/C][C]T-STAT[/C][C]P-value[/C][/ROW]
[ROW][C]0[/C][C]0.931684[/C][C]7.9056[/C][C]0[/C][/ROW]
[ROW][C]1[/C][C]-0.221067[/C][C]-1.8758[/C][C]0.967632[/C][/ROW]
[ROW][C]2[/C][C]-0.107099[/C][C]-0.9088[/C][C]0.816747[/C][/ROW]
[ROW][C]3[/C][C]0.047252[/C][C]0.4009[/C][C]0.344824[/C][/ROW]
[ROW][C]4[/C][C]0.064264[/C][C]0.5453[/C][C]0.293618[/C][/ROW]
[ROW][C]5[/C][C]-0.107801[/C][C]-0.9147[/C][C]0.818304[/C][/ROW]
[ROW][C]6[/C][C]-0.006858[/C][C]-0.0582[/C][C]0.52312[/C][/ROW]
[ROW][C]7[/C][C]0.073537[/C][C]0.624[/C][C]0.267305[/C][/ROW]
[ROW][C]8[/C][C]0.051903[/C][C]0.4404[/C][C]0.330479[/C][/ROW]
[ROW][C]9[/C][C]0.011227[/C][C]0.0953[/C][C]0.462186[/C][/ROW]
[ROW][C]10[/C][C]-0.018301[/C][C]-0.1553[/C][C]0.561486[/C][/ROW]
[ROW][C]11[/C][C]-0.111345[/C][C]-0.9448[/C][C]0.826037[/C][/ROW]
[ROW][C]12[/C][C]-0.172187[/C][C]-1.4611[/C][C]0.925824[/C][/ROW]
[ROW][C]13[/C][C]0.000402[/C][C]0.0034[/C][C]0.498645[/C][/ROW]
[ROW][C]14[/C][C]-0.050521[/C][C]-0.4287[/C][C]0.665285[/C][/ROW]
[ROW][C]15[/C][C]0.087394[/C][C]0.7416[/C][C]0.230381[/C][/ROW]
[ROW][C]16[/C][C]0.021203[/C][C]0.1799[/C][C]0.428864[/C][/ROW]
[ROW][C]17[/C][C]0.034538[/C][C]0.2931[/C][C]0.385159[/C][/ROW]
[/TABLE]
Source: https://freestatistics.org/blog/index.php?pk=7963&T=2

Globally Unique Identifier (entire table): ba.freestatistics.org/blog/index.php?pk=7963&T=2

As an alternative you can also use a QR Code:  

The GUIDs for individual cells are displayed in the table below:

Partial Autocorrelation Function
Time lag kPACF(k)T-STATP-value
00.9316847.90560
1-0.221067-1.87580.967632
2-0.107099-0.90880.816747
30.0472520.40090.344824
40.0642640.54530.293618
5-0.107801-0.91470.818304
6-0.006858-0.05820.52312
70.0735370.6240.267305
80.0519030.44040.330479
90.0112270.09530.462186
10-0.018301-0.15530.561486
11-0.111345-0.94480.826037
12-0.172187-1.46110.925824
130.0004020.00340.498645
14-0.050521-0.42870.665285
150.0873940.74160.230381
160.0212030.17990.428864
170.0345380.29310.385159


Parameters (Session):
par1 = Default ; par2 = 1 ; par3 = 0 ; par4 = 0 ; par5 = 12 ;
Parameters (R input):
par1 = Default ; par2 = 1 ; par3 = 0 ; par4 = 0 ; par5 = 12 ;
R code (references can be found in the software module):
if (par1 == 'Default') {
par1 = 10*log10(length(x))
} else {
par1 <- as.numeric(par1)
}
par2 <- as.numeric(par2)
par3 <- as.numeric(par3)
par4 <- as.numeric(par4)
par5 <- as.numeric(par5)
if (par2 == 0) {
x <- log(x)
} else {
x <- (x ^ par2 - 1) / par2
}
if (par3 > 0) x <- diff(x,lag=1,difference=par3)
if (par4 > 0) x <- diff(x,lag=par5,difference=par4)
bitmap(file='pic1.png')
racf <- acf(x,par1,main='Autocorrelation',xlab='lags',ylab='ACF')
dev.off()
bitmap(file='pic2.png')
rpacf <- pacf(x,par1,main='Partial Autocorrelation',xlab='lags',ylab='PACF')
dev.off()
(myacf <- c(racf$acf))
(mypacf <- c(rpacf$acf))
lengthx <- length(x)
sqrtn <- sqrt(lengthx)
load(file='createtable')
a<-table.start()
a<-table.row.start(a)
a<-table.element(a,'Autocorrelation Function',4,TRUE)
a<-table.row.end(a)
a<-table.row.start(a)
a<-table.element(a,'Time lag k',header=TRUE)
a<-table.element(a,hyperlink('basics.htm','ACF(k)','click here for more information about the Autocorrelation Function'),header=TRUE)
a<-table.element(a,'T-STAT',header=TRUE)
a<-table.element(a,'P-value',header=TRUE)
a<-table.row.end(a)
for (i in 1:par1) {
a<-table.row.start(a)
a<-table.element(a,i-1,header=TRUE)
a<-table.element(a,round(myacf[i],6))
mytstat <- myacf[i]*sqrtn
a<-table.element(a,round(mytstat,4))
a<-table.element(a,round(1-pt(mytstat,lengthx),6))
a<-table.row.end(a)
}
a<-table.end(a)
table.save(a,file='mytable.tab')
a<-table.start()
a<-table.row.start(a)
a<-table.element(a,'Partial Autocorrelation Function',4,TRUE)
a<-table.row.end(a)
a<-table.row.start(a)
a<-table.element(a,'Time lag k',header=TRUE)
a<-table.element(a,hyperlink('basics.htm','PACF(k)','click here for more information about the Partial Autocorrelation Function'),header=TRUE)
a<-table.element(a,'T-STAT',header=TRUE)
a<-table.element(a,'P-value',header=TRUE)
a<-table.row.end(a)
for (i in 1:par1) {
a<-table.row.start(a)
a<-table.element(a,i-1,header=TRUE)
a<-table.element(a,round(mypacf[i],6))
mytstat <- mypacf[i]*sqrtn
a<-table.element(a,round(mytstat,4))
a<-table.element(a,round(1-pt(mytstat,lengthx),6))
a<-table.row.end(a)
}
a<-table.end(a)
table.save(a,file='mytable1.tab')