Free Statistics
of Irreproducible Research!
Description of Statistical Computation | |||||||||||||||||||||||||||||||||||||||
|---|---|---|---|---|---|---|---|---|---|---|---|---|---|---|---|---|---|---|---|---|---|---|---|---|---|---|---|---|---|---|---|---|---|---|---|---|---|---|---|
| Author's title | |||||||||||||||||||||||||||||||||||||||
| Author | *Unverified author* | ||||||||||||||||||||||||||||||||||||||
| R Software Module | rwasp_fitdistrnorm.wasp | ||||||||||||||||||||||||||||||||||||||
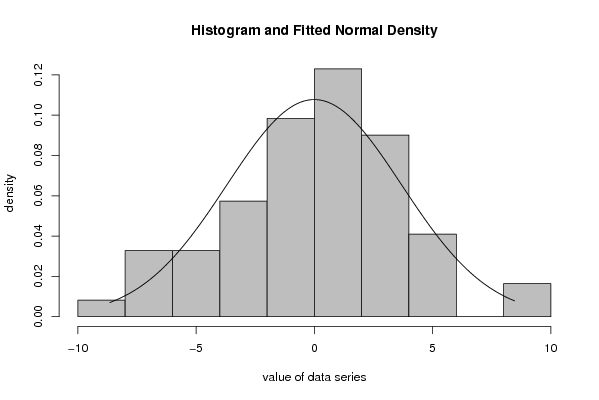
| Title produced by software | Maximum-likelihood Fitting - Normal Distribution | ||||||||||||||||||||||||||||||||||||||
| Date of computation | Fri, 11 Jan 2008 08:29:27 -0700 | ||||||||||||||||||||||||||||||||||||||
| Cite this page as follows | Statistical Computations at FreeStatistics.org, Office for Research Development and Education, URL https://freestatistics.org/blog/index.php?v=date/2008/Jan/11/t120006524597yuxr1ffyjxmro.htm/, Retrieved Tue, 14 May 2024 15:37:21 +0000 | ||||||||||||||||||||||||||||||||||||||
| Statistical Computations at FreeStatistics.org, Office for Research Development and Education, URL https://freestatistics.org/blog/index.php?pk=7946, Retrieved Tue, 14 May 2024 15:37:21 +0000 | |||||||||||||||||||||||||||||||||||||||
| QR Codes: | |||||||||||||||||||||||||||||||||||||||
|
| |||||||||||||||||||||||||||||||||||||||
| Original text written by user: | |||||||||||||||||||||||||||||||||||||||
| IsPrivate? | No (this computation is public) | ||||||||||||||||||||||||||||||||||||||
| User-defined keywords | maximum likelihood Tinne Van der Eycken | ||||||||||||||||||||||||||||||||||||||
| Estimated Impact | 300 | ||||||||||||||||||||||||||||||||||||||
Tree of Dependent Computations | |||||||||||||||||||||||||||||||||||||||
| Family? (F = Feedback message, R = changed R code, M = changed R Module, P = changed Parameters, D = changed Data) | |||||||||||||||||||||||||||||||||||||||
| - [Maximum-likelihood Fitting - Normal Distribution] [Paper: Residu's] [2008-01-11 15:29:27] [c8635c97647ba59406cb570a9fab7b02] [Current] | |||||||||||||||||||||||||||||||||||||||
| Feedback Forum | |||||||||||||||||||||||||||||||||||||||
Post a new message | |||||||||||||||||||||||||||||||||||||||
Dataset | |||||||||||||||||||||||||||||||||||||||
| Dataseries X: | |||||||||||||||||||||||||||||||||||||||
-5.97140410767898 -3.6691753651635 3.22573243778312 8.46994742622872 2.36104613837392 2.27810301334516 -1.89643356409454 -5.57048190071753 1.59306810529995 -1.15395525058041 -6.72929075561101 5.66399576285171 0.880403851972294 0.0619490573441767 8.08456537817682 -6.2448790022095 -2.24567792980042 2.59166701507407 0.601813487319091 4.8272769098794 5.09668174354169 -3.33658622020570 5.34417316066118 1.99609666699276 0.415333303125725 -0.900878021038933 -3.09016502696032 -1.53443811684522 5.61627406480226 -0.498380340378351 -0.443356334553083 -2.97096557941350 0.937268288719855 0.471804866159551 -0.0743614606905861 -6.83970786794111 -0.673055658412168 2.52156302681157 -8.65114003996448 -3.54390202061101 -4.50157864426839 -3.61584164436451 -1.48647635742622 1.68874294472572 -6.24526584517324 3.14185515887046 0.155104567902546 -4.48946146647238 1.49426292301859 1.98654130204668 0.431007250964857 2.85327171343702 -1.23006362910736 -0.75554804367637 3.22445276875476 2.02542762552591 -1.38175229238826 0.876881445756102 1.30437448773787 3.669076904569 3.85445968797453 | |||||||||||||||||||||||||||||||||||||||
Tables (Output of Computation) | |||||||||||||||||||||||||||||||||||||||
| |||||||||||||||||||||||||||||||||||||||
Figures (Output of Computation) | |||||||||||||||||||||||||||||||||||||||
Input Parameters & R Code | |||||||||||||||||||||||||||||||||||||||
| Parameters (Session): | |||||||||||||||||||||||||||||||||||||||
| par1 = 8 ; par2 = 0 ; | |||||||||||||||||||||||||||||||||||||||
| Parameters (R input): | |||||||||||||||||||||||||||||||||||||||
| par1 = 8 ; par2 = 0 ; | |||||||||||||||||||||||||||||||||||||||
| R code (references can be found in the software module): | |||||||||||||||||||||||||||||||||||||||
library(MASS) | |||||||||||||||||||||||||||||||||||||||