Free Statistics

of Irreproducible Research!

Author's title

Author*Unverified author*
R Software Modulerwasp_multipleregression.wasp
Title produced by softwareMultiple Regression
Date of computationWed, 09 Jan 2008 05:10:56 -0700
Cite this page as followsStatistical Computations at FreeStatistics.org, Office for Research Development and Education, URL https://freestatistics.org/blog/index.php?v=date/2008/Jan/09/t11998808352epdxu4w3luocqn.htm/, Retrieved Wed, 15 May 2024 22:06:23 +0000
Statistical Computations at FreeStatistics.org, Office for Research Development and Education, URL https://freestatistics.org/blog/index.php?pk=7934, Retrieved Wed, 15 May 2024 22:06:23 +0000
QR Codes:

Original text written by user:
IsPrivate?No (this computation is public)
User-defined keywords
Estimated Impact249
Family? (F = Feedback message, R = changed R code, M = changed R Module, P = changed Parameters, D = changed Data)
-       [Multiple Regression] [regressie 2] [2008-01-09 12:10:56] [d41d8cd98f00b204e9800998ecf8427e] [Current]
Feedback Forum

Post a new message
Dataseries X:
1.0137	89.97
0.9834	99.8
0.9643	112.99
0.947	93.69
0.906	108.02
0.9492	99.11
0.9397	94.33
0.9041	83.75
0.8721	106.37
0.8552	109.63
0.8564	105.5
0.8973	96.13
0.9383	102.48
0.9217	101.37
0.9095	112.76
0.892	95.57
0.8742	102.81
0.8532	104.13
0.8607	97.52
0.9005	85.29
0.9111	101.01
0.9059	108.48
0.8883	101.33
0.8924	87.57
0.8833	97.44
0.87	96.06
0.8758	106.67
0.8858	102.67
0.917	104.54
0.9554	102.46
0.9922	103.35
0.9778	83.27
0.9808	108.22
0.9811	115.23
1.0014	103.7
1.0183	93.61
1.0622	100.25
1.0773	100.56
1.0807	108.86
1.0848	105.43
1.1582	104.77
1.1663	109.13
1.1372	106.13
1.1139	82.27
1.1222	113.6
1.1692	117.73
1.1702	104.83
1.2286	104.61
1.2613	102.93
1.2646	106.95
1.2262	123.45
1.1985	111.99
1.2007	103.95
1.2138	122.05
1.2266	108.04
1.2176	93.72
1.2218	119.61
1.249	118.29
1.2991	117.14
1.3408	112.76
1.3119	105.97
1.3014	107.96
1.3201	122.27
1.2938	114.54
1.2694	110.15
1.2165	120.02
1.2037	103.94
1.2292	96.18
1.2256	121.01
1.2015	110.55
1.1786	120.04
1.1856	114.19


Summary of compuational transaction
Raw Inputview raw input (R code)
Raw Outputview raw output of R engine
Computing time4 seconds
R Server'Gwilym Jenkins' @ 72.249.127.135

\begin{tabular}{lllllllll}
\hline
Summary of compuational transaction \tabularnewline
Raw Input & view raw input (R code)  \tabularnewline
Raw Output & view raw output of R engine  \tabularnewline
Computing time & 4 seconds \tabularnewline
R Server & 'Gwilym Jenkins' @ 72.249.127.135 \tabularnewline
\hline
\end{tabular}
%Source: https://freestatistics.org/blog/index.php?pk=7934&T=0

[TABLE]
[ROW][C]Summary of compuational transaction[/C][/ROW]
[ROW][C]Raw Input[/C][C]view raw input (R code) [/C][/ROW]
[ROW][C]Raw Output[/C][C]view raw output of R engine [/C][/ROW]
[ROW][C]Computing time[/C][C]4 seconds[/C][/ROW]
[ROW][C]R Server[/C][C]'Gwilym Jenkins' @ 72.249.127.135[/C][/ROW]
[/TABLE]
Source: https://freestatistics.org/blog/index.php?pk=7934&T=0

Globally Unique Identifier (entire table): ba.freestatistics.org/blog/index.php?pk=7934&T=0

As an alternative you can also use a QR Code:  

The GUIDs for individual cells are displayed in the table below:

Summary of compuational transaction
Raw Inputview raw input (R code)
Raw Outputview raw output of R engine
Computing time4 seconds
R Server'Gwilym Jenkins' @ 72.249.127.135


Multiple Linear Regression - Estimated Regression Equation
(1-B)uit[t] = + 0.387755793465986 -19.2592282494765`(1-B)wk`[t] + e[t]

\begin{tabular}{lllllllll}
\hline
Multiple Linear Regression - Estimated Regression Equation \tabularnewline
(1-B)uit[t] =  +  0.387755793465986 -19.2592282494765`(1-B)wk`[t]  + e[t] \tabularnewline
\hline
\end{tabular}
%Source: https://freestatistics.org/blog/index.php?pk=7934&T=1

[TABLE]
[ROW][C]Multiple Linear Regression - Estimated Regression Equation[/C][/ROW]
[ROW][C](1-B)uit[t] =  +  0.387755793465986 -19.2592282494765`(1-B)wk`[t]  + e[t][/C][/ROW]
[/TABLE]
Source: https://freestatistics.org/blog/index.php?pk=7934&T=1

Globally Unique Identifier (entire table): ba.freestatistics.org/blog/index.php?pk=7934&T=1

As an alternative you can also use a QR Code:  

The GUIDs for individual cells are displayed in the table below:

Multiple Linear Regression - Estimated Regression Equation
(1-B)uit[t] = + 0.387755793465986 -19.2592282494765`(1-B)wk`[t] + e[t]


Multiple Linear Regression - Ordinary Least Squares
VariableParameterS.D.T-STATH0: parameter = 02-tail p-value1-tail p-value
(Intercept)0.3877557934659861.4247740.27220.7863170.393159
`(1-B)wk`-19.259228249476553.326139-0.36120.7190840.359542

\begin{tabular}{lllllllll}
\hline
Multiple Linear Regression - Ordinary Least Squares \tabularnewline
Variable & Parameter & S.D. & T-STATH0: parameter = 0 & 2-tail p-value & 1-tail p-value \tabularnewline
(Intercept) & 0.387755793465986 & 1.424774 & 0.2722 & 0.786317 & 0.393159 \tabularnewline
`(1-B)wk` & -19.2592282494765 & 53.326139 & -0.3612 & 0.719084 & 0.359542 \tabularnewline
\hline
\end{tabular}
%Source: https://freestatistics.org/blog/index.php?pk=7934&T=2

[TABLE]
[ROW][C]Multiple Linear Regression - Ordinary Least Squares[/C][/ROW]
[ROW][C]Variable[/C][C]Parameter[/C][C]S.D.[/C][C]T-STATH0: parameter = 0[/C][C]2-tail p-value[/C][C]1-tail p-value[/C][/ROW]
[ROW][C](Intercept)[/C][C]0.387755793465986[/C][C]1.424774[/C][C]0.2722[/C][C]0.786317[/C][C]0.393159[/C][/ROW]
[ROW][C]`(1-B)wk`[/C][C]-19.2592282494765[/C][C]53.326139[/C][C]-0.3612[/C][C]0.719084[/C][C]0.359542[/C][/ROW]
[/TABLE]
Source: https://freestatistics.org/blog/index.php?pk=7934&T=2

Globally Unique Identifier (entire table): ba.freestatistics.org/blog/index.php?pk=7934&T=2

As an alternative you can also use a QR Code:  

The GUIDs for individual cells are displayed in the table below:

Multiple Linear Regression - Ordinary Least Squares
VariableParameterS.D.T-STATH0: parameter = 02-tail p-value1-tail p-value
(Intercept)0.3877557934659861.4247740.27220.7863170.393159
`(1-B)wk`-19.259228249476553.326139-0.36120.7190840.359542


Multiple Linear Regression - Regression Statistics
Multiple R0.0434374270323568
R-squared0.00188681006719132
Adjusted R-squared-0.0125785984825597
F-TEST (value)0.130436002599029
F-TEST (DF numerator)1
F-TEST (DF denominator)69
p-value0.719083885131171
Multiple Linear Regression - Residual Statistics
Residual Standard Deviation11.9559627531964
Sum Squared Residuals9863.2081295516

\begin{tabular}{lllllllll}
\hline
Multiple Linear Regression - Regression Statistics \tabularnewline
Multiple R & 0.0434374270323568 \tabularnewline
R-squared & 0.00188681006719132 \tabularnewline
Adjusted R-squared & -0.0125785984825597 \tabularnewline
F-TEST (value) & 0.130436002599029 \tabularnewline
F-TEST (DF numerator) & 1 \tabularnewline
F-TEST (DF denominator) & 69 \tabularnewline
p-value & 0.719083885131171 \tabularnewline
Multiple Linear Regression - Residual Statistics \tabularnewline
Residual Standard Deviation & 11.9559627531964 \tabularnewline
Sum Squared Residuals & 9863.2081295516 \tabularnewline
\hline
\end{tabular}
%Source: https://freestatistics.org/blog/index.php?pk=7934&T=3

[TABLE]
[ROW][C]Multiple Linear Regression - Regression Statistics[/C][/ROW]
[ROW][C]Multiple R[/C][C]0.0434374270323568[/C][/ROW]
[ROW][C]R-squared[/C][C]0.00188681006719132[/C][/ROW]
[ROW][C]Adjusted R-squared[/C][C]-0.0125785984825597[/C][/ROW]
[ROW][C]F-TEST (value)[/C][C]0.130436002599029[/C][/ROW]
[ROW][C]F-TEST (DF numerator)[/C][C]1[/C][/ROW]
[ROW][C]F-TEST (DF denominator)[/C][C]69[/C][/ROW]
[ROW][C]p-value[/C][C]0.719083885131171[/C][/ROW]
[ROW][C]Multiple Linear Regression - Residual Statistics[/C][/ROW]
[ROW][C]Residual Standard Deviation[/C][C]11.9559627531964[/C][/ROW]
[ROW][C]Sum Squared Residuals[/C][C]9863.2081295516[/C][/ROW]
[/TABLE]
Source: https://freestatistics.org/blog/index.php?pk=7934&T=3

Globally Unique Identifier (entire table): ba.freestatistics.org/blog/index.php?pk=7934&T=3

As an alternative you can also use a QR Code:  

The GUIDs for individual cells are displayed in the table below:

Multiple Linear Regression - Regression Statistics
Multiple R0.0434374270323568
R-squared0.00188681006719132
Adjusted R-squared-0.0125785984825597
F-TEST (value)0.130436002599029
F-TEST (DF numerator)1
F-TEST (DF denominator)69
p-value0.719083885131171
Multiple Linear Regression - Residual Statistics
Residual Standard Deviation11.9559627531964
Sum Squared Residuals9863.2081295516


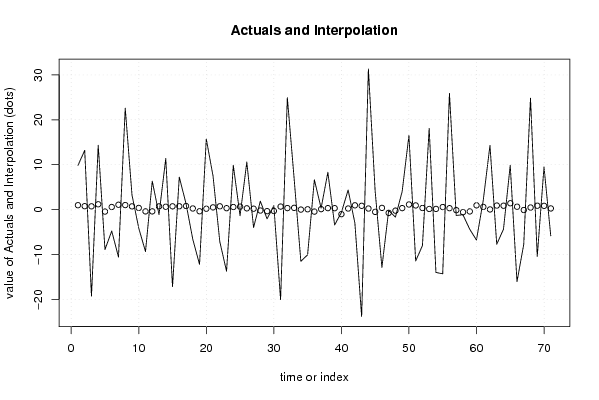
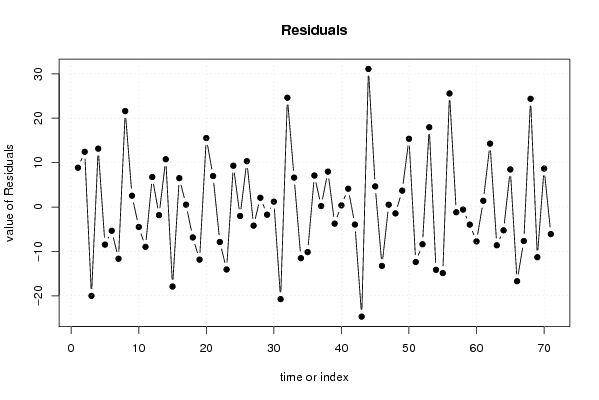
Multiple Linear Regression - Actuals, Interpolation, and Residuals
Time or IndexActualsInterpolationForecastResidualsPrediction Error
19.830.9713104094251268.85868959057487
213.190.75560705303099112.434392946969
3-19.30.72094044218193-20.0209404421819
414.331.1773841516945213.1526158483055
5-8.91-0.444242866911400-8.4657571330886
6-4.780.570718461836014-5.35071846183602
7-10.581.07338431914735-11.6533843191473
822.621.0040510974492321.6159489025508
93.259999999999990.713236750882142.54676324911785
10-4.130000000000000.364644719566613-4.49464471956661
11-9.37-0.399946641937602-8.9700533580624
126.35000000000001-0.4018725647625516.75187256476256
13-1.110.707458982407297-1.81745898240730
1411.390.62271837810959810.7672816218904
15-17.190.724792287831825-17.9147922878318
167.240000000000010.730570056306676.50942994369334
171.319999999999990.7921995867049930.527800413295
18-6.610.243311581594911-6.85331158159491
19-12.23-0.37876149086318-11.8512385091368
2015.720.18360797402153215.5363920259785
217.470.4879037803632646.98209621963673
22-7.150.726718210656775-7.87671821065678
23-13.760.308792957643131-14.0687929576431
249.870.5630147705362229.30698522946378
25-1.380000000000000.643903529184023-2.02390352918402
2610.610.27605226961902010.3339477303810
27-40.195163510971221-4.19516351097122
281.87000000000000-0.2131321279176812.08313212791769
29-2.08000000000001-0.351798571313912-1.7282014286861
300.89-0.3209838061147481.21098380611475
31-20.080.66508868025845-20.7450886802584
3224.950.32997810871755524.6200218912824
337.010.3819780249911446.62802197500886
34-11.53-0.0032065399983896-11.5267934600016
35-10.090.0622748360498342-10.1522748360498
366.64-0.4577243266860337.09772432668603
370.3100000000000020.0969414468988930.213058553101109
388.30.3222744174177657.97772558258223
39-3.429999999999990.308792957643133-3.73879295764313
40-0.660000000000011-1.025871560045590.365871560045577
414.360.2317560446452274.12824395535477
42-30.94819933552575-3.94819933552575
43-23.860.836495811678791-24.6964958116788
4431.330.22790419899532931.1020958010047
454.13000000000001-0.5174279342594094.64742793425942
46-12.90.36849656521651-13.2684965652165
47-0.219999999999999-0.7369831363034420.516983136303443
48-1.67999999999999-0.242020970291899-1.43797902970809
494.020.3242003402427163.69579965975728
5016.51.1273101582458815.3726898417541
51-11.460.921236415976486-12.3812364159765
52-8.040.345385491317133-8.38538549131713
5318.10.13545990339784817.9645400966021
54-14.010.141237671872688-14.1512376718727
55-14.320.561088847711272-14.8810888477113
5625.890.30686703481818625.5831329651818
57-1.31999999999999-0.136095214919778-1.18390478508022
58-1.15000000000001-0.577131541832783-0.572868458167222
59-4.3800-0.415354024537187-3.96464597546281
60-6.790000000000010.944347489875855-7.73434748987586
611.989999999999990.5899776900854931.40002230991450
6214.310.027608225200770814.2823917747992
63-7.729999999999990.894273496427218-8.6242734964272
64-4.390.857680962753212-5.24768096275321
659.871.406568967863308.4634310321367
66-16.080.634273915059286-16.7142739150593
67-7.75999999999999-0.103354526895667-7.65664547310432
6824.830.45708901516410424.3729109848359
69-10.460.85190319427837-11.3119031942784
709.490.8287921203789968.66120787962101
71-5.850000000000010.252941195719653-6.10294119571966
72-0.0303NANA

\begin{tabular}{lllllllll}
\hline
Multiple Linear Regression - Actuals, Interpolation, and Residuals \tabularnewline
Time or Index & Actuals & InterpolationForecast & ResidualsPrediction Error \tabularnewline
1 & 9.83 & 0.971310409425126 & 8.85868959057487 \tabularnewline
2 & 13.19 & 0.755607053030991 & 12.434392946969 \tabularnewline
3 & -19.3 & 0.72094044218193 & -20.0209404421819 \tabularnewline
4 & 14.33 & 1.17738415169452 & 13.1526158483055 \tabularnewline
5 & -8.91 & -0.444242866911400 & -8.4657571330886 \tabularnewline
6 & -4.78 & 0.570718461836014 & -5.35071846183602 \tabularnewline
7 & -10.58 & 1.07338431914735 & -11.6533843191473 \tabularnewline
8 & 22.62 & 1.00405109744923 & 21.6159489025508 \tabularnewline
9 & 3.25999999999999 & 0.71323675088214 & 2.54676324911785 \tabularnewline
10 & -4.13000000000000 & 0.364644719566613 & -4.49464471956661 \tabularnewline
11 & -9.37 & -0.399946641937602 & -8.9700533580624 \tabularnewline
12 & 6.35000000000001 & -0.401872564762551 & 6.75187256476256 \tabularnewline
13 & -1.11 & 0.707458982407297 & -1.81745898240730 \tabularnewline
14 & 11.39 & 0.622718378109598 & 10.7672816218904 \tabularnewline
15 & -17.19 & 0.724792287831825 & -17.9147922878318 \tabularnewline
16 & 7.24000000000001 & 0.73057005630667 & 6.50942994369334 \tabularnewline
17 & 1.31999999999999 & 0.792199586704993 & 0.527800413295 \tabularnewline
18 & -6.61 & 0.243311581594911 & -6.85331158159491 \tabularnewline
19 & -12.23 & -0.37876149086318 & -11.8512385091368 \tabularnewline
20 & 15.72 & 0.183607974021532 & 15.5363920259785 \tabularnewline
21 & 7.47 & 0.487903780363264 & 6.98209621963673 \tabularnewline
22 & -7.15 & 0.726718210656775 & -7.87671821065678 \tabularnewline
23 & -13.76 & 0.308792957643131 & -14.0687929576431 \tabularnewline
24 & 9.87 & 0.563014770536222 & 9.30698522946378 \tabularnewline
25 & -1.38000000000000 & 0.643903529184023 & -2.02390352918402 \tabularnewline
26 & 10.61 & 0.276052269619020 & 10.3339477303810 \tabularnewline
27 & -4 & 0.195163510971221 & -4.19516351097122 \tabularnewline
28 & 1.87000000000000 & -0.213132127917681 & 2.08313212791769 \tabularnewline
29 & -2.08000000000001 & -0.351798571313912 & -1.7282014286861 \tabularnewline
30 & 0.89 & -0.320983806114748 & 1.21098380611475 \tabularnewline
31 & -20.08 & 0.66508868025845 & -20.7450886802584 \tabularnewline
32 & 24.95 & 0.329978108717555 & 24.6200218912824 \tabularnewline
33 & 7.01 & 0.381978024991144 & 6.62802197500886 \tabularnewline
34 & -11.53 & -0.0032065399983896 & -11.5267934600016 \tabularnewline
35 & -10.09 & 0.0622748360498342 & -10.1522748360498 \tabularnewline
36 & 6.64 & -0.457724326686033 & 7.09772432668603 \tabularnewline
37 & 0.310000000000002 & 0.096941446898893 & 0.213058553101109 \tabularnewline
38 & 8.3 & 0.322274417417765 & 7.97772558258223 \tabularnewline
39 & -3.42999999999999 & 0.308792957643133 & -3.73879295764313 \tabularnewline
40 & -0.660000000000011 & -1.02587156004559 & 0.365871560045577 \tabularnewline
41 & 4.36 & 0.231756044645227 & 4.12824395535477 \tabularnewline
42 & -3 & 0.94819933552575 & -3.94819933552575 \tabularnewline
43 & -23.86 & 0.836495811678791 & -24.6964958116788 \tabularnewline
44 & 31.33 & 0.227904198995329 & 31.1020958010047 \tabularnewline
45 & 4.13000000000001 & -0.517427934259409 & 4.64742793425942 \tabularnewline
46 & -12.9 & 0.36849656521651 & -13.2684965652165 \tabularnewline
47 & -0.219999999999999 & -0.736983136303442 & 0.516983136303443 \tabularnewline
48 & -1.67999999999999 & -0.242020970291899 & -1.43797902970809 \tabularnewline
49 & 4.02 & 0.324200340242716 & 3.69579965975728 \tabularnewline
50 & 16.5 & 1.12731015824588 & 15.3726898417541 \tabularnewline
51 & -11.46 & 0.921236415976486 & -12.3812364159765 \tabularnewline
52 & -8.04 & 0.345385491317133 & -8.38538549131713 \tabularnewline
53 & 18.1 & 0.135459903397848 & 17.9645400966021 \tabularnewline
54 & -14.01 & 0.141237671872688 & -14.1512376718727 \tabularnewline
55 & -14.32 & 0.561088847711272 & -14.8810888477113 \tabularnewline
56 & 25.89 & 0.306867034818186 & 25.5831329651818 \tabularnewline
57 & -1.31999999999999 & -0.136095214919778 & -1.18390478508022 \tabularnewline
58 & -1.15000000000001 & -0.577131541832783 & -0.572868458167222 \tabularnewline
59 & -4.3800 & -0.415354024537187 & -3.96464597546281 \tabularnewline
60 & -6.79000000000001 & 0.944347489875855 & -7.73434748987586 \tabularnewline
61 & 1.98999999999999 & 0.589977690085493 & 1.40002230991450 \tabularnewline
62 & 14.31 & 0.0276082252007708 & 14.2823917747992 \tabularnewline
63 & -7.72999999999999 & 0.894273496427218 & -8.6242734964272 \tabularnewline
64 & -4.39 & 0.857680962753212 & -5.24768096275321 \tabularnewline
65 & 9.87 & 1.40656896786330 & 8.4634310321367 \tabularnewline
66 & -16.08 & 0.634273915059286 & -16.7142739150593 \tabularnewline
67 & -7.75999999999999 & -0.103354526895667 & -7.65664547310432 \tabularnewline
68 & 24.83 & 0.457089015164104 & 24.3729109848359 \tabularnewline
69 & -10.46 & 0.85190319427837 & -11.3119031942784 \tabularnewline
70 & 9.49 & 0.828792120378996 & 8.66120787962101 \tabularnewline
71 & -5.85000000000001 & 0.252941195719653 & -6.10294119571966 \tabularnewline
72 & -0.0303 & NA & NA \tabularnewline
\hline
\end{tabular}
%Source: https://freestatistics.org/blog/index.php?pk=7934&T=4

[TABLE]
[ROW][C]Multiple Linear Regression - Actuals, Interpolation, and Residuals[/C][/ROW]
[ROW][C]Time or Index[/C][C]Actuals[/C][C]InterpolationForecast[/C][C]ResidualsPrediction Error[/C][/ROW]
[ROW][C]1[/C][C]9.83[/C][C]0.971310409425126[/C][C]8.85868959057487[/C][/ROW]
[ROW][C]2[/C][C]13.19[/C][C]0.755607053030991[/C][C]12.434392946969[/C][/ROW]
[ROW][C]3[/C][C]-19.3[/C][C]0.72094044218193[/C][C]-20.0209404421819[/C][/ROW]
[ROW][C]4[/C][C]14.33[/C][C]1.17738415169452[/C][C]13.1526158483055[/C][/ROW]
[ROW][C]5[/C][C]-8.91[/C][C]-0.444242866911400[/C][C]-8.4657571330886[/C][/ROW]
[ROW][C]6[/C][C]-4.78[/C][C]0.570718461836014[/C][C]-5.35071846183602[/C][/ROW]
[ROW][C]7[/C][C]-10.58[/C][C]1.07338431914735[/C][C]-11.6533843191473[/C][/ROW]
[ROW][C]8[/C][C]22.62[/C][C]1.00405109744923[/C][C]21.6159489025508[/C][/ROW]
[ROW][C]9[/C][C]3.25999999999999[/C][C]0.71323675088214[/C][C]2.54676324911785[/C][/ROW]
[ROW][C]10[/C][C]-4.13000000000000[/C][C]0.364644719566613[/C][C]-4.49464471956661[/C][/ROW]
[ROW][C]11[/C][C]-9.37[/C][C]-0.399946641937602[/C][C]-8.9700533580624[/C][/ROW]
[ROW][C]12[/C][C]6.35000000000001[/C][C]-0.401872564762551[/C][C]6.75187256476256[/C][/ROW]
[ROW][C]13[/C][C]-1.11[/C][C]0.707458982407297[/C][C]-1.81745898240730[/C][/ROW]
[ROW][C]14[/C][C]11.39[/C][C]0.622718378109598[/C][C]10.7672816218904[/C][/ROW]
[ROW][C]15[/C][C]-17.19[/C][C]0.724792287831825[/C][C]-17.9147922878318[/C][/ROW]
[ROW][C]16[/C][C]7.24000000000001[/C][C]0.73057005630667[/C][C]6.50942994369334[/C][/ROW]
[ROW][C]17[/C][C]1.31999999999999[/C][C]0.792199586704993[/C][C]0.527800413295[/C][/ROW]
[ROW][C]18[/C][C]-6.61[/C][C]0.243311581594911[/C][C]-6.85331158159491[/C][/ROW]
[ROW][C]19[/C][C]-12.23[/C][C]-0.37876149086318[/C][C]-11.8512385091368[/C][/ROW]
[ROW][C]20[/C][C]15.72[/C][C]0.183607974021532[/C][C]15.5363920259785[/C][/ROW]
[ROW][C]21[/C][C]7.47[/C][C]0.487903780363264[/C][C]6.98209621963673[/C][/ROW]
[ROW][C]22[/C][C]-7.15[/C][C]0.726718210656775[/C][C]-7.87671821065678[/C][/ROW]
[ROW][C]23[/C][C]-13.76[/C][C]0.308792957643131[/C][C]-14.0687929576431[/C][/ROW]
[ROW][C]24[/C][C]9.87[/C][C]0.563014770536222[/C][C]9.30698522946378[/C][/ROW]
[ROW][C]25[/C][C]-1.38000000000000[/C][C]0.643903529184023[/C][C]-2.02390352918402[/C][/ROW]
[ROW][C]26[/C][C]10.61[/C][C]0.276052269619020[/C][C]10.3339477303810[/C][/ROW]
[ROW][C]27[/C][C]-4[/C][C]0.195163510971221[/C][C]-4.19516351097122[/C][/ROW]
[ROW][C]28[/C][C]1.87000000000000[/C][C]-0.213132127917681[/C][C]2.08313212791769[/C][/ROW]
[ROW][C]29[/C][C]-2.08000000000001[/C][C]-0.351798571313912[/C][C]-1.7282014286861[/C][/ROW]
[ROW][C]30[/C][C]0.89[/C][C]-0.320983806114748[/C][C]1.21098380611475[/C][/ROW]
[ROW][C]31[/C][C]-20.08[/C][C]0.66508868025845[/C][C]-20.7450886802584[/C][/ROW]
[ROW][C]32[/C][C]24.95[/C][C]0.329978108717555[/C][C]24.6200218912824[/C][/ROW]
[ROW][C]33[/C][C]7.01[/C][C]0.381978024991144[/C][C]6.62802197500886[/C][/ROW]
[ROW][C]34[/C][C]-11.53[/C][C]-0.0032065399983896[/C][C]-11.5267934600016[/C][/ROW]
[ROW][C]35[/C][C]-10.09[/C][C]0.0622748360498342[/C][C]-10.1522748360498[/C][/ROW]
[ROW][C]36[/C][C]6.64[/C][C]-0.457724326686033[/C][C]7.09772432668603[/C][/ROW]
[ROW][C]37[/C][C]0.310000000000002[/C][C]0.096941446898893[/C][C]0.213058553101109[/C][/ROW]
[ROW][C]38[/C][C]8.3[/C][C]0.322274417417765[/C][C]7.97772558258223[/C][/ROW]
[ROW][C]39[/C][C]-3.42999999999999[/C][C]0.308792957643133[/C][C]-3.73879295764313[/C][/ROW]
[ROW][C]40[/C][C]-0.660000000000011[/C][C]-1.02587156004559[/C][C]0.365871560045577[/C][/ROW]
[ROW][C]41[/C][C]4.36[/C][C]0.231756044645227[/C][C]4.12824395535477[/C][/ROW]
[ROW][C]42[/C][C]-3[/C][C]0.94819933552575[/C][C]-3.94819933552575[/C][/ROW]
[ROW][C]43[/C][C]-23.86[/C][C]0.836495811678791[/C][C]-24.6964958116788[/C][/ROW]
[ROW][C]44[/C][C]31.33[/C][C]0.227904198995329[/C][C]31.1020958010047[/C][/ROW]
[ROW][C]45[/C][C]4.13000000000001[/C][C]-0.517427934259409[/C][C]4.64742793425942[/C][/ROW]
[ROW][C]46[/C][C]-12.9[/C][C]0.36849656521651[/C][C]-13.2684965652165[/C][/ROW]
[ROW][C]47[/C][C]-0.219999999999999[/C][C]-0.736983136303442[/C][C]0.516983136303443[/C][/ROW]
[ROW][C]48[/C][C]-1.67999999999999[/C][C]-0.242020970291899[/C][C]-1.43797902970809[/C][/ROW]
[ROW][C]49[/C][C]4.02[/C][C]0.324200340242716[/C][C]3.69579965975728[/C][/ROW]
[ROW][C]50[/C][C]16.5[/C][C]1.12731015824588[/C][C]15.3726898417541[/C][/ROW]
[ROW][C]51[/C][C]-11.46[/C][C]0.921236415976486[/C][C]-12.3812364159765[/C][/ROW]
[ROW][C]52[/C][C]-8.04[/C][C]0.345385491317133[/C][C]-8.38538549131713[/C][/ROW]
[ROW][C]53[/C][C]18.1[/C][C]0.135459903397848[/C][C]17.9645400966021[/C][/ROW]
[ROW][C]54[/C][C]-14.01[/C][C]0.141237671872688[/C][C]-14.1512376718727[/C][/ROW]
[ROW][C]55[/C][C]-14.32[/C][C]0.561088847711272[/C][C]-14.8810888477113[/C][/ROW]
[ROW][C]56[/C][C]25.89[/C][C]0.306867034818186[/C][C]25.5831329651818[/C][/ROW]
[ROW][C]57[/C][C]-1.31999999999999[/C][C]-0.136095214919778[/C][C]-1.18390478508022[/C][/ROW]
[ROW][C]58[/C][C]-1.15000000000001[/C][C]-0.577131541832783[/C][C]-0.572868458167222[/C][/ROW]
[ROW][C]59[/C][C]-4.3800[/C][C]-0.415354024537187[/C][C]-3.96464597546281[/C][/ROW]
[ROW][C]60[/C][C]-6.79000000000001[/C][C]0.944347489875855[/C][C]-7.73434748987586[/C][/ROW]
[ROW][C]61[/C][C]1.98999999999999[/C][C]0.589977690085493[/C][C]1.40002230991450[/C][/ROW]
[ROW][C]62[/C][C]14.31[/C][C]0.0276082252007708[/C][C]14.2823917747992[/C][/ROW]
[ROW][C]63[/C][C]-7.72999999999999[/C][C]0.894273496427218[/C][C]-8.6242734964272[/C][/ROW]
[ROW][C]64[/C][C]-4.39[/C][C]0.857680962753212[/C][C]-5.24768096275321[/C][/ROW]
[ROW][C]65[/C][C]9.87[/C][C]1.40656896786330[/C][C]8.4634310321367[/C][/ROW]
[ROW][C]66[/C][C]-16.08[/C][C]0.634273915059286[/C][C]-16.7142739150593[/C][/ROW]
[ROW][C]67[/C][C]-7.75999999999999[/C][C]-0.103354526895667[/C][C]-7.65664547310432[/C][/ROW]
[ROW][C]68[/C][C]24.83[/C][C]0.457089015164104[/C][C]24.3729109848359[/C][/ROW]
[ROW][C]69[/C][C]-10.46[/C][C]0.85190319427837[/C][C]-11.3119031942784[/C][/ROW]
[ROW][C]70[/C][C]9.49[/C][C]0.828792120378996[/C][C]8.66120787962101[/C][/ROW]
[ROW][C]71[/C][C]-5.85000000000001[/C][C]0.252941195719653[/C][C]-6.10294119571966[/C][/ROW]
[ROW][C]72[/C][C]-0.0303[/C][C]NA[/C][C]NA[/C][/ROW]
[/TABLE]
Source: https://freestatistics.org/blog/index.php?pk=7934&T=4

Globally Unique Identifier (entire table): ba.freestatistics.org/blog/index.php?pk=7934&T=4

As an alternative you can also use a QR Code:  

The GUIDs for individual cells are displayed in the table below:

Multiple Linear Regression - Actuals, Interpolation, and Residuals
Time or IndexActualsInterpolationForecastResidualsPrediction Error
19.830.9713104094251268.85868959057487
213.190.75560705303099112.434392946969
3-19.30.72094044218193-20.0209404421819
414.331.1773841516945213.1526158483055
5-8.91-0.444242866911400-8.4657571330886
6-4.780.570718461836014-5.35071846183602
7-10.581.07338431914735-11.6533843191473
822.621.0040510974492321.6159489025508
93.259999999999990.713236750882142.54676324911785
10-4.130000000000000.364644719566613-4.49464471956661
11-9.37-0.399946641937602-8.9700533580624
126.35000000000001-0.4018725647625516.75187256476256
13-1.110.707458982407297-1.81745898240730
1411.390.62271837810959810.7672816218904
15-17.190.724792287831825-17.9147922878318
167.240000000000010.730570056306676.50942994369334
171.319999999999990.7921995867049930.527800413295
18-6.610.243311581594911-6.85331158159491
19-12.23-0.37876149086318-11.8512385091368
2015.720.18360797402153215.5363920259785
217.470.4879037803632646.98209621963673
22-7.150.726718210656775-7.87671821065678
23-13.760.308792957643131-14.0687929576431
249.870.5630147705362229.30698522946378
25-1.380000000000000.643903529184023-2.02390352918402
2610.610.27605226961902010.3339477303810
27-40.195163510971221-4.19516351097122
281.87000000000000-0.2131321279176812.08313212791769
29-2.08000000000001-0.351798571313912-1.7282014286861
300.89-0.3209838061147481.21098380611475
31-20.080.66508868025845-20.7450886802584
3224.950.32997810871755524.6200218912824
337.010.3819780249911446.62802197500886
34-11.53-0.0032065399983896-11.5267934600016
35-10.090.0622748360498342-10.1522748360498
366.64-0.4577243266860337.09772432668603
370.3100000000000020.0969414468988930.213058553101109
388.30.3222744174177657.97772558258223
39-3.429999999999990.308792957643133-3.73879295764313
40-0.660000000000011-1.025871560045590.365871560045577
414.360.2317560446452274.12824395535477
42-30.94819933552575-3.94819933552575
43-23.860.836495811678791-24.6964958116788
4431.330.22790419899532931.1020958010047
454.13000000000001-0.5174279342594094.64742793425942
46-12.90.36849656521651-13.2684965652165
47-0.219999999999999-0.7369831363034420.516983136303443
48-1.67999999999999-0.242020970291899-1.43797902970809
494.020.3242003402427163.69579965975728
5016.51.1273101582458815.3726898417541
51-11.460.921236415976486-12.3812364159765
52-8.040.345385491317133-8.38538549131713
5318.10.13545990339784817.9645400966021
54-14.010.141237671872688-14.1512376718727
55-14.320.561088847711272-14.8810888477113
5625.890.30686703481818625.5831329651818
57-1.31999999999999-0.136095214919778-1.18390478508022
58-1.15000000000001-0.577131541832783-0.572868458167222
59-4.3800-0.415354024537187-3.96464597546281
60-6.790000000000010.944347489875855-7.73434748987586
611.989999999999990.5899776900854931.40002230991450
6214.310.027608225200770814.2823917747992
63-7.729999999999990.894273496427218-8.6242734964272
64-4.390.857680962753212-5.24768096275321
659.871.406568967863308.4634310321367
66-16.080.634273915059286-16.7142739150593
67-7.75999999999999-0.103354526895667-7.65664547310432
6824.830.45708901516410424.3729109848359
69-10.460.85190319427837-11.3119031942784
709.490.8287921203789968.66120787962101
71-5.850000000000010.252941195719653-6.10294119571966
72-0.0303NANA


Parameters (Session):
par1 = 2 ; par2 = Do not include Seasonal Dummies ; par3 = First Differences ;
Parameters (R input):
par1 = 2 ; par2 = Do not include Seasonal Dummies ; par3 = First Differences ;
R code (references can be found in the software module):
library(lattice)
par1 <- as.numeric(par1)
x <- t(y)
k <- length(x[1,])
n <- length(x[,1])
x1 <- cbind(x[,par1], x[,1:k!=par1])
mycolnames <- c(colnames(x)[par1], colnames(x)[1:k!=par1])
colnames(x1) <- mycolnames #colnames(x)[par1]
x <- x1
if (par3 == 'First Differences'){
x2 <- array(0, dim=c(n-1,k), dimnames=list(1:(n-1), paste('(1-B)',colnames(x),sep='')))
for (i in 1:n-1) {
for (j in 1:k) {
x2[i,j] <- x[i+1,j] - x[i,j]
}
}
x <- x2
}
if (par2 == 'Include Monthly Dummies'){
x2 <- array(0, dim=c(n,11), dimnames=list(1:n, paste('M', seq(1:11), sep ='')))
for (i in 1:11){
x2[seq(i,n,12),i] <- 1
}
x <- cbind(x, x2)
}
if (par2 == 'Include Quarterly Dummies'){
x2 <- array(0, dim=c(n,3), dimnames=list(1:n, paste('Q', seq(1:3), sep ='')))
for (i in 1:3){
x2[seq(i,n,4),i] <- 1
}
x <- cbind(x, x2)
}
k <- length(x[1,])
if (par3 == 'Linear Trend'){
x <- cbind(x, c(1:n))
colnames(x)[k+1] <- 't'
}
x
k <- length(x[1,])
df <- as.data.frame(x)
(mylm <- lm(df))
(mysum <- summary(mylm))
bitmap(file='test0.png')
plot(x[,1], type='l', main='Actuals and Interpolation', ylab='value of Actuals and Interpolation (dots)', xlab='time or index')
points(x[,1]-mysum$resid)
grid()
dev.off()
bitmap(file='test1.png')
plot(mysum$resid, type='b', pch=19, main='Residuals', ylab='value of Residuals', xlab='time or index')
grid()
dev.off()
bitmap(file='test2.png')
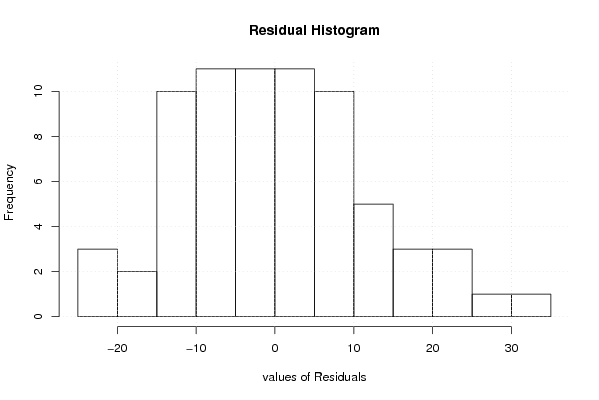
hist(mysum$resid, main='Residual Histogram', xlab='values of Residuals')
grid()
dev.off()
bitmap(file='test3.png')
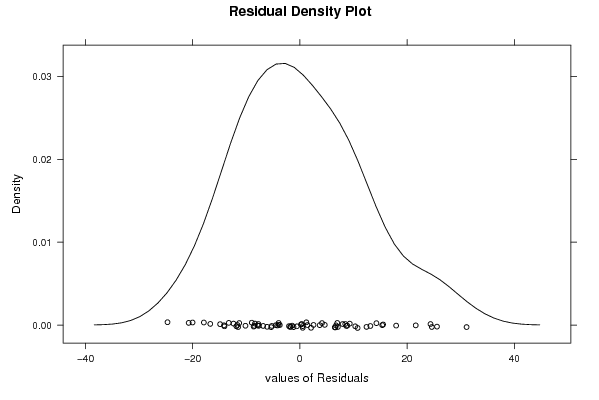
densityplot(~mysum$resid,col='black',main='Residual Density Plot', xlab='values of Residuals')
dev.off()
bitmap(file='test4.png')
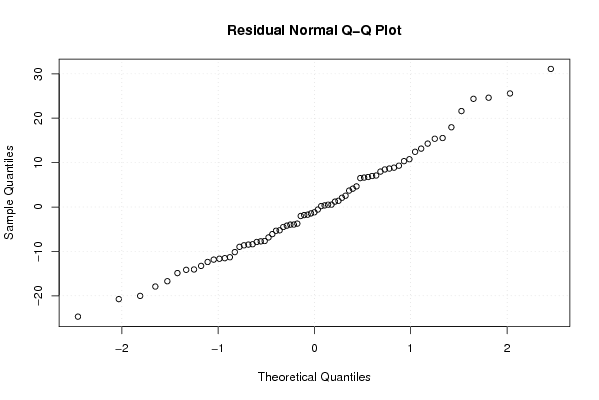
qqnorm(mysum$resid, main='Residual Normal Q-Q Plot')
grid()
dev.off()
(myerror <- as.ts(mysum$resid))
bitmap(file='test5.png')
dum <- cbind(lag(myerror,k=1),myerror)
dum
dum1 <- dum[2:length(myerror),]
dum1
z <- as.data.frame(dum1)
z
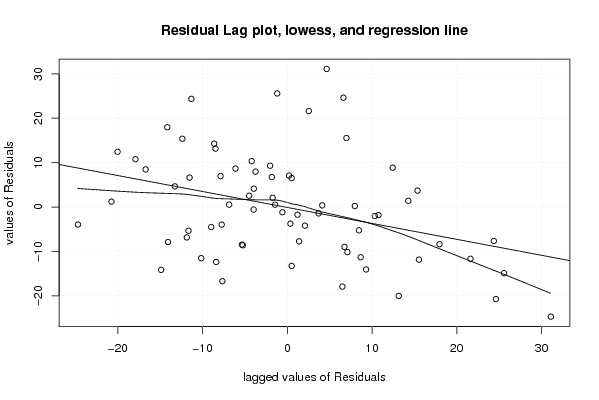
plot(z,main=paste('Residual Lag plot, lowess, and regression line'), ylab='values of Residuals', xlab='lagged values of Residuals')
lines(lowess(z))
abline(lm(z))
grid()
dev.off()
bitmap(file='test6.png')
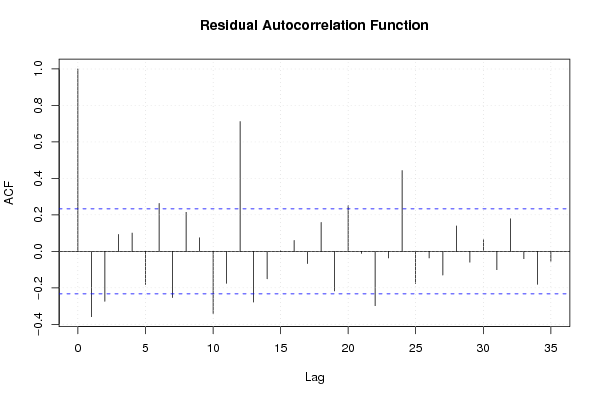
acf(mysum$resid, lag.max=length(mysum$resid)/2, main='Residual Autocorrelation Function')
grid()
dev.off()
bitmap(file='test7.png')
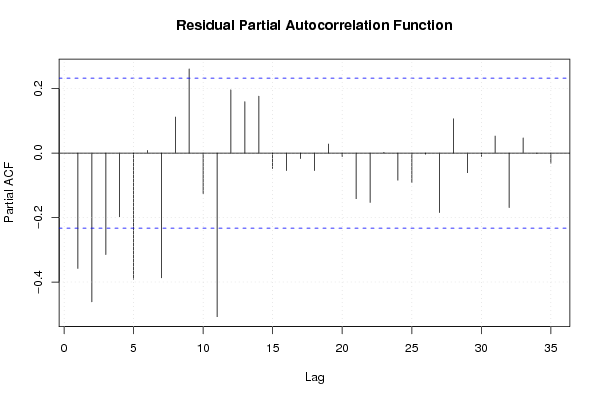
pacf(mysum$resid, lag.max=length(mysum$resid)/2, main='Residual Partial Autocorrelation Function')
grid()
dev.off()
bitmap(file='test8.png')
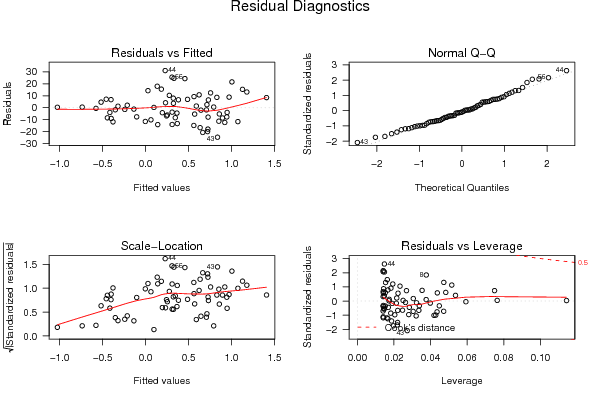
opar <- par(mfrow = c(2,2), oma = c(0, 0, 1.1, 0))
plot(mylm, las = 1, sub='Residual Diagnostics')
par(opar)
dev.off()
load(file='createtable')
a<-table.start()
a<-table.row.start(a)
a<-table.element(a, 'Multiple Linear Regression - Estimated Regression Equation', 1, TRUE)
a<-table.row.end(a)
myeq <- colnames(x)[1]
myeq <- paste(myeq, '[t] = ', sep='')
for (i in 1:k){
if (mysum$coefficients[i,1] > 0) myeq <- paste(myeq, '+', '')
myeq <- paste(myeq, mysum$coefficients[i,1], sep=' ')
if (rownames(mysum$coefficients)[i] != '(Intercept)') {
myeq <- paste(myeq, rownames(mysum$coefficients)[i], sep='')
if (rownames(mysum$coefficients)[i] != 't') myeq <- paste(myeq, '[t]', sep='')
}
}
myeq <- paste(myeq, ' + e[t]')
a<-table.row.start(a)
a<-table.element(a, myeq)
a<-table.row.end(a)
a<-table.end(a)
table.save(a,file='mytable1.tab')
a<-table.start()
a<-table.row.start(a)
a<-table.element(a,hyperlink('ols1.htm','Multiple Linear Regression - Ordinary Least Squares',''), 6, TRUE)
a<-table.row.end(a)
a<-table.row.start(a)
a<-table.element(a,'Variable',header=TRUE)
a<-table.element(a,'Parameter',header=TRUE)
a<-table.element(a,'S.D.',header=TRUE)
a<-table.element(a,'T-STAT
H0: parameter = 0',header=TRUE)
a<-table.element(a,'2-tail p-value',header=TRUE)
a<-table.element(a,'1-tail p-value',header=TRUE)
a<-table.row.end(a)
for (i in 1:k){
a<-table.row.start(a)
a<-table.element(a,rownames(mysum$coefficients)[i],header=TRUE)
a<-table.element(a,mysum$coefficients[i,1])
a<-table.element(a, round(mysum$coefficients[i,2],6))
a<-table.element(a, round(mysum$coefficients[i,3],4))
a<-table.element(a, round(mysum$coefficients[i,4],6))
a<-table.element(a, round(mysum$coefficients[i,4]/2,6))
a<-table.row.end(a)
}
a<-table.end(a)
table.save(a,file='mytable2.tab')
a<-table.start()
a<-table.row.start(a)
a<-table.element(a, 'Multiple Linear Regression - Regression Statistics', 2, TRUE)
a<-table.row.end(a)
a<-table.row.start(a)
a<-table.element(a, 'Multiple R',1,TRUE)
a<-table.element(a, sqrt(mysum$r.squared))
a<-table.row.end(a)
a<-table.row.start(a)
a<-table.element(a, 'R-squared',1,TRUE)
a<-table.element(a, mysum$r.squared)
a<-table.row.end(a)
a<-table.row.start(a)
a<-table.element(a, 'Adjusted R-squared',1,TRUE)
a<-table.element(a, mysum$adj.r.squared)
a<-table.row.end(a)
a<-table.row.start(a)
a<-table.element(a, 'F-TEST (value)',1,TRUE)
a<-table.element(a, mysum$fstatistic[1])
a<-table.row.end(a)
a<-table.row.start(a)
a<-table.element(a, 'F-TEST (DF numerator)',1,TRUE)
a<-table.element(a, mysum$fstatistic[2])
a<-table.row.end(a)
a<-table.row.start(a)
a<-table.element(a, 'F-TEST (DF denominator)',1,TRUE)
a<-table.element(a, mysum$fstatistic[3])
a<-table.row.end(a)
a<-table.row.start(a)
a<-table.element(a, 'p-value',1,TRUE)
a<-table.element(a, 1-pf(mysum$fstatistic[1],mysum$fstatistic[2],mysum$fstatistic[3]))
a<-table.row.end(a)
a<-table.row.start(a)
a<-table.element(a, 'Multiple Linear Regression - Residual Statistics', 2, TRUE)
a<-table.row.end(a)
a<-table.row.start(a)
a<-table.element(a, 'Residual Standard Deviation',1,TRUE)
a<-table.element(a, mysum$sigma)
a<-table.row.end(a)
a<-table.row.start(a)
a<-table.element(a, 'Sum Squared Residuals',1,TRUE)
a<-table.element(a, sum(myerror*myerror))
a<-table.row.end(a)
a<-table.end(a)
table.save(a,file='mytable3.tab')
a<-table.start()
a<-table.row.start(a)
a<-table.element(a, 'Multiple Linear Regression - Actuals, Interpolation, and Residuals', 4, TRUE)
a<-table.row.end(a)
a<-table.row.start(a)
a<-table.element(a, 'Time or Index', 1, TRUE)
a<-table.element(a, 'Actuals', 1, TRUE)
a<-table.element(a, 'Interpolation
Forecast', 1, TRUE)
a<-table.element(a, 'Residuals
Prediction Error', 1, TRUE)
a<-table.row.end(a)
for (i in 1:n) {
a<-table.row.start(a)
a<-table.element(a,i, 1, TRUE)
a<-table.element(a,x[i])
a<-table.element(a,x[i]-mysum$resid[i])
a<-table.element(a,mysum$resid[i])
a<-table.row.end(a)
}
a<-table.end(a)
table.save(a,file='mytable4.tab')